

Socioeconomic Inequalities in the Risk Factors of Noncommunicable Diseases Among Women of Reproductive Age in Sub-saharan Africa: A Multi-Country Analysis of Survey Data
- PMID: 30406072
- PMCID: PMC6207690
- DOI: 10.3389/fpubh.2018.00307
Socioeconomic Inequalities in the Risk Factors of Noncommunicable Diseases Among Women of Reproductive Age in Sub-saharan Africa: A Multi-Country Analysis of Survey Data
Abstract
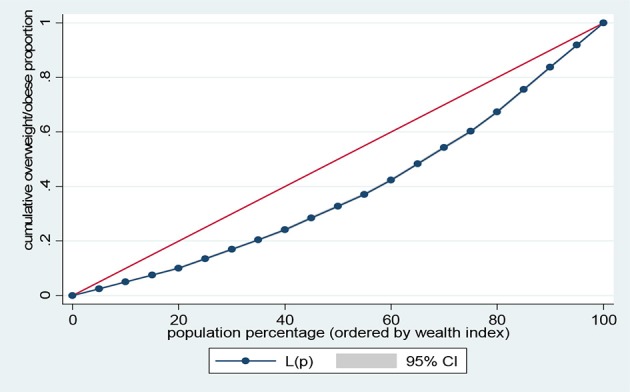
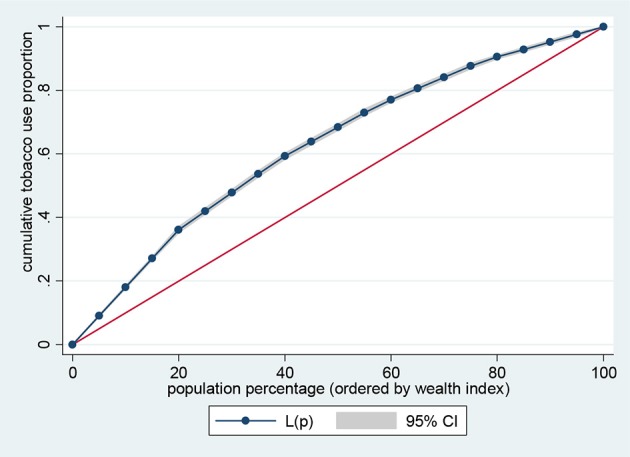
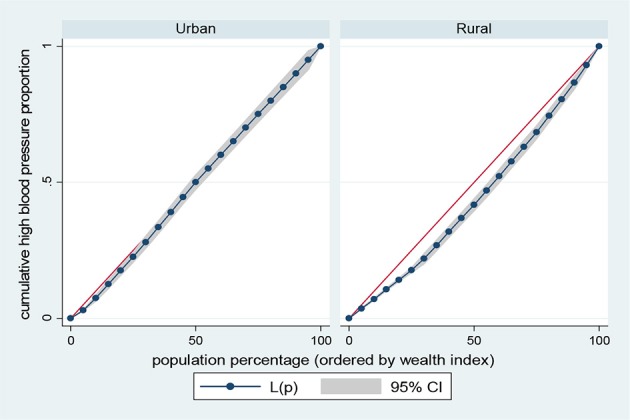
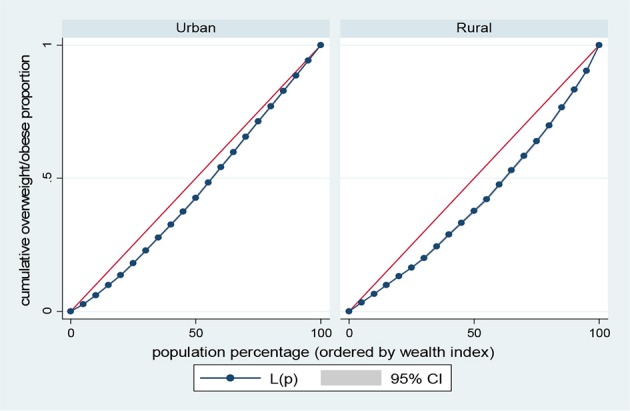
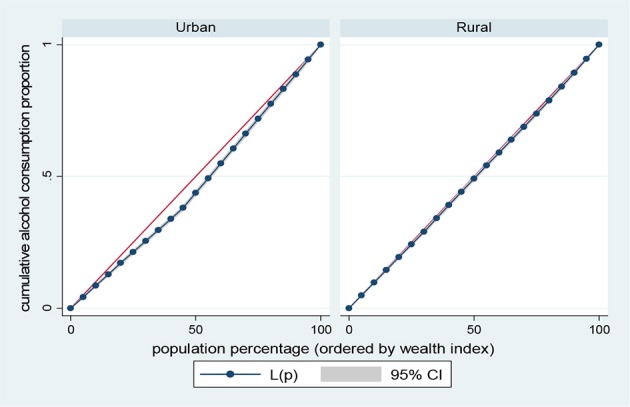
Background: Understanding the socioeconomic discordance associated with the risk factors of non-communicable diseases (NCDs) can help direct effective interventions to end its persistent occurrence. We examined the prevalence of high blood pressure, overweight/obesity, alcohol consumption and tobacco use among women and compared across wealth quintiles in sub-Saharan Africa countries. Methods: This study included 454,080 women of reproductive age (15-49 years) from the current Demographic and Health Survey (DHS) conducted between 2008/09-2017 across 33 sub-Saharan Africa countries. The outcome variables were high blood pressure, overweight/obesity, alcohol consumption and tobacco use. The prevalence of the risk factors of NCDs and sample characteristics across different levels of wealth quintiles were examined. Furthermore, socioeconomic inequalities were measured using concentration index (CI) and Lorenz curve considering urban-rural differentials. Results: The prevalence of high blood pressure and overweight/obesity were 1.2-17.3% and 6.7-44.5% respectively with significant wealth quintile differences. More so, alcohol consumption prevalence was 4.1-47.3% and tobacco use was 0.3-9.9%. The overall prevalence of high blood pressure was 5.5%, overweight/obesity accounted for about 23.1%, alcohol consumption and tobacco users were 23.9 and 2.4%, respectively. The socioeconomic inequalities in high blood pressure (CI = 0.1352, p < 0.001); overweight/obesity (CI = 0.2285, p < 0.001), and alcohol consumption (CI = 0.0278, p < 0.001) were significantly more in the higher socioeconomic group, compared to the lower socioeconomic group. In contrast, the prevalence of tobacco use (CI = -0.2551, p < 0.001) was significantly more in the lower socioeconomic group, compared to the higher socioeconomic group. The test for differences in rural vs. urban concentration indices for high blood pressure, overweight/obesity, alcohol consumption, and tobacco use were statistically significant in all the health indicators (p < 0.05). Conclusion: An effective intervention should incorporate a high-risk approach to terminate risk distribution by directing resources to key population women. To improve the benefit to risk ratio and enhance the cost effectiveness of preventive health programmes, it is paramount to understand the worth of equity-based strategies. Integrating equity elements to interventions is a key measure toward ensuring that policies and programmes meet their milestones. Government should strengthen living standards, literacy and healthcare system to curtail the increasing prevalence of the risk factors of NCDs.
Keywords: Lorenz; concentration index; global health; high blood pressure; obesity; sub-Saharan Africa; tobacco; women's health.
Figures


References
-
- Lynch T. United Nations sustainable development goals: promoting health and well-being through physical education partnerships. Cogent Educ. (2016) 3:1188469 10.1080/2331186X.2016.1188469 - DOI
-
- Riley L, Gouda H, Cowan M, World Health Organization. Noncommunicable diseases progress monitor, 2017. (2017). Available online at: http://apps.who.int/iris/bitstream/10665/258940/1/9789241513029-eng.pdf (Accessed June 20, 2018).
-
- Khalequzzaman M, Chiang C, Choudhury SR, Yatsuya H, Al-Mamun MA, Al-Shoaibi AAA, et al. Prevalence of non-communicable disease risk factors among poor shantytown residents in Dhaka, Bangladesh: a community-based cross-sectional survey. BMJ Open (2017) 7:e014710. 10.1136/bmjopen-2016-014710 - DOI - PMC - PubMed
-
- Allen L, Williams J, Townsend N, Mikkelsen B, Roberts N, Foster C, et al. Socioeconomic status and non-communicable disease behavioural risk factors in low-income and lower-middle-income countries: a systematic review. Lancet Glob Health (2017) 5:e277–89. 10.1016/S2214-109X(17)30058-X - DOI - PMC - PubMed
LinkOut - more resources
Full Text Sources