. 2018 Oct 25;5(5):ENEURO.0088-18.2018.
doi: 10.1523/ENEURO.0088-18.2018. eCollection 2018 Sep-Oct.

Microglia Enhance Synapse Activity to Promote Local Network Synchronization

Affiliations

Microglia Enhance Synapse Activity to Promote Local Network Synchronization

Ryohei Akiyoshi et al. eNeuro. .

Abstract

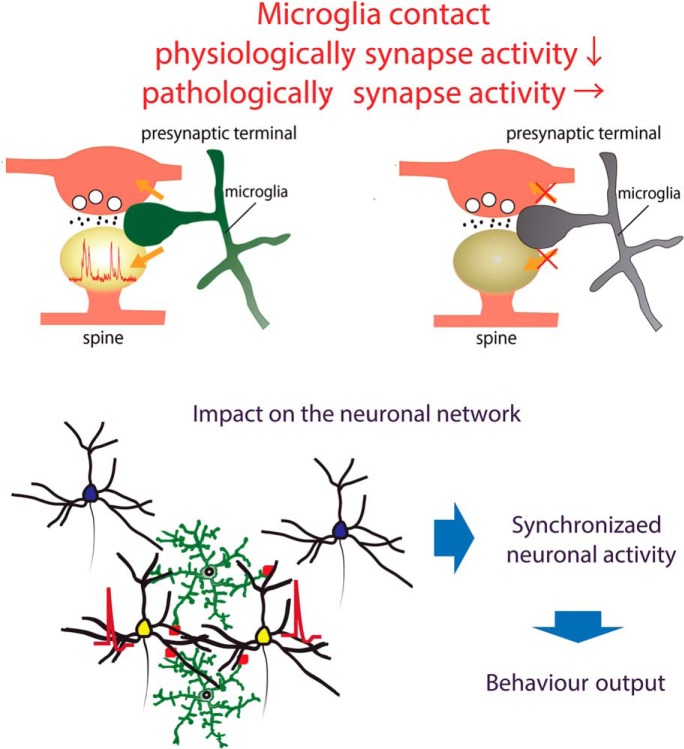
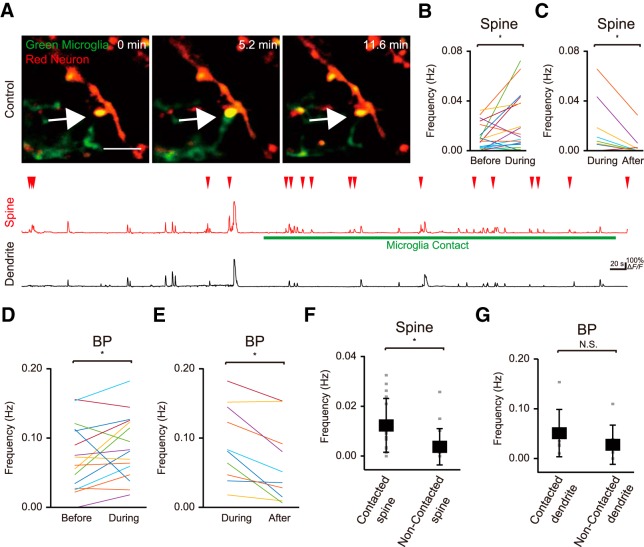
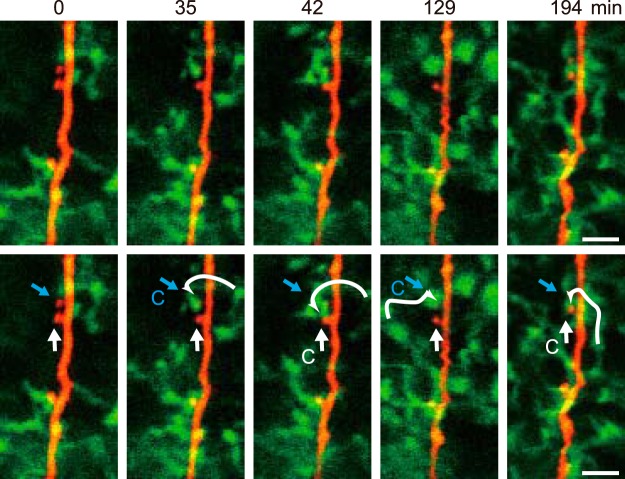
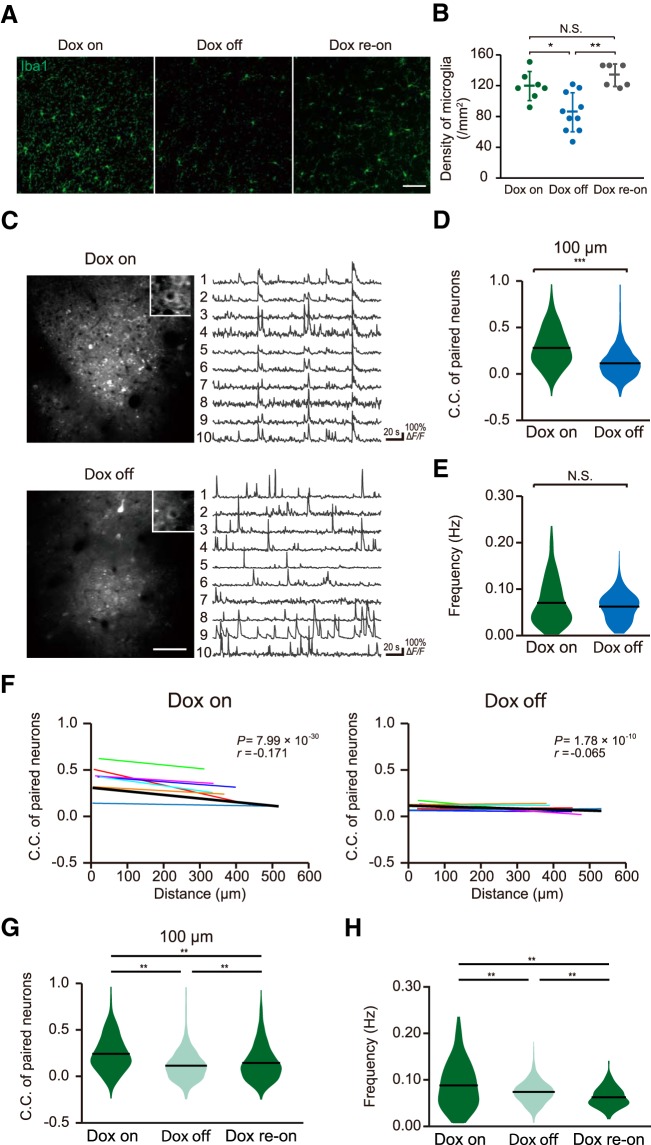
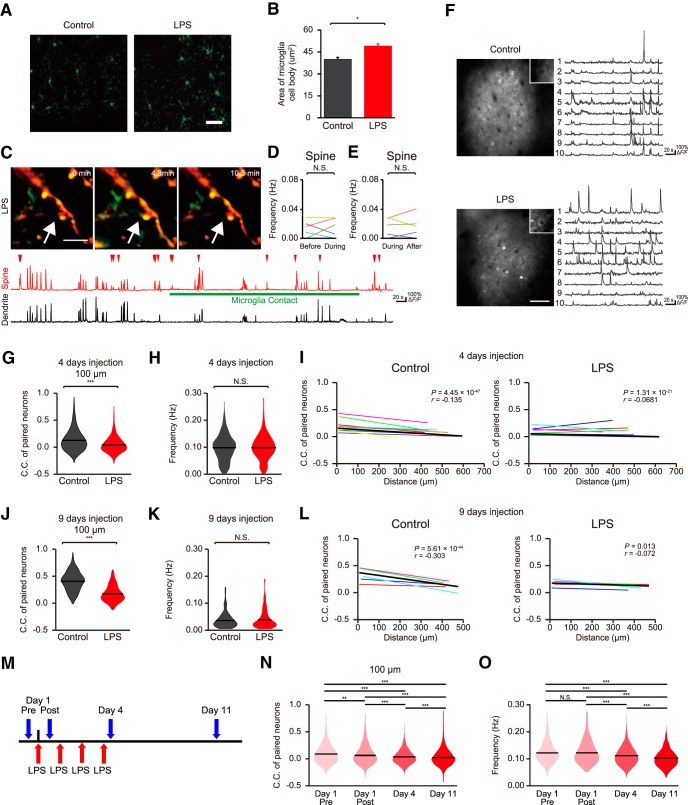
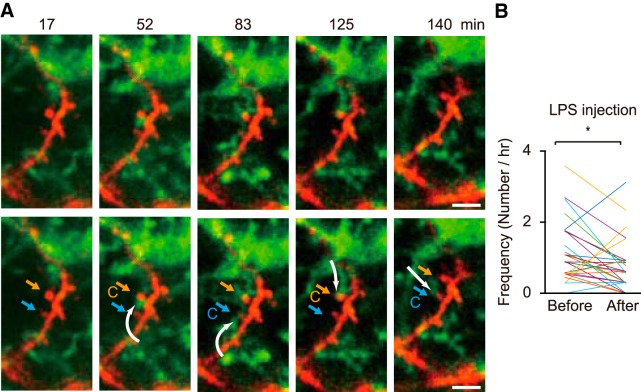
Microglia are highly motile immunoreactive cells that play integral roles in the response to brain infection and damage, and in the progression of various neurological diseases. During development, microglia also help sculpt neural circuits, via both promoting synapse formation and by targeting specific synapses for elimination and phagocytosis. Microglia are also active surveyors of neural circuits in the mature, healthy brain, although the functional consequences of such microglia-neuron contacts under these conditions is unclear. Using in vivo imaging of neurons and microglia in awake mice, we report here the functional consequences of microglia-synapse contacts. Direct contact between a microglial process and a single synapse results in a specific increase in the activity of that contacted synapse, and a corresponding increase in back-propagating action potentials along the parent dendrite. This increase in activity is not seen for microglia-synapse contacts when microglia are activated by chronic lipopolysaccharide (LPS) treatment. To probe how this microglia-synapse contact affects neural circuits, we imaged across larger populations of motor cortical neurons. When microglia were again activated by LPS (or partially ablated), there was a decrease in the extent to which neuronal activity was synchronized. Together, our results demonstrate that interactions between physiological or resting microglia and synapses in the mature, healthy brain leads to an increase in neuronal activity and thereby helps to synchronize local populations of neurons. Our novel findings provide a plausible physical basis for understanding how alterations in immune status may impact on neural circuit plasticity and on cognitive behaviors such as learning.

Keywords: calcium imaging; in vivo; microglia; synapse; two photon.


Figures

None
Graphical abstract
Figure 1.
Figure 1.
Enhanced synapse activity follows microglia contact. A, top, Fluorescent image of a dendrite in in L2/3 of the primary motor cortex showing the simultaneous imaging of spines and their parent dendrite (tdTomato; red) and microglia (EGFP, green). Scale bar: 5 μm. The image panels show microglial process contacting a spine (center). Lower traces, Activity in the neuronal compartments was measured with GCaMP6f and quantified as ΔF/F. Sample Ca2+ traces from a spine and its parent dendrite before, during, and after microglia contact are shown. Putative backpropagating action potentials cause synchronous responses in both dendrite and spine, whereas presumed local synaptic activity results in spine transients only. Note the enhanced local (spine) synaptic activity with microglial contact. The white arrow indicate the spine contacted by microglia process. B, C, The frequency of local spine Ca2+ transients were increased during microglia contact periods relative to those before (B) or after (C) contact [B: 0.020 ± 0.005 Hz (during) vs 0.010 ± 0.002 Hz (before), p = 0.033, n = 20 fields from 17 mice; C: 0.016 ± 0.007 Hz (during) vs 0.004 ± 0.003 Hz (after), p = 0.030, n = 10 fields from 10 mice, paired t test]. D, E, The frequency of back propagating action potentials reflected as dendritic Ca2+ transients was increased during the period of microglia-synapse contact, relative to that before (D) or after (E) contact [D: 0.089 ± 0.011 Hz (during) vs 0.074 ± 0.012 Hz (before), p = 0.044, n = 20 fields from 17 mice; E: 0.093 ± 0.017 Hz (during) vs 0.063 ± 0.017 Hz (after), p = 0.003, n = 10 fields from 10 mice, paired t test]. F, Microglia were attracted to synapses with a higher basal (pre-contact) frequency of local Ca2+ responses (spines with microglia contact: 0.012 ± 0.011 Hz; spines without microglia contact: 0.004 ± 0.007 Hz, p = 0.004, n = 16 fields from 15 mice, Wilcoxon rank sum test). G, In contrast, contact frequency did not depend on the basal frequency of back propagating action potentials (dendrites with microglia contact: 0.047 ± 0.048 Hz; dendrites without microglia contact: 0.028 ± 0.040 Hz, p = 0.32, n = 7 fields from seven mice, Wilcoxon rank sum test). Data are presented as the mean ± SEM; *p < 0.05.
Figure 2.
Figure 2.
Specific physiologic microglial processes contact different spines while a single spine may be contacted by different microglia. Representative long-term simultaneous images of microglia (green) and of dendrites and spines (red), showing examples of microglial-synapse contacts during over three consecutive hours. The upper and lower panels show the same images with the lower panels annotated by white and blue straight arrows to indicate two different spines, and with a curved white arrow to indicate the trajectory of for a single microglial process as it contacts a spine (contact indicated by C). The upper spine (blue arrow) is contacted by one microglia at 35–42 min, and by a seemingly different microglia at 129 min. At 42 and 194 min, the original microglia contacts the lower (white arrow) spine.
Figure 3.
Figure 3.
Decreased synchronization of evoked neural activity in microglia ablated mice. A, Fluorescent (immunohistochemistry) images of Iba1-positive microglia in cortical sections of Dox on (left), Dox off (center), and re-Dox on mice showing reduced density of Iba1 (microglia)-positive cells in Iba1-tTA::tetO-DTA transgenic mice following 7 d of Dox withdrawal as compared with Iba1-tTA::tetO-DTA transgenic mice with Dox maintained in the diet and in Dox-off mice after Dox had been returned to the diet for a week (Dox re-on). Scale bar in right panel: 50 μm. B, Genetic ablation of microglia was verified by quantification of microglia density. Dox-off mice showed a significant reduction in the density of microglia from 121.3 ± 18.7/mm2 (n = 7 fields from three Dox on mice) to 87.4 ± 25.1/mm2 (n = 10 fields from three Dox-off mice; p = 0.006, unpaired t test). The density of microglia recovered to control levels following one week of Dox return to the diet (135.0 ± 14.5/mm2, n = 6 fields from three Dox re-on mice; p = 0.0008, unpaired t test). C, left, Typical fields of view of L2/3 primary motor cortex neurons expressing GCaMP6f in Dox on mice (upper) and Dox off mice (lower). Right, Representative ΔF/F Ca2+ traces from individual GCaMP6f-positive neurons from Dox on (upper) and Dox off mice (lower). D, Synchronous neuronal firing was estimated by measuring the proportion of neuron pairs in which Ca2+ transients were seen at the same time, and quantifying this as a C.C. The mean C.C. of paired neurons within 100 μm of each other was lower in Dox off mice as compared with that in Dox on mice [Dox on mice (n = seven mice); 0.28 ± 0.006, Dox off mice (n = 7 mice); 0.12 ± 0.003, p = 1.75 × 10−171, Wilcoxon rank sum test]. E, There was no difference in the frequency of Ca2+ responses between Dox on and Dox off mice [Dox on (n = 269 neurons from seven mice); 0.071 ± 0.003 Hz, Dox off (n = 326 neurons from seven mice); 0.062 ± 0.002 Hz, p = 0.463, Wilcoxon rank sum test]. F, The C.C.s in each pair of neurons was negatively correlated with the distance separating each pair of neurons in control (Dox on) mice (left). However, this negative correlation was absent in Dox off mice (right). Individual slope correlations from each mouse are shown by the thin colored regression lines, while the thicker black line shows the correlation obtained by fitting all the data simultaneously. The value of the slope of this group correlation and the p value obtained from the Pearson’s correlation test are shown in the top right of each graph, while averaged slope values obtained from each mouse are shown in this legend (control mice: n = 7, r = –0.171, p = 7.99 × 10⁻³⁰; microglia ablated mice: n = 7, r = –0.065, p = 1.78 × 10⁻⁸, Pearson’s correlation test; for seven Dox on mice, r = –0.175 ± 0.045, p = 0.0082, one-sample t test; for seven Dox off mice, r = –0.048 ± 0.036, p = 0.227, one-sample t test). G, H, In an additional cohort of mice, the C.C.s of neurons located within 100 μm of each other (G) and the neuron firing frequencies (H) were measured during the doc on diet (left), following 7 d of Dox off diet (center) and again 42 d after returning to dox diet (dox re-on, right). Dox-off again reduced the C.C. which partially recovered after returning to dox [G: F(2,4926) = 200.21, p = 9.56 × 10⁻¹⁰ (Dox on: 0.243 ± 0.006 vs Dox off: 0.115 ± 0.003), p = 3.15 × 10⁻⁷ (Dox off: 0.115 ± 0.003 vs Dox re-on: 0.145 ± 0.005), p = 9.56 × 10⁻¹⁰ (Dox on: 0.243 ± 0.006 vs Dox re-on: 0.145 ± 0.005), one-way ANOVA followed by Tukey’s test]. The neuronal firing frequencies in this cohort were decreased after Dox off and decreased further after returning to dox on [H: Dox on (n = 165 neurons, four fields from two mice); 0.088 ± 0.004 Hz, Dox off (n = 229 neurons, four fields from two mice); 0.074 ± 0.001 Hz, Dox re-on (n = 211 neurons, four fields from two mice); 0.063 ± 0.001 Hz, F(2,602) = 29.19, p = 5.83 × 10⁻⁵ (Dox on vs Dox off), p = 5.15 × 10⁻⁴ (Dox off vs Dox re-on), p = 9.56 × 10⁻¹⁰ (Dox on vs Dox re-on), one-way ANOVA followed by Tukey’s test]. Data in panel B are presented as the mean ± SEM, while data in panels D, E, G, H show means and distributions of each data point; *p < 0.05, ***p < 0.001, n.s.: non-significant.
Figure 4.
Figure 4.
Microglia-synapse interactions in mice following LPS injections. A, B, Intraperitoneal injection of LPS activated microglia, as verified by morphologic appearance (A), which included a significant increase in soma diameter (B). Soma area increased from 40.1 ± 9.2 μm2 in saline-injected mice (n = 58 cells from three mice) to 49.2 ± 11 μm2 in LPS-injected mice (n = 80 cells from three mice, p = 4.30 × 10⁻⁷, unpaired t test). C, top, Fluorescent image of a dendrite in L2/3 of the primary motor cortex of an LPS-injected mice showing the simultaneous imaging of spines (tdTomato; red) and microglia (EGFP; green). Scale bar: 5 μm. As in Figure 1, the lower trace shows a sample recording of Ca2+ transients (GCaMP6f fluorescence ΔF/F) in a single spine (upper) and in the parent dendrite (lower) before, during, and after microglial contact. Local synaptic activity was not effected by microglial contact. The white arrow indicate the spine contacted by microglia process. D, E, The frequency of Ca2+ transients in spines during the period of microglial contact was not significantly different from that either before (D) or after (E) contact. Each line shows data from a single experiment [D: 0.013 ± 0.003 Hz (during) vs 0.012 ± 0.003 Hz (before), p = 0.816, n = 6 fields from three mice; E: 0.013 ± 0.004 Hz (during) vs 0.014 ± 0.005 Hz (after), p = 0.843, n = 6 fields from three mice, paired t test]. F, Typical fields of view of neurons with GCaMP6f fluorescence in L2/3 of the primary motor cortex of saline-injected mice (upper) and LPS-injected mice (lower), with accompanying representative ΔF/F Ca2+ traces from ten individual neurons in each mouse. G–L, Distribution of C.C.s (G, J) and of neuronal firing frequencies (H, K) in mice injected with either saline or LPS for 4 d (G, H) or 9 d (J, K). LPS injections decreased the C.C. for pairs of closely located neurons but had no effect on neuronal firing frequencies. Panels I, L show the relationship between C.C. and neuronal separation for mice injected with either saline or LPS for 4 d (I) or 9 d (L). Each line shows the slope of the correlation from individual mice, while the values in the top right corner show the slope of the fits to the complete data set (and the value of the Pearson’s correlation test), the fit to this grouped data are shown as the solid dark line. Averaging the individual fits gives a mean slope correlation of: r = –0.149 ± 0.019 for 4 d saline mice (p = 5.43 × 10⁻⁵, one-sample t test, n = 9 mice), r = –0.008 ± 0.039 for 4 d LPS mice (p = 0.850, n = 9 mice), r = –0.285 ± 0.065, for 9 d saline (p = 0.012, n = 5 mice), and r = –0.107 ± 0.048 for 9 d LPS [p = 0.091, n = 5 mice; G: saline-injected mice (4 d injection, n = 9 mice); 0.12 ± 0.004, LPS-injected mice (4 d injection, n = 9 mice); 0.043 ± 0.002, p = 7.02 × 10−72, Wilcoxon rank sum test; H: control (4 d injection, n = 464 neurons from nine mice); 0.098 ± 0.002 Hz, LPS (4 d injection, n = 568 neurons from nine mice); 0.098 ± 0.002 Hz, p = 0.841, Wilcoxon rank sum test; I; control (4 d injection); r = –0.135, p = 4.45 × 10−47, LPS (4 d injection); r = –0.0681, p = 1.31 × 10⁻²¹, Pearson’s correlation test; J; saline-injected mice (9 d injection, n = 5 mice); 0.34 ± 0.008, LPS-injected mice (9 d injection, n = 5 mice); 0.18 ± 0.009, p = 3.61 × 10⁻³⁰, Wilcoxon rank sum test; K; saline-injected mice (9 d injection, n = 141 neurons from five mice); 0.033 ± 0.002 Hz, LPS-injected mice (9 d injection, n = 108 neurons from five mice); 0.037 ± 0.003 Hz, p = 0.60, Wilcoxon rank sum test; L; control (9 d injection); r = –0.303, p = 5.61 × 10−44, LPS (9 d injection); r = –0.072, p = 0.013, Pearson’s correlation test]. Hence LPS injection abolished the correlation between C.C. and neuronal separation. M–O, In an additional cohort of mice, L2/3 neurons were imaged before LPS< and again 1 and 4 d after daily LPS injections, and then after 7 d of recovery from the last LPS injection (M). The distributions of the C.C. (N) and the neuronal firing frequencies (O) over these time periods are shown. LPS injection caused a significant decrease in C.C., which was evident by the first day of injection and did not recover following a week after the last LPS injection. (N). From 4 d after LPS, the firing frequency in this mouse cohort decreased, and there was a further decrease by one week after the last LPS injection [O; N: F(3,19984) = 189.29, p = 0.002 (day 1 pre; 0.089 ± 0.004 vs day 1 post; 0.074 ± 0.003), p = 3.77 × 10⁻⁹ (day 1 pre; 0.089 ± 0.004 vs day 4; 0.035 ± 0.002), p = 3.77 × 10⁻⁹ (day 1 pre; 0.089 ± 0.004 vs day 11; 0.023 ± 0.001), p = 3.77 × 10⁻⁹ (day 1 post; 0.074 ± 0.003 vs day 4; 0.035 ± 0.002), p = 3.77 × 10⁻⁹ (day 1 post; 0.074 ± 0.003 vs day 11; 0.023 ± 0.001), p = 1.93 × 10⁻⁹ (day 4; 0.035 ± 0.002 vs day 11; 0.023 ± 0.001), one-way ANOVA followed by Tukey’s test; O: day 1 pre (n = 320 neurons, seven fields from four mice); 0.122 ± 0.002 Hz, day 1 post (n = 325 neurons, seven fields from four mice); 0.122 ± 0.002 Hz, day 4 (n = 449 neurons, seven fields from four mice); 0.112 ± 0.002 Hz, day 11 (n = 737 neurons, seven fields from four mice); 0.102 ± 0.001 Hz, F(3,1827) = 37.13, p = 1.00 (day 1 pre vs day 1 post), p = 2.43 × 10⁻⁴ (day 1 pre vs day 4), p = 3.77 × 10⁻⁹ (day 1 pre vs day 11), p = 1.54 × 10⁻⁴ (day 1 post vs day 4), p = 3.77 × 10⁻⁹ (day 1 post vs day 11), p = 5.09 × 10⁻⁵ (day 4 post vs day 11), one-way ANOVA followed by Tukey’s test]. Data in B shows the mean ± SEM, the dark lines in panels G, H, J, K, N, O represent the means; *p < 0.05, **p < 0.01, ***p < 0.001, n.s.: non-significant.
Figure 5.
Figure 5.
Specific activated microglial processes contact different spines, while a single spine may be contacted by different activated microglia. A, As in Figure 2 for physiologic microglia, the processes of the same specific activated microglia contact two different spines (orange arrow spine at 52 min, blue arrow spine at 83 min). The same two spines are later contacted by processes originating from a different microglia. B, The mean frequency of contacts between microglial processes and spines in mice with an acute injection of LPS. LPS decreases the contact frequency from 1.17 ± 0.16/h under control to 0.76 ± 0.13/h after LPS injection (n = 31 spines from four mice, p = 0.0132, paired t test). *p < 0.05.

References

    1. Chen Z, Jalabi W, Hu W, Park HJ, Gale JT, Kidd GJ, Bernatowicz R, Gossman ZC, Chen JT, Dutta R, Trapp BD (2014) Microglial displacement of inhibitory synapses provides neuroprotection in the adult brain. Nat Commun 5:4486. 10.1038/ncomms5486 - DOI - PMC - PubMed
    1. Cunningham C (2013) Microglia and neurodegeneration: the role of systemic inflammation. Glia 61:71–90. 10.1002/glia.22350 - DOI - PubMed
    1. Dissing-Olesen L, LeDue JM, Rungta RL, Hefendehl JK, Choi HB, MacVicar BA (2014) Activation of neuronal NMDA receptors triggers transient ATP-mediated microglial process outgrowth. J Neurosci 34:10511–10527. 10.1523/JNEUROSCI.0405-14.2014 - DOI - PMC - PubMed
    1. Dombeck DA, Khabbaz AN, Collman F, Adelman TL, Tank DW (2007) Imaging large-scale neural activity with cellular resolution in awake, mobile mice. Neuron 56:43–57. 10.1016/j.neuron.2007.08.003 - DOI - PMC - PubMed
    1. Dombeck DA, Graziano MS, Tank DW (2009) Functional clustering of neurons in motor cortex determined by cellular resolution imaging in awake behaving mice. J Neurosci 29:13751–13760. 10.1523/JNEUROSCI.2985-09.2009 - DOI - PMC - PubMed