. 2018 Feb;2(2):117-125.
doi: 10.1038/s41562-017-0279-y. Epub 2018 Jan 29.

The Causal Effects of Education on Health Outcomes in the UK Biobank

Affiliations

The Causal Effects of Education on Health Outcomes in the UK Biobank

Neil M Davies et al. Nat Hum Behav. 2018 Feb.
No abstract available

Keywords: ROSLA; education; genomic confounding; instrumental variable analysis.


Conflict of interest statement

Conflicts of interest We report no conflicts of interest.

Figures

Figure 1
Figure 1
Years of full-time education by quarter of birth. Each dot represents the proportion who left education before the given age per quarter. The black line indicates the first cohort of participants who were affected by the reform implemented in September 1972. These participants were born after in or after September 1957 and faced a minimum school leaving age of 16. This is a one year increase compared to those born before September 1957. The participants who did not have a university degree were asked, “What age did you leave full-time education?” People who were born in the summer (July-August) were still able to leave school at age 15. N=384,743.
Figure 2
Figure 2
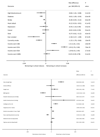
The effect of the reform on each outcome estimated via difference in differences. The units in the top panel are reported on the absolute risk difference scale (risk differences per 100 people). This is interpreted as the change in the number of events per 100 people affected by the reform. The units for the bottom panel differ by outcome and are listed in the legend on left hand side. All estimates control for gender and month of birth. Estimates are the difference between the year-on-year difference in outcome across the raising of the school leaving age compared to the average year on year difference. Estimated using robust linear regression, with standard errors clustered by month of birth and weighting. Differences and confidence intervals calculated using Bland-Altman tests. The estimates for diabetes, stroke, mortality, former and current smoking, income over £18k, and £31k, grip strength, BMI, intelligence, alcohol consumption and sedentary behavior exceed Benjamini and Hochberg (1995) threshold for multiple hypothesis testing. Max N=262,348.
Figure 3
Figure 3
The effect of the 1972 reform on mortality, smoking, ever smoking and alcohol consumption from the Office of National Statistics Census (summary data from the entire English and Welsh population) and the General Health Survey for England (min N=47,177) () (Clark and Royer, 2013) and () the UK Biobank. All estimates adjust for the month of birth, sex, and a linear time trend which can differ before and after the reform. Estimated using robust linear regression, with standard errors clustered by month of birth and weighting. Current and ever smoking and alcohol consumption additionally adjust for age cubed. Inverse probability weights were used to correct for under-sampling of participants who left school at age 15 (weight=1.8857). The bandwidths are 74, 72, 74, and 138 months for mortality, current smoking, ever smoking, and drink alcohol respectively. In this analysis alcohol consumption is coded as a binary variable equal to one if the participant states they ever drink (93.3%), in the main results alcohol is coded as an ordinal variable. Mortality results are log odds of death. The Clark and Royer mortality results relate to the risk of mortality in the five years between the ages of 40 to 44, whereas UK Biobank participants were between the ages of 42 and 62 and follow-up spanned 7.78 years (over the period 10th May 2006 and 17th February 2014).

References

    1. Lager ACJ, Torssander J. Causal effect of education on mortality in a quasi-experiment on 1.2 million Swedes. Proc Natl Acad Sci. 2012;109:8461–8466. - PMC - PubMed
    1. Clark D, Royer H. The Effect of Education on Adult Mortality and Health: Evidence from Britain. Am Econ Rev. 2013;103:2087–2120. - PubMed
    1. Cutler D, Lleras-Muney A. Education and Health: Evaluating Theories and Evidence. National Bureau of Economic Research; 2006.
    1. Dickson M. The Causal Effect of Education on Wages Revisited*. The causal effect of education Oxf Bull Econ Stat. 2013;75:477–498.
    1. Fry A, et al. Comparison of Sociodemographic and Health-Related Characteristics of UK Biobank Participants With Those of the General Population. Am J Epidemiol. 2017;186:1026–1034. - PMC - PubMed