Review
. 2018 Nov 7;18(12):105.
doi: 10.1007/s11910-018-0912-9.

A Precision Medicine Approach to Cerebral Edema and Intracranial Hypertension after Severe Traumatic Brain Injury: Quo Vadis?

Affiliations
Review

A Precision Medicine Approach to Cerebral Edema and Intracranial Hypertension after Severe Traumatic Brain Injury: Quo Vadis?

Ruchira M Jha et al. Curr Neurol Neurosci Rep. .

Abstract

Purpose of review: Standard clinical protocols for treating cerebral edema and intracranial hypertension after severe TBI have remained remarkably similar over decades. Cerebral edema and intracranial hypertension are treated interchangeably when in fact intracranial pressure (ICP) is a proxy for cerebral edema but also other processes such as extent of mass lesions, hydrocephalus, or cerebral blood volume. A complex interplay of multiple molecular mechanisms results in cerebral edema after severe TBI, and these are not measured or targeted by current clinically available tools. Addressing these underpinnings may be key to preventing or treating cerebral edema and improving outcome after severe TBI.

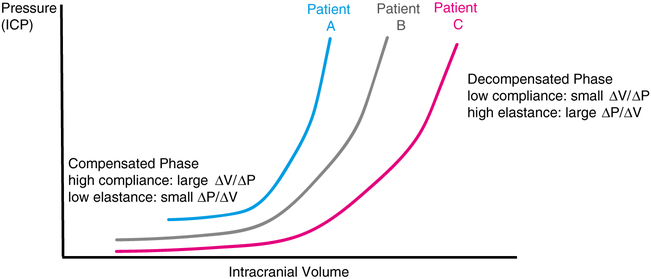
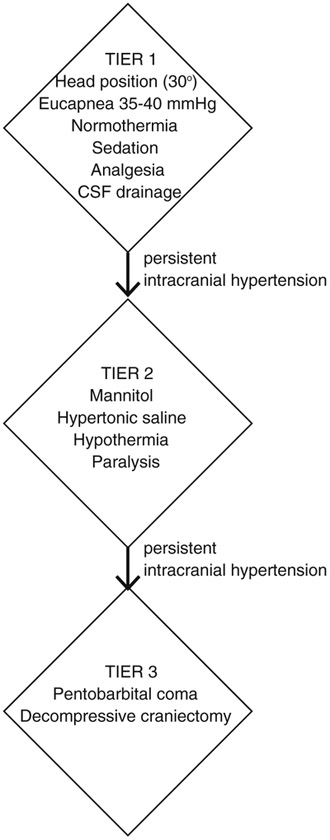
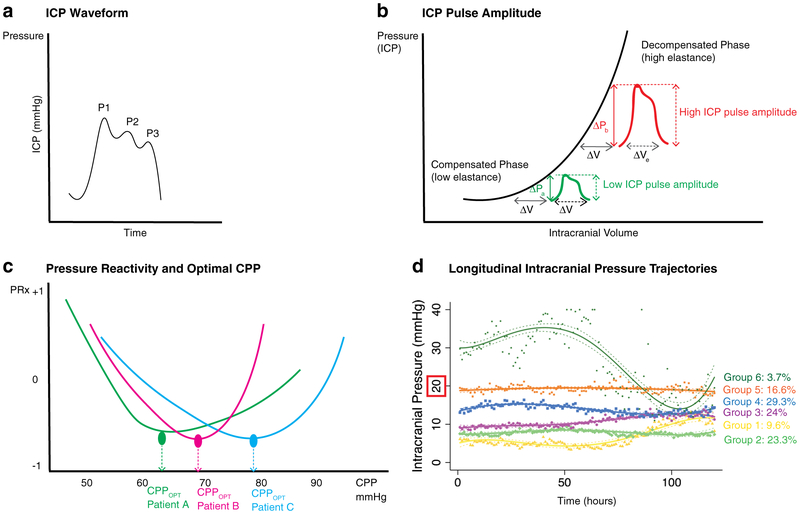
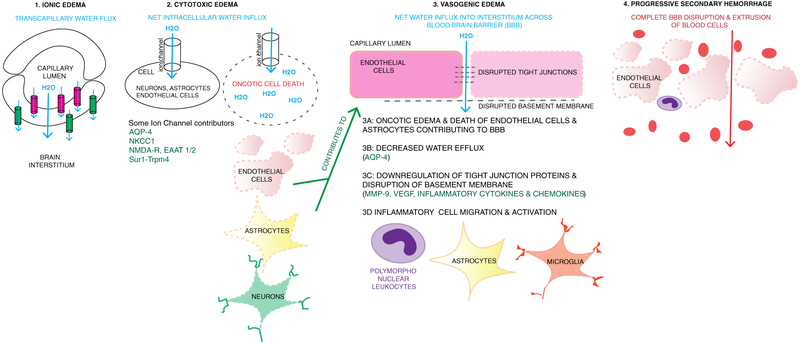
Recent findings: This review begins by outlining basic principles underlying the relationship between edema and ICP including the Monro-Kellie doctrine and concepts of intracranial compliance/elastance. There is a subsequent brief discussion of current guidelines for ICP monitoring/management. We then focus most of the review on an evolving precision medicine approach towards cerebral edema and intracranial hypertension after TBI. Personalization of invasive neuromonitoring parameters including ICP waveform analysis, pulse amplitude, pressure reactivity, and longitudinal trajectories are presented. This is followed by a discussion of cerebral edema subtypes (continuum of ionic/cytotoxic/vasogenic edema and progressive secondary hemorrhage). Mechanisms of potential molecular contributors to cerebral edema after TBI are reviewed. For each target, we present findings from preclinical models, and evaluate their clinical utility as biomarkers and therapeutic targets for cerebral edema reduction. This selection represents promising candidates with evidence from different research groups, overlap/inter-relatedness with other pathways, and clinical/translational potential. We outline an evolving precision medicine and translational approach towards cerebral edema and intracranial hypertension after severe TBI.

Keywords: Biomarkers; Cerebral edema; Intracranial hypertension; Severe traumatic brain injury; Therapeutic target.


Conflict of interest statement

Conflict of Interest Ruchira M. Jha reports grants from NIH/NINDS 1K23NS101036, grants from Dean’s Faculty Advancement Award, personal fees from Biogen, during the conduct of the study. Dr. Kochanek is supported by W81XWH-17-C-0064 from the U.S. Department of Defense

Figures

Fig. 1
Fig. 1
Intracranial pressure volume relationships. Classic curve demonstrating how intracranial pressure (ICP) is related to intracranial volume. In the compensated phase with low elastance, increase in intracranial volume does not significantly increase ICP. However, in the decompensated phase with high elastance, a small increase in intracranial volume exponentially increases ICP. Each patient has an individual pressure volume curve based on their respective baseline tissue properties and disease pathophysiology—schematic examples are provided in red (patient C), gray (patient B), and blue (patient A). At any given point, a patient may be located anywhere along the curve and these points may vary based on time as well as different brain regions
Fig. 2
Fig. 2
Example of tiered approach to intracranial hypertension. This schematic is one example of a potential graded approach to ICP management. The exact details may differ based on institutional/ individual practice. In general, tier 1 therapy involves less aggressive measures such as head positioning, eucapnia, normothermia, adequate sedation/analgesia, and CSF drainage. If intracranial hypertension persists (currently defined by the Brain Trauma Foundation as > 22 mmHg) despite these therapies, tier 2 reflect an escalation in care such as hyperosmolar therapy, hypothermia, or paralysis. Tier 3 strategies are utilized when there is refractory intracranial hypertension to tier 2 strategies. This typically indicates barbiturate coma or decompressive craniectomy
Fig. 3
Fig. 3
Intracranial pressure waveforms, reactivity, and trajectories. 3A Basic ICP waveform comprising three peaks: P1 = percussion wave, P2 = tidal wave, P3 = dicrotic wave. 3B ICP pulse amplitude (ICPPLSE) demonstrated on a standard ICP-volume curve. In the compensated phase (low elastance), a small change in volume (e.g., with every cardiac cycle, ΔV in green), there is a small increase in ICP (ΔP in green), i.e., a low ICPPLSE. However, in the uncompensated phase/with high elastance, a small change in volume (ΔV in red) causes a large increase in ICP (ΔP in red), i.e., a large ICPPLSE. Modified from Jha et al., Meyers: Encyclopedia of Molecular Cell Biology and Molecular Medicine, In Press. 3C Graph of pressure reactivity index (PRx) on the Y axis with cerebral perfusion pressure (CPP) on the X axis. Curves are shown for three different patients: Patient A (green), patient B (red), and patient C (blue). The lowest (most negative) PRx is indicative of maximal pressure reactivity, thus identifying optimal CPP (CPPOPT). As evident from the three different patient curves, this value of CPPOPT is different for each individual. Modified from Jha et al., Meyers: Encyclopedia of Molecular Cell Biology and Molecular Medicine, In Press. 3D Graph of longitudinal intracranial pressure (ICP) trajectories over time in a cohort of severe TBI patients demonstrating six distinct trajectory groups. Trajectory groups are indicated in different colors with solid lines, and 95% confidence intervals in dashed lines. Individual measurements for each groups are shown in scatter points, color coordinate. Groups 1 (yellow) and 2 (green) have consistently low ICP with no/minimal spikes > 20 mmHg. Groups 3 (purple) and 4 (blue) have more frequent ICP spikes but no persistent intracranial hypertension. Group 5 (orange) has nearly continuous intracranial hypertension around 20 mmHg. Group 6 (dark green) has severe and rapid intracranial hypertension well above 20 mmHg. Modified from Jha et al., Crit Care Med, In Press
Fig. 4
Fig. 4
Continuum of ionic, cytotoxic and vasogenic edema, and progressive secondary hemorrhage. 1 Ionic edema involves transcapillary flux of ions and water across the capillary membrane. One hypothesis is that this is driven by osmotic forces. Ion channels expressed luminally (pink, such as NKCC1, Sur1-Trpm4) result in water movement into the endothelial cell, and then abluminal channels and transporters (green, e.g., Na+/K+ ATPase, Sur1-Trpm4) continue water movement across the cell into the interstitial space. The net movement of water (blue arrow) is from the capillary, across the endothelial cell, into the interstitial space. 2 Cytotoxic edema involves movement of water into cells including neurons, astrocytes, and endothelial cells. This occurs via various channels as listed including Sur1-Trpm4, NKCC1, EAAT1/2 and NMDA-R (glutamate channels), and AQP4. Intracellular influx of Na+ and water results in oncotic edema and cell death. When this occurs in endothelial cells and astrocytes containing podocytes that contribute to blood-brain barrier (BBB) integrity, it contributes to disruption of the BBB and vasogenic edema. 3 Vasogenic edema involves water and proteinaceous fluid movement across a disrupted BBB. Multiple mechanisms contribute to vasogenic edema including oncotic edema of endothelial cells and astrocytes (3A, 2), decreased water efflux via AQP4 (3B), downregulation and disruption of tight junction proteins and the basement membrane (3C) and recruitment and activation of inflammatory cells such as peripheral leukocytes, astrocytes, and microglia (3D.) Disruption and downregulation of tight junctions and basement membrane proteins involves many pathways including MMP- 9, VEGF, and inflammatory cytokines and chemokines. These are also involved in recruitment and activation of inflammatory cells. 4 Progressive secondary hemorrhage when mechanisms of cellular and vasogenic edema result in complete disruption of the BBB and extravasation of blood cells and products into the interstitium

References

    1. Stocchetti N, Carbonara M, Citerio G, Ercole A, Skrifvars MB, Smielewski P, et al. Severe traumatic brain injury: targeted management in the intensive care unit. Lancet Neurol. 2017;16:452–64

      Current review on management of severe TBI in the intensive care unit.

    1. Stocchetti N, Maas AIR. Traumatic intracranial hypertension. N Engl J Med. 2014;370:2121–30. - PubMed
    1. Winkler EA, Minter D, Yue JK, Manley GT. Cerebral edema in traumatic brain injury: pathophysiology and prospective therapeutic targets. Neurosurg Clin N Am. 2016;27:473–88. - PubMed
    1. Katayama Y, Mori T, Maeda T, Kawamata T. Pathogenesis of the mass effect of cerebral contusions: rapid increase in osmolality within the contusion necrosis. Acta Neurochir Suppl. 1998;71: 289–92. - PubMed
    1. Katayama Y, Kawamata T. Edema fluid accumulation within necrotic brain tissue as a cause of the mass effect of cerebral contusion in head trauma patients. Acta Neurochir Suppl (Wien). 2003;86:323–7. - PubMed

MeSH terms