. 2018 Oct;32(10):1117-1138.
doi: 10.1007/s10822-018-0168-0. Epub 2018 Nov 7.

pKa measurements for the SAMPL6 prediction challenge for a set of kinase inhibitor-like fragments

Affiliations

pKa measurements for the SAMPL6 prediction challenge for a set of kinase inhibitor-like fragments

Mehtap Işık et al. J Comput Aided Mol Des. 2018 Oct.

Abstract

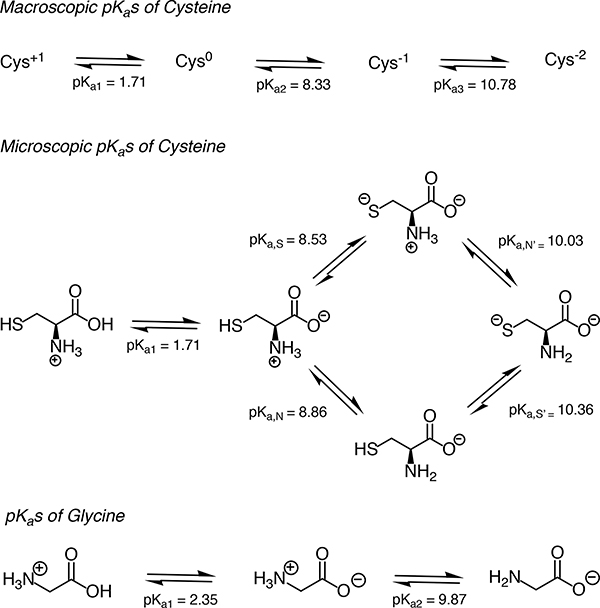
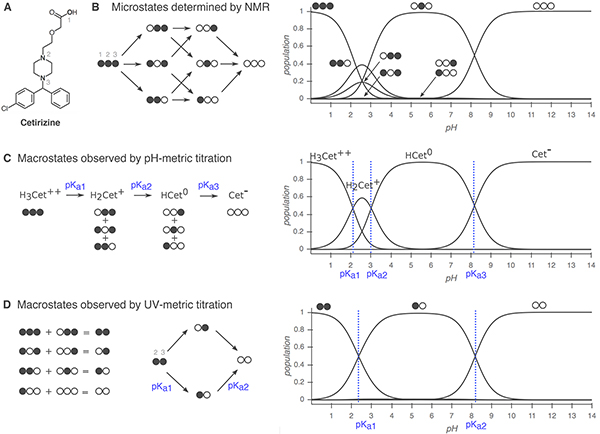
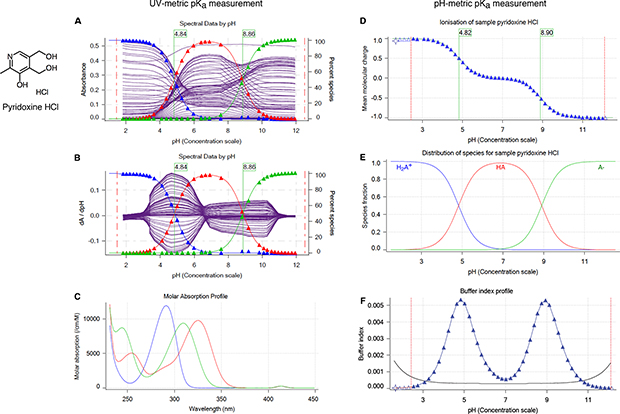
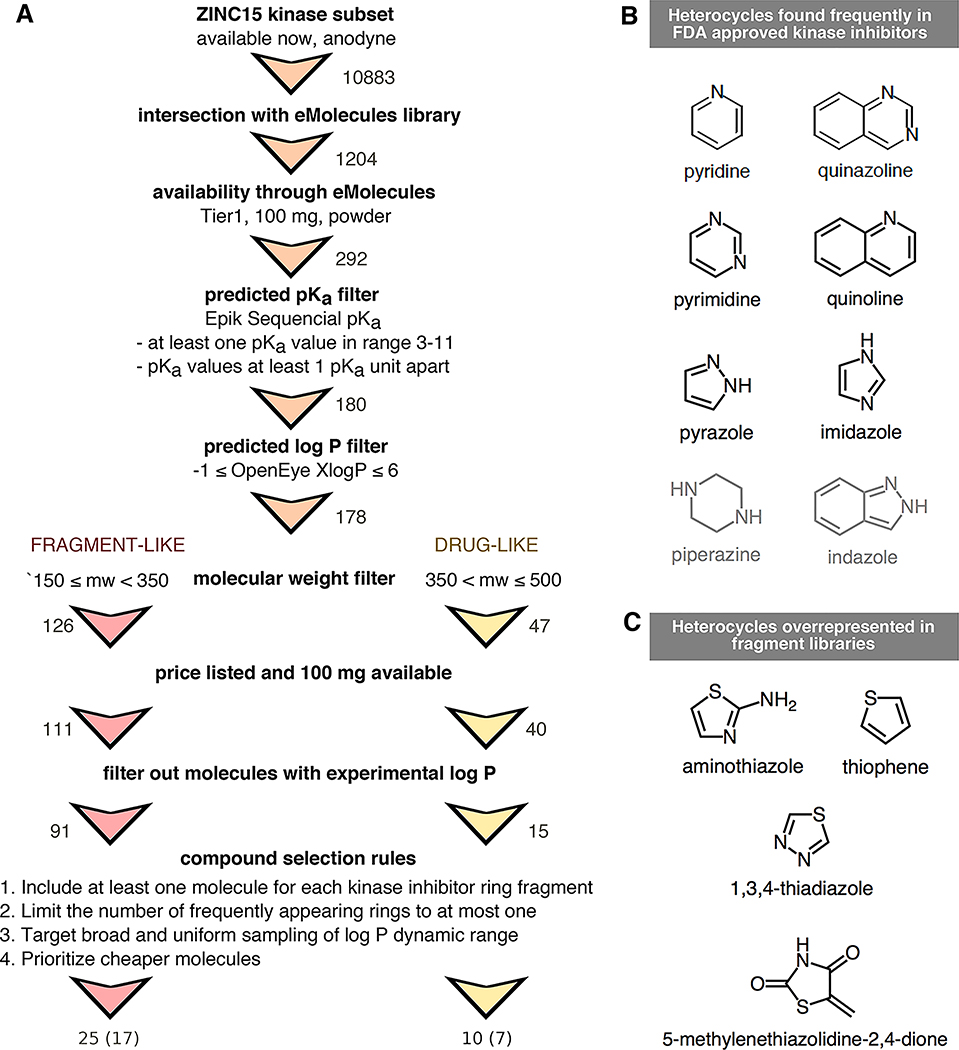
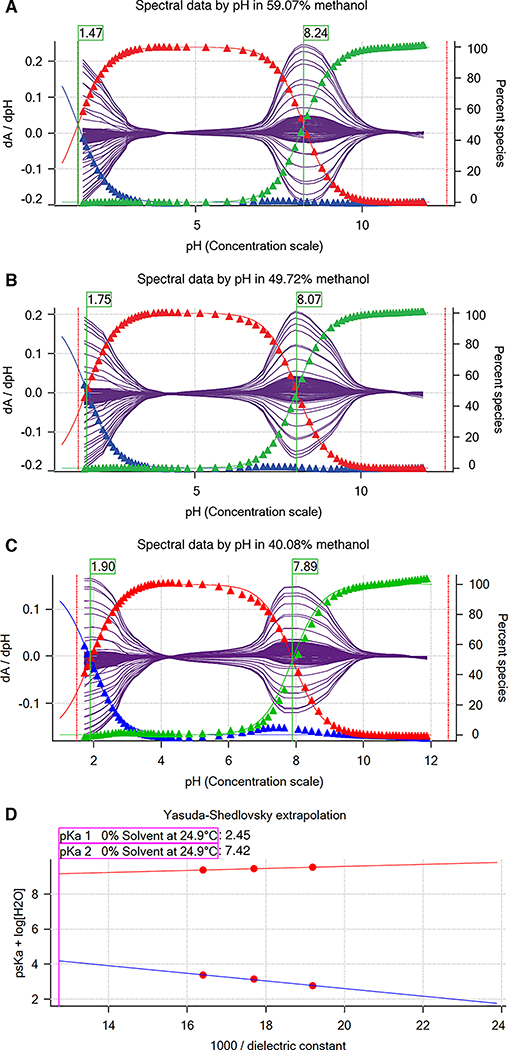
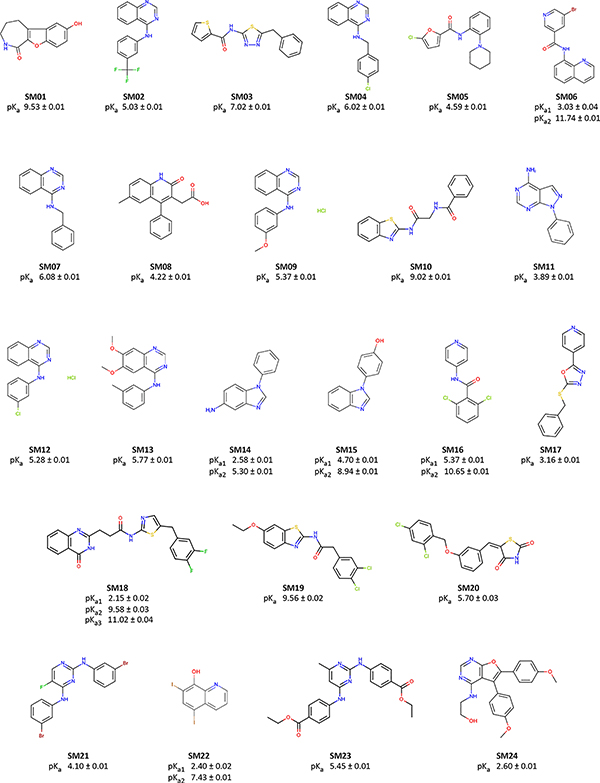
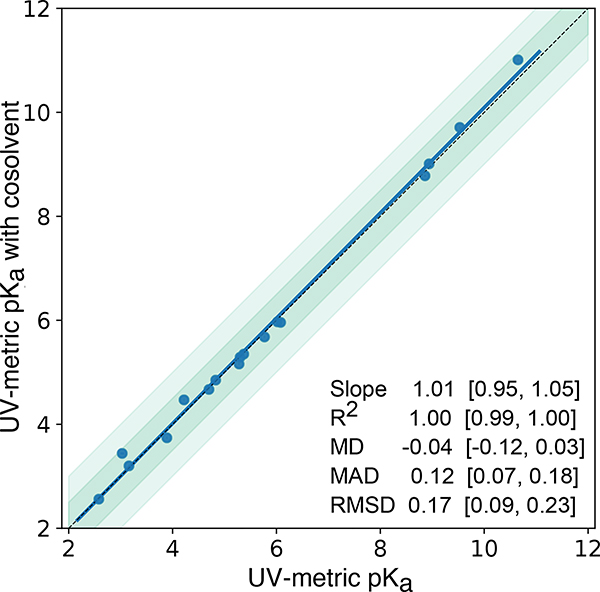
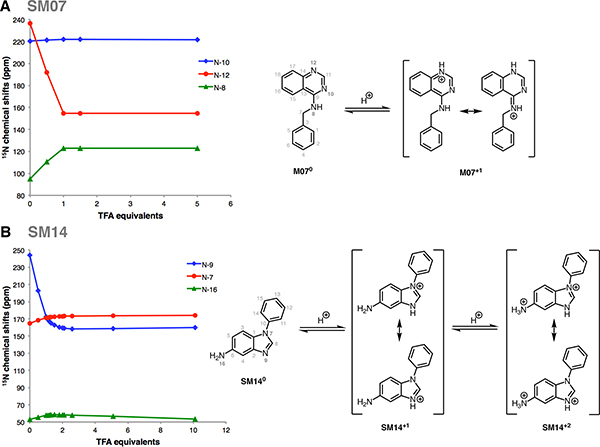
Determining the net charge and protonation states populated by a small molecule in an environment of interest or the cost of altering those protonation states upon transfer to another environment is a prerequisite for predicting its physicochemical and pharmaceutical properties. The environment of interest can be aqueous, an organic solvent, a protein binding site, or a lipid bilayer. Predicting the protonation state of a small molecule is essential to predicting its interactions with biological macromolecules using computational models. Incorrectly modeling the dominant protonation state, shifts in dominant protonation state, or the population of significant mixtures of protonation states can lead to large modeling errors that degrade the accuracy of physical modeling. Low accuracy hinders the use of physical modeling approaches for molecular design. For small molecules, the acid dissociation constant (pKa) is the primary quantity needed to determine the ionic states populated by a molecule in an aqueous solution at a given pH. As a part of SAMPL6 community challenge, we organized a blind pKa prediction component to assess the accuracy with which contemporary pKa prediction methods can predict this quantity, with the ultimate aim of assessing the expected impact on modeling errors this would induce. While a multitude of approaches for predicting pKa values currently exist, predicting the pKas of drug-like molecules can be difficult due to challenging properties such as multiple titratable sites, heterocycles, and tautomerization. For this challenge, we focused on set of 24 small molecules selected to resemble selective kinase inhibitors-an important class of therapeutics replete with titratable moieties. Using a Sirius T3 instrument that performs automated acid-base titrations, we used UV absorbance-based pKa measurements to construct a high-quality experimental reference dataset of macroscopic pKas for the evaluation of computational pKa prediction methodologies that was utilized in the SAMPL6 pKa challenge. For several compounds in which the microscopic protonation states associated with macroscopic pKas were ambiguous, we performed follow-up NMR experiments to disambiguate the microstates involved in the transition. This dataset provides a useful standard benchmark dataset for the evaluation of pKa prediction methodologies on kinase inhibitor-like compounds.

Keywords: Acid dissociation constants; Blind prediction challenge; Macroscopic pK a; Macroscopic protonation state; Microscopic pK a; Microscopic protonation state; SAMPL; Spectrophotometric pK a measurement.


Figures

Figure 1.
Figure 1.. Assignment of cysteine and glycine pKa values.
pKa1, pKa2, and pKa3 are macroscopic acid dissociation constants for cysteine and glycine [24]. When pKa values of a polyprotic molecule are very different, such as in the case of glycine, it is possible to assign the pKas to individual groups since the dissociation of protons is stepwise [19]. However, stepwise dissociation cannot be assumed for cysteine, because pKa2 and pKa3 are very close in value. Four underlying microscopic pKas (pKa,S, pKa,N, pKa,S′, and pKa,N′,) for cysteine were measured using UV spectra analysis of cysteine and derivatives [25]. Notice that the proximity of pKa,S and pKa,N values indicates similar probability of proton dissociation from these groups. This figure is adopted from [19].
Figure 2.
Figure 2.. Comparison of macroscopic and microscopic pKa measurement methods.
Filled circles represent protonated sites and empty circles represent deprotonated sites with the order of carboxylic acid (1), piperazine nitrogen (2), and piperazine nitrogen (3). Protonation state populations shown for pH-metric and UV-metric pKa measurement methods are simulations, calculated using NMR-based microscopic pKa values. (A) Cetirizine has n =3 titratable sites, shown in bold. (B) Left: The 8 microstates (2n) and 12 microscopic pKas (n2n−1) of cetirizine. Right: Relative population of microspecies with respect to pH. Potentially all microstates can be resolved via NMR. (C) Simulated pH-metric (potentiometric) titration and macroscopic populations. For a polyprotic molecule, only macroscopic pKas can be measured with pH-metric titration. Microstates with different total charge (related to the number of protons) can be resolved, but microstates with the same total charge are observed as one macroscopic population. (D) Simulated microscopic populations for UV-metric (spectrophotometric) titration of cetirizine. Since only protonation of the titration sites within four heavy atoms of the UV-chromophore is likely to cause an observable change in the UV-absorbance spectra, microstates that only differ by protonation of the distal carboxylic acid cannot be differentiated. Moreover, populations that overlap may or may not be resolvable depending on how much their absorbance spectra in the UV region differ. Both UV-metric and pH-metric pKa determination methods measure macroscopic pKas for polyprotic molecules, which cannot easily be assigned to individual titration sites and underlying microstate populations in the absence of other experimental evidence that provides structural resolution, such as NMR. Note that macroscopic populations observed in these two methods are composed of different combinations of microstates depending on the principles of measurement technique. Here, the illustrative diagram style was adopted from [26], and NMR-determined microscopic pKas for cetirizine were taken from [27].
Figure 3.
Figure 3.. UV-metric (spectrophotometric) and pH-metric (potentiometric) pKa measurements of pyridoxine HCl with Sirius T3.
Spectrophotometic pKa measurement (panels A, B, C) relies on differences in the UV absorbance spectra between microscopic protonation states to deconvolute the population of macrostate species as a function of pH. While highly sensitive (and therefore requiring a very low analyte concentration of ~ 50 μΜ), this approach can only resolve changes in protonation states for titratable sites near chromophores and cannot separate the populations of microstates that change in the same manner as a function of pH. (A) Multiwavelength UV absorbance vs pH. Purple lines represents absorbance at distinct wavelengths in UV region. (B) Derivative of multiwavelength absorbance with respect to pH (dA/dpH) vs pH is plotted with purple lines. In A and B, blue, red, and green triangles represent population of protonation states (from most protonated to least protonated) as calculated from a global fit to experimental UV absorbances for all pH values, while thin lines denote model fits that utilize the fitted model pKas to compute populations. pKa values (green flags) correspond to inflection point of multiwavelength absorbance data where change in absorbance with respect to pH is maximum. (C) Molar absorption coefficients vs wavelength for each protonation state as resolved by TFA. D, E, F illustrate potentiometric pKa measurement where molar addition of acid or base is tracked as pH is titrated. (D) Mean molecular charge vs pH. Mean molecular charge is calculated based on the model provided for the analyte: predicted number and nature of titratable sites (acid or base type), and number of counter ions present. pKa values are calculated as inflection points of charge vs pH plot. (E) Predicted macroscopic protonation state populations vs pH calculated based on pKa values (H2A+: blue, HA: red, and A-: green) (F) Buffering index vs pH profile of water (grey solid line, theoretical) and the sample solution (blue triangles represent experimental data points). A higher concentration of analyte (~5 mM) is necessary for the potentiometric method than the spectrophotometric method in order to provide large enough buffering capacity signal above water for an accurate measurement.
Figure 4.
Figure 4.. Compound selection for the SAMPL6 pKa challenge, with the goal of running subsequent log P/log D challenges on the same compound set.
(A) Flowchart of filtering steps for the selection of compounds that resemble kinase inhibitors and their fragments. Numbers next to arrows indicate the number of compounds remaining after each filtering step. A total of 25 fragment-like and 10 drug-like compounds were selected, out of which procurement and pKa measurements for 17 fragment-like and 7 drug-like compounds were successful, respectively. (B) Frequent heterocycles found in FDA approved kinase inhibitors, as determined by Bemis-Murcko fragmentation into rings [49]. Black structures were represented in SAMPL6 set at least once. Compounds with piperazine and indazole (gray structures) could not be included in the challenge set due to library and selection limitations. (C) Structures of heterocycles that were overrepresented based on our compound selection workflow. We have limited the number of occurrences of these heterocycles to at most one.
Figure 5.
Figure 5.. Determination of SM22 pKa values with cosolvent method and Yasuda-Shedlovsky extrapolation.
A, B, and C show psKa of SM22 determined at various methanol concentrations: 59.07%, 49.72%, 40.08% by weight. Purple solid lines indicate the derivative of the absorbance signal with respect to pH vs pH at multiple wavelengths. psKa values (green flags) were determined by Sirius T3 Refine Software. Blue, red, and green triangles show relative populations of macroscopic protonation states with respect to pH calculated from the experimental data. Notice that as cosolvent concentration increases, psKa1 decreases from 1.90 to 1.47 and psKa2 increases from 7.84 to 8.24. D Yasuda-Shedlovsky extrapolation plot for SM22. Red datapoints correspond to psKa determined at various cosolvent ratios. Based on linear fitting to psKa + log[H2O] vs 1/∈, pKa1 and pKa2 in 0% cosolvent (aqueous solution) was determined as 2.45 and 7.42, respectively. R2 values of linear fits are both 0.99. The slope of Yasuda-Shedlovsky extrapolation shows if the observed titration has acidic (positive slope) or basic (negative slope) character dominantly, although this is an macroscopic observation and should not be relied on for annotation of pKas to functional groups (microscopic pKas).
Figure 6.
Figure 6.. Molecules used in the SAMPL6 pKa challenge.
Experimental UV-metric pKa measurements were performed for these 24 molecules and discernable macroscopic pKas are reported. Uncertainties are expressed as the standard error of the mean (SEM) of three independent measurements. We depicted neutral states of the molecules as sites of protonation were not determined by UV-metric methods. 2D structures were created with OpenEye OEDepict Toolkit [59]. Canonical isomeric SMILES of molecules in this figure and pKa values measured in replicate experiments can be found in Table SI 1 and Table SI 3, respectively.
Figure 7.
Figure 7.. pKa measurements with UV-metric method with cosolvent and UV-metric method in water show good correlation.
17 pKa values (blue marks) of 13 chemicals were measured with both UV-metric pKa method in water and UV-metric pKa method with methanol as cosolvent (Yasuda-Shedlovsky extrapolation to 0% methanol). Dashed black line has slope of 1, representing perfect correlation. Dark and light green shaded areas indicate ±0.5 and ±1.0 pKa unit difference regions, respectively. Error bars are plotted as the SEM of replicate measurements, although they are not visible since the largest SEM is 0.04. MD: Mean difference, MAD: Mean absolute deviation, RMSD: Root-mean-square deviation. Confidence intervals (reported in brackets) report the 95%ile CI calculated over 10 000 bootstrap samples. Experimental data used in this plot is reported in Supplementary Table 4.
Figure 8.
Figure 8.. Dominant protonation microstates of SM07 and SM14 characterized by NMR.
(A) Sequence of protonation sites of SM07 were determined by1 H-15N HMBC experiments in 1:2 water:methanol mixture. Left: The plot of15N chemical shifts of the N-10, N-12, and N-8 resonances of SM07 vs titrated TFA-d equivalents, showing the mono-protonation of N-12 as evidenced by its large upfield chemical shifts change. Acidity of the medium increased as more equivalents of TFA-d were added. Electronic effects due to protonation of N-12 caused downfield chemical shift change of N-10 and N-8 between 0–1 equivalents of TFA-d. Right: NMR-based model of the order of dominant protonation states for SM07. The protonation event was only observed at N-12. Microstates shown in the figure are the most likely contributors to the UV-metric pKa of 6.08 ± 0.01. (B) Sequence of protonation sites of SM14were determined by1 H-15N HMBC experiments in acetonitrile. Left: The plot of 15N chemical shifts of N-9, N-7, and N-16 of SM14 vs titrations of TFA-d equivalents, showing two sequential protonation events. The first protonation occured at N-9; a large upfield chemical shift change of 71.6 ppm was seen between 0–1 equivalents of TFA-d. Downfield chemical shift changes observed for N-7 and N-19 in this region were due the electronic effect from the protonation of N-9. N-16 also exhibited a small upfield chemical shift change of 4.4 ppm between 2.5–10 equivalents of TFA-d, which indicated N-16 as the second site of protonation. Right: NMR based model of the order of dominant protonation states for SM14, showing two sequential protonation events. Also, two pKa values were detected with UV-metric pKa measurements for SM14. Assuming that the sequence of protonation events will be conserved between water and acetonitrile solvents, SM140 and SM14+1 microstates shown in the figure are the major contributors to the UV-metric pKa value 5.30 ± 0.01. SM14+1 and SM14+2 microstates shown in the figure are the major pair of microstates contributing to the UV-metric pKa value 2.58 ± 0.01. There could be minor microstates with very low populations that could not be distinguished in these NMR experiments.

Similar articles

Cited by

References

    1. Mobley DL, Chodera JD, Isaacs L, Gibb BC. Advancing predictive modeling through focused development of model systems to drive new modeling innovations. UC Irvine: Department of Pharmaceutical Sciences, UCI; 2016; https://escholarship.org/uc/item/7cf8c6cr.
    1. Drug Design Data Resource, SAMPL;. https://drugdesigndata.org/about/sampl.
    1. Nicholls A, Mobley DL, Guthrie JP, Chodera JD, Bayly CI, Cooper MD, Pande VS. Predicting Small-Molecule Solvation Free Energies: An Informal Blind Test for Computational Chemistry. J Med Chem. 2008. February; 51(4):769–779. doi: 10.1021/jm070549+. - DOI - PubMed
    1. Guthrie JP. A Blind Challenge for Computational Solvation Free Energies: Introduction and Overview. J Phys Chem B. 2009. January; 113(14):4501–4507. - PubMed
    1. Skillman AG, Geballe MT, Nicholls A. SAMPL2 Challenge: Prediction of Solvation Energies and Tautomer Ratios. J Comput Aided Mol Des. 2010. April; 24(4):257–258. doi: 10.1007/s10822-010-9358-0. - DOI - PubMed

Publication types

MeSH terms