. 2019 Jan;25(1):39-56.
doi: 10.1111/gcb.14413. Epub 2018 Nov 8.

Compositional response of Amazon forests to climate change

Adriane Esquivel-Muelbert  1 Timothy R Baker  1 Kyle G Dexter  2   3 Simon L Lewis  1   4 Roel J W Brienen  1 Ted R Feldpausch  5 Jon Lloyd  6 Abel Monteagudo-Mendoza  7   8 Luzmila Arroyo  9 Esteban Álvarez-Dávila  10 Niro Higuchi  11 Beatriz S Marimon  12 Ben Hur Marimon-Junior  12 Marcos Silveira  13 Emilio Vilanova  14   15 Emanuel Gloor  1 Yadvinder Malhi  16 Jerôme Chave  17 Jos Barlow  18   19 Damien Bonal  20 Nallaret Davila Cardozo  21 Terry Erwin  22 Sophie Fauset  1 Bruno Hérault  23   24 Susan Laurance  25 Lourens Poorter  26 Lan Qie  6 Clement Stahl  27 Martin J P Sullivan  1 Hans Ter Steege  28   29 Vincent Antoine Vos  30   31 Pieter A Zuidema  26   32 Everton Almeida  33 Edmar Almeida de Oliveira  12 Ana Andrade  34 Simone Aparecida Vieira  35 Luiz Aragão  5   36 Alejandro Araujo-Murakami  37 Eric Arets  38 Gerardo A Aymard C  39 Christopher Baraloto  40 Plínio Barbosa Camargo  41 Jorcely G Barroso  42 Frans Bongers  26 Rene Boot  43 José Luís Camargo  34 Wendeson Castro  44 Victor Chama Moscoso  8   45 James Comiskey  22   46 Fernando Cornejo Valverde  47 Antonio Carlos Lola da Costa  48 Jhon Del Aguila Pasquel  49   50 Anthony Di Fiore  51 Luisa Fernanda Duque  10 Fernando Elias  12 Julien Engel  40   52 Gerardo Flores Llampazo  53 David Galbraith  1 Rafael Herrera Fernández  54   55 Eurídice Honorio Coronado  50 Wannes Hubau  56 Eliana Jimenez-Rojas  57 Adriano José Nogueira Lima  58 Ricardo Keichi Umetsu  12 William Laurance  59 Gabriela Lopez-Gonzalez  1 Thomas Lovejoy  60 Omar Aurelio Melo Cruz  61 Paulo S Morandi  12 David Neill  62 Percy Núñez Vargas  8 Nadir C Pallqui Camacho  8 Alexander Parada Gutierrez  39 Guido Pardo  31 Julie Peacock  1 Marielos Peña-Claros  26   32 Maria Cristina Peñuela-Mora  63 Pascal Petronelli  64 Georgia C Pickavance  1 Nigel Pitman  65 Adriana Prieto  66 Carlos Quesada  58 Hirma Ramírez-Angulo  14 Maxime Réjou-Méchain  67 Zorayda Restrepo Correa  68 Anand Roopsind  69 Agustín Rudas  66 Rafael Salomão  70   71 Natalino Silva  72 Javier Silva Espejo  73 James Singh  74 Juliana Stropp  75 John Terborgh  76 Raquel Thomas  69 Marisol Toledo  37 Armando Torres-Lezama  77 Luis Valenzuela Gamarra  7 Peter J van de Meer  78 Geertje van der Heijden  79 Peter van der Hout  80 Rodolfo Vasquez Martinez  7 Cesar Vela  81 Ima Célia Guimarães Vieira  82 Oliver L Phillips  1
Affiliations

Compositional response of Amazon forests to climate change

Adriane Esquivel-Muelbert et al. Glob Chang Biol. 2019 Jan.

Abstract

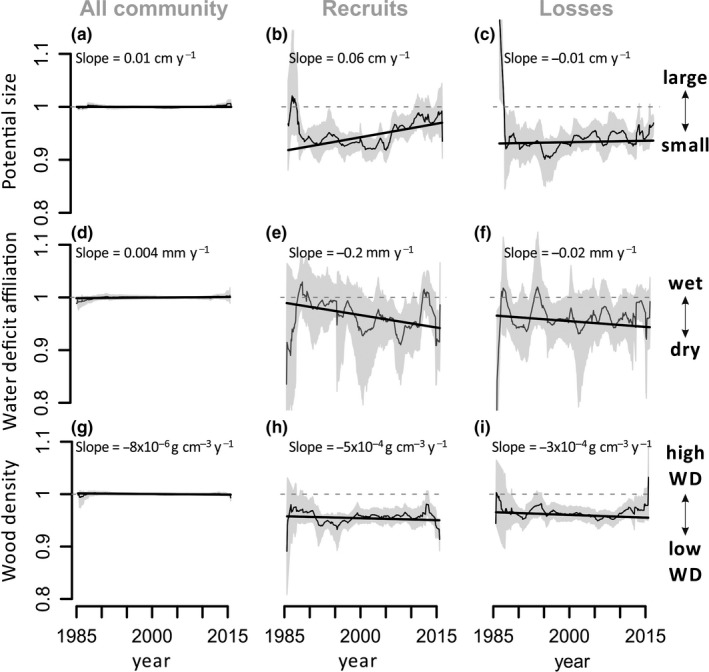
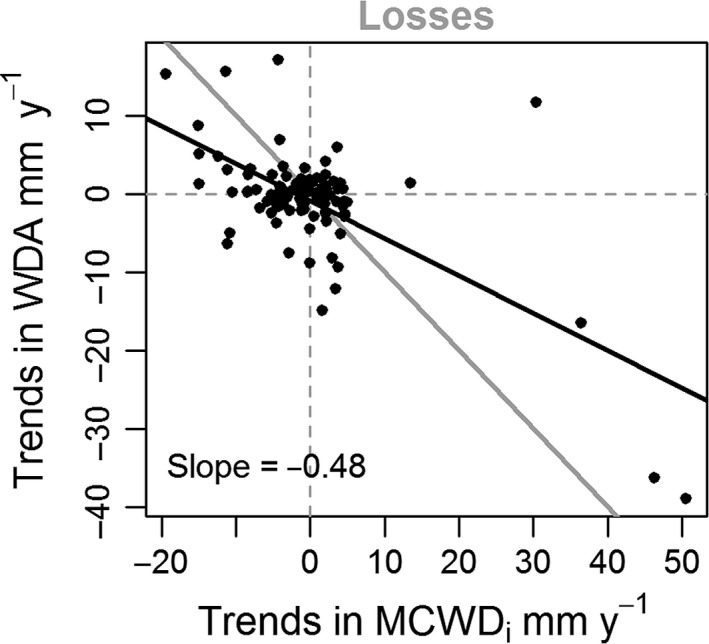
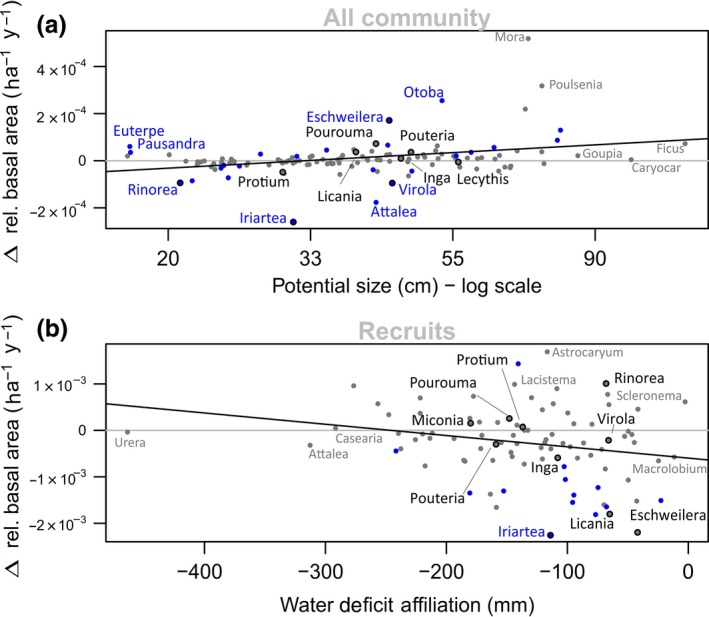
Most of the planet's diversity is concentrated in the tropics, which includes many regions undergoing rapid climate change. Yet, while climate-induced biodiversity changes are widely documented elsewhere, few studies have addressed this issue for lowland tropical ecosystems. Here we investigate whether the floristic and functional composition of intact lowland Amazonian forests have been changing by evaluating records from 106 long-term inventory plots spanning 30 years. We analyse three traits that have been hypothesized to respond to different environmental drivers (increase in moisture stress and atmospheric CO2 concentrations): maximum tree size, biogeographic water-deficit affiliation and wood density. Tree communities have become increasingly dominated by large-statured taxa, but to date there has been no detectable change in mean wood density or water deficit affiliation at the community level, despite most forest plots having experienced an intensification of the dry season. However, among newly recruited trees, dry-affiliated genera have become more abundant, while the mortality of wet-affiliated genera has increased in those plots where the dry season has intensified most. Thus, a slow shift to a more dry-affiliated Amazonia is underway, with changes in compositional dynamics (recruits and mortality) consistent with climate-change drivers, but yet to significantly impact whole-community composition. The Amazon observational record suggests that the increase in atmospheric CO2 is driving a shift within tree communities to large-statured species and that climate changes to date will impact forest composition, but long generation times of tropical trees mean that biodiversity change is lagging behind climate change.

Keywords: bioclimatic niches; climate change; compositional shifts; functional traits; temporal trends; tropical forests.


Figures

Figure 1
Figure 1
Schematic model representing the different components of forest demography. The box on the left represents an inventory plot of a forest community at the first census (C t0), while the box on the right shows the community at the second census (C t1). At C t1 recruits (R), that is those trees that attained 10 cm of diameter within the census interval, will now be part of the community analysed. Other trees will have died thus leaving the community, here called losses (L). Those trees from C t0 that survive through the census interval are expected to grow (G). Thus, the basal area of the whole community at t 1 is C t1 = C t0 + G t1 + R t1 − L t1 and the net flux between t 0 and t 1 = G t1 + R t1 − L t1. Here we investigate the trends in the characteristics and identity of genera within these components of forest demography. This figure represents dynamics in basal area terms; similar logic can be applied for stem‐based analyses. Note that in this case we would not be interested in the growth of trees surviving from t 0 to t 1, and so the net flux would be represented as R t1 − L t1
Figure 2
Figure 2
Trends in maximum cumulative water deficit (MCWD) across the Amazon Basin. (a) Frequency of annual linear trends in MCWD per plot between 1985 and 2014. Note that for most plots, the climate has significantly shifted towards more negative MCWD values. Mean change and 95% confidence intervals (black solid and dashed lines) across our plots weighting plots by plot area were calculated using a bootstrap procedure by resampling the trends in MCWD from all plots 10,000 times with replacement. (b) Distribution of annual linear trends in MCWD per plot. Arrows pointing down (in red) represent locations where MCWD has become more negative over time, that is the dry season has become more intense. Arrows pointing up (blue) represent less negative values of MCWD meaning that moisture stress decreased. The intensity of the colours in (a,b) represent the strength of the climate trend. Note the difference in scale between drying and wetting trends colour bars. (c) Mean annual MCWD across plots, and 95% CI from resampling among all plots, note lower MCWD values at 2004–2005 and 2009–2010 (grey‐shaded rectangles)
Figure 3
Figure 3
Trends in functional composition between 1985 and 2015 across Amazonia. The y‐axes show stem‐based community weighted mean (CWM) trends in (a–c) water deficit affiliation (WDA), (d–f) potential size (PS) and (g–i) wood density (WD) at genus level. Values are standardized with respect to the whole plot population to allow comparison among traits meaning that the value for the whole community in the first census is equal to 1. CWM trends are shown for the whole community (a,d,g), recruits (b,e,h), and losses (c,f,i). Grey line and grey‐shaded area show standardized mean and 95% CI census‐level CWM, which can be influenced by some switching of plots assessed through time. Trend lines show linear mixed models (LMM) considering the slope and intercept of plots as random effects. Slope values for LMM are shown in each graph—these are not standardized by plot population and are shown at a different scale for each trait
Figure 4
Figure 4
Relationship between trends in climate and functional composition of basal area mortality. The y‐axis represents plot trends in water deficit affiliation (WDA) per year calculated as the linear slopes of basal area‐based community weighted mean within the losses and x‐axis shows the trends in most extreme dry season within a census interval (MCWD i). The black line represents OLS linear regression, and in the 1:1 line is shown in grey. Note that changes in the tree community are correlated to changes in climate (Kendall τ = −0.2; p < 0.01), so that stronger drying trends favour the mortality of wet‐affiliated taxa. Correlations hold when outliers are removed (Kendall τ = −0.4; p < 0.05 when excluding outliers where climate trend >5 mm/year and trends in losses >10 mm/year) [Colour figure can be viewed at wileyonlinelibrary.com]
Figure 5
Figure 5
Floristic changes behind the detected functional shifts. The y‐axes represent mean linear slopes of plot level genera relative abundance across the Amazon in terms of number of individuals or basal area as a function of time, with each plots’ contribution weighted by the square root of plot area and monitoring period. Grey horizontal lines indicate zero change. The x‐axes represent genus‐level traits. (a) Trends in relative basal area within the whole community versus potential size (cm), plotted in the log scale to facilitate visualization; (b) trends in stem relative abundance within the recruits versus water deficit affiliation (mm). Genera that show significant trends in abundance across the basin are shown in blue. Black contour marks the 10 most abundant genera in terms of number of stems

References

    1. Allen, R. G. , Smith, M. , Pereira, L. S. , & Perrier, A. (1994). An update for the calculation of reference evapotranspiration. ICID Bulletin, 43, 35–92.
    1. Aragão, L. , Malhi, Y. , Roman‐ Cuesta, R. M. , Saatchi, S. , Anderson, L. O. , & Shimabukuro, Y. E. (2007). Spatial patterns and fire response of recent Ammazonian droughts. Geophysical Research Letters, 34, L07701.
    1. Baker, T. R. , Phillips, O. L. , Malhi, Y. , Almeida, S. , Arroyo, L. , Di Fiore, A. , … Vásquez Martínez, R. (2004). Variation in wood density determines spatial patterns in Amazonian forest biomass. Global Change Biology, 10, 545–562. 10.1111/j.1365-2486.2004.00751.x - DOI
    1. Baker, T. R. , Vela Díaz, D. M. , Chama Moscoso, V. , Navarro, H. G. , Monteagudo, A. , Pinto, R. , … Phillips, O. L. (2016). Consistent, small effects of treefall disturbances on the composition and diversity of four Amazonian forests. Journal of Ecology, 104, 497–506. 10.1111/1365-2745.12529 - DOI - PMC - PubMed
    1. Baraloto, C. , Paine, C. E. T. , Patino, S. , Bonal, D. , Herault, B. , & Chave, J. (2010). Functional trait variation and sampling strategies in species‐rich plant communities. Functional Ecology, 24, 208–216. 10.1111/j.1365-2435.2009.01600.x - DOI

Publication types