Clinical Trial
. 2018 Nov;97(45):e13120.
doi: 10.1097/MD.0000000000013120.

Long-term safety and immunogenicity of the M72/AS01E candidate tuberculosis vaccine in HIV-positive and -negative Indian adults: Results from a phase II randomized controlled trial

Affiliations
Clinical Trial

Long-term safety and immunogenicity of the M72/AS01E candidate tuberculosis vaccine in HIV-positive and -negative Indian adults: Results from a phase II randomized controlled trial

Nagalingeswaran Kumarasamy et al. Medicine (Baltimore). 2018 Nov.

Erratum in

Abstract

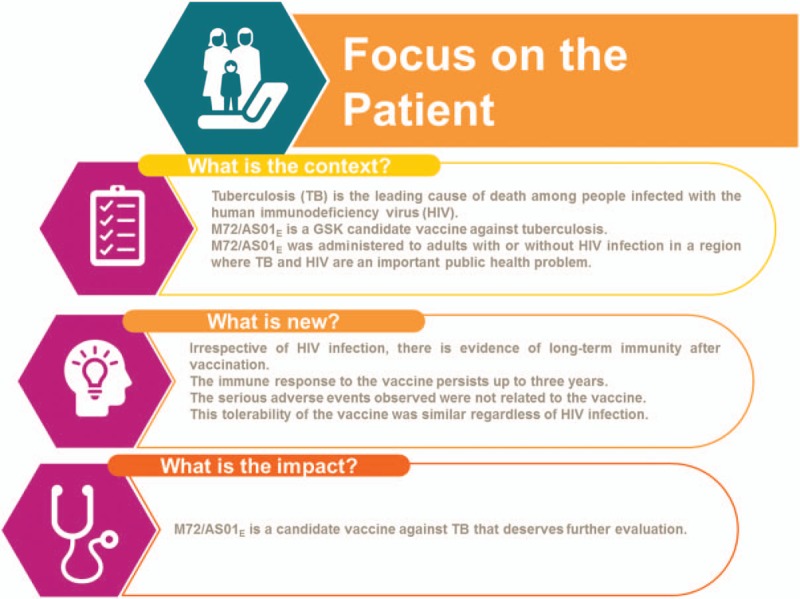
Objectives: To assess the long-term safety and immunogenicity of the M72/ Adjuvant System (AS01E) candidate tuberculosis (TB) vaccine up to 3 years post-dose 2 (Y3) in human immunodeficiency virus (HIV)-positive (HIV+) and HIV-negative (HIV-) Indian adults.

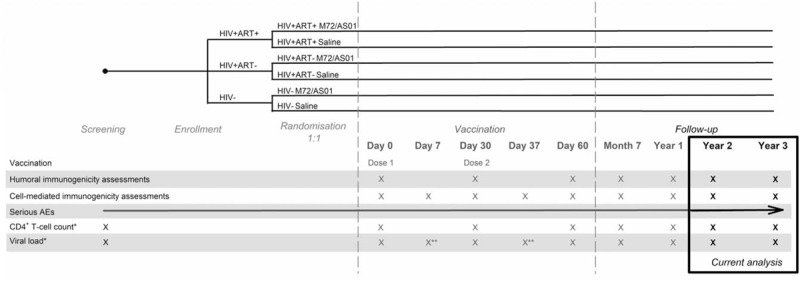
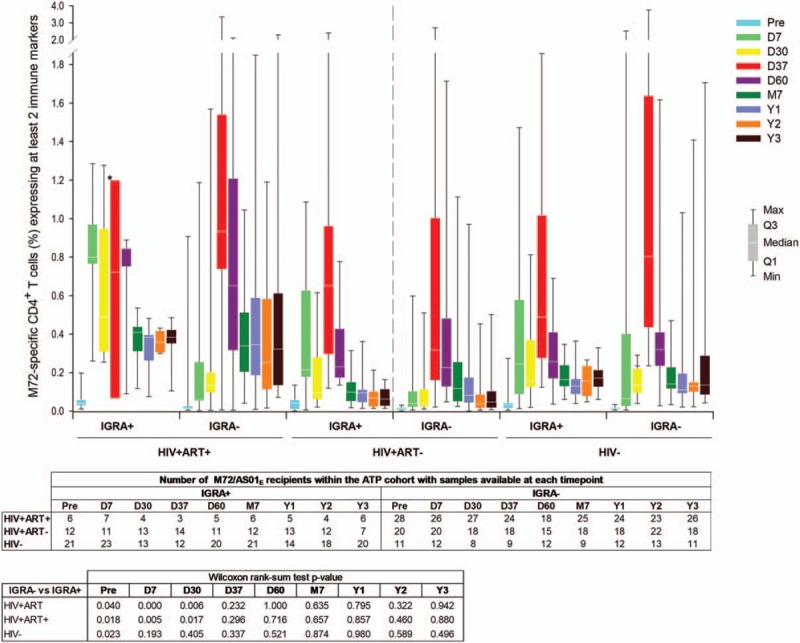
Methods: This phase II, double-blind, randomised, controlled clinical trial (NCT01262976) was conducted at YRG CARE Medical Centre, in Chennai, India, between January 2011 and June 2015.Three cohorts (HIV+ participants stable on antiretroviral therapy [ART; HIV+ART+], HIV+ ART-naïve [HIV+ART-], and HIV- participants) were randomised (1:1) to receive 2 doses of M72/AS01E (M72/AS01E groups) or saline (control groups) 1 month apart and were followed up toY3. Latent TB infection was assessed at screening using an interferon-gamma (IFN-γ) release assay (IGRA). Safety and immunogenicity results up to Y1 post-vaccination were reported elsewhere. Here, we report serious adverse events (SAEs), humoral and cell-mediated immune (CMI) responses to M72 recorded at Y2 and Y3.

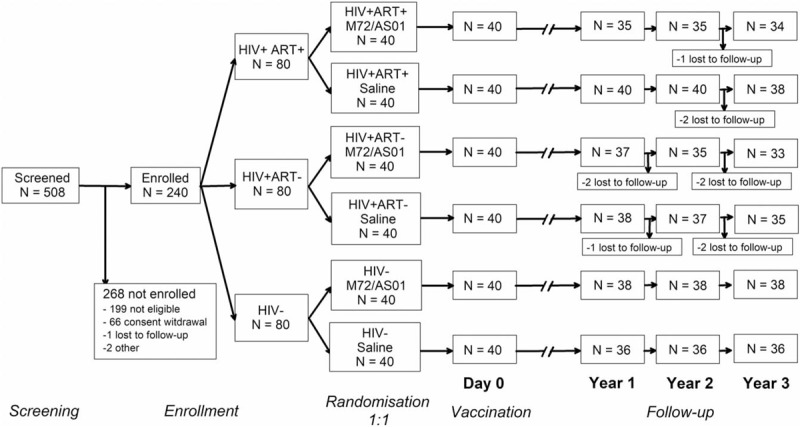
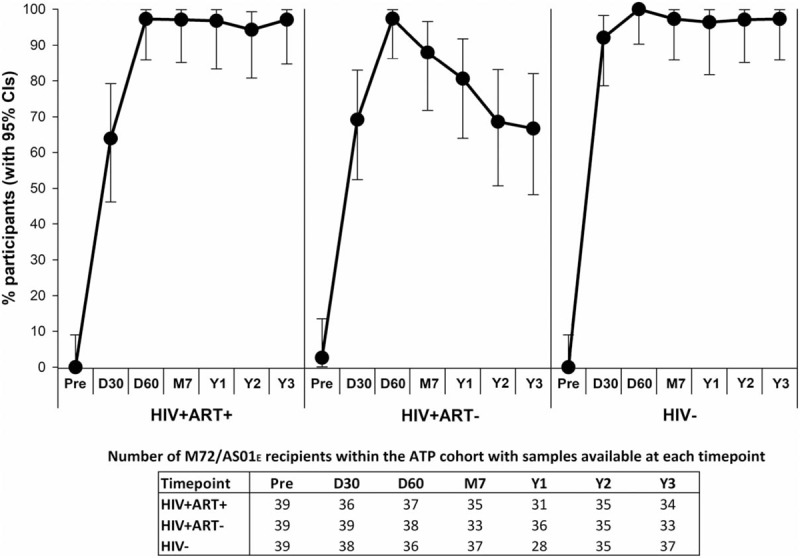
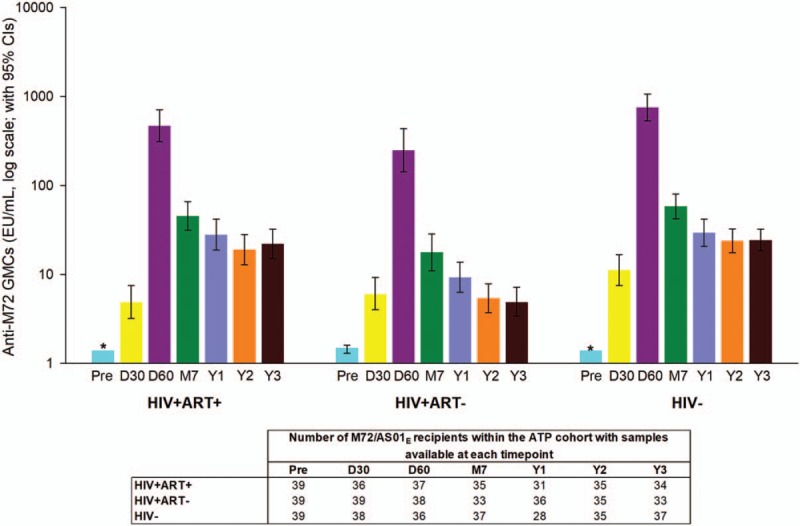
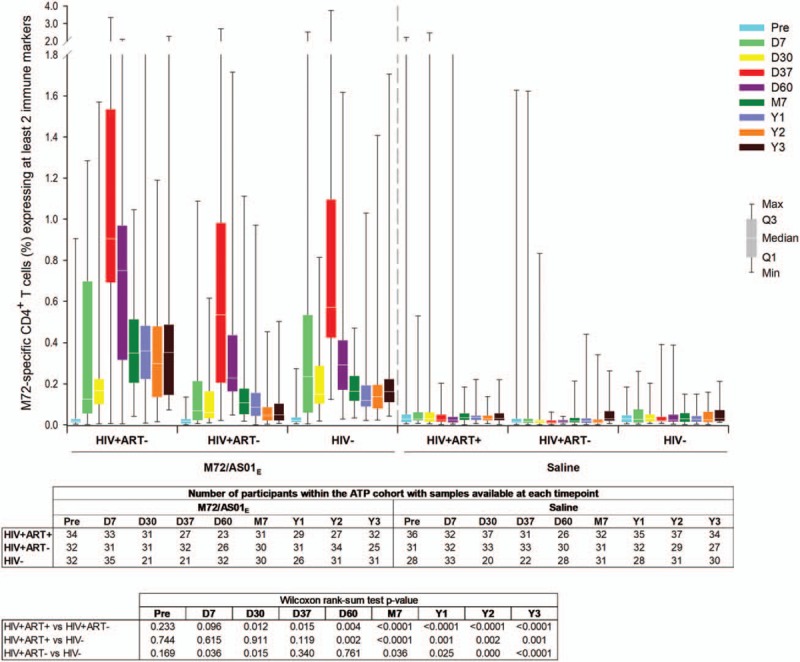
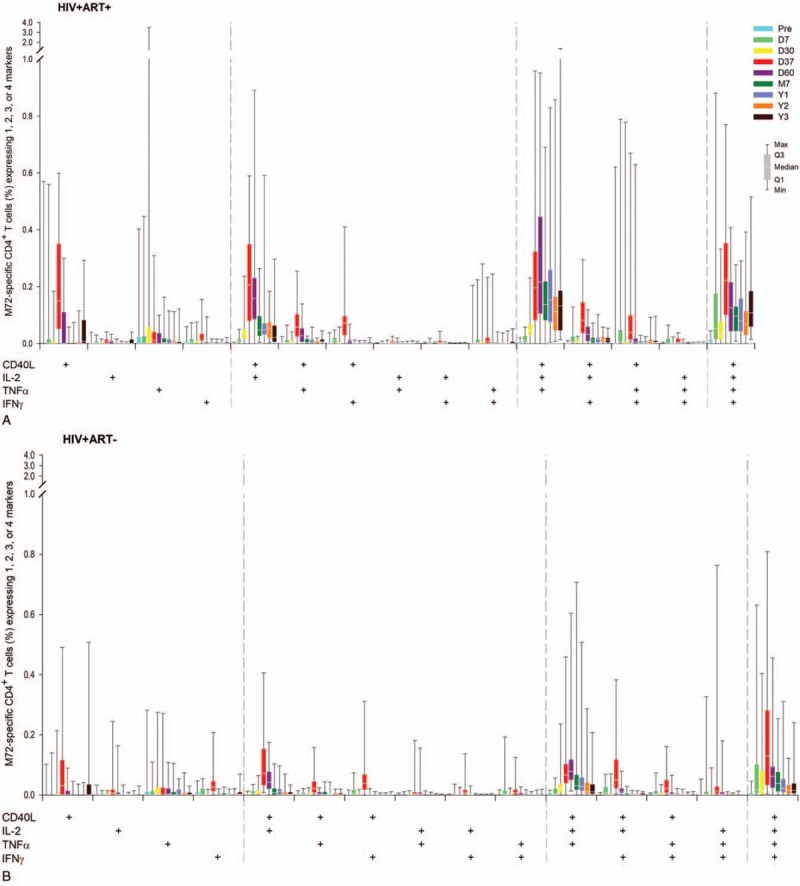
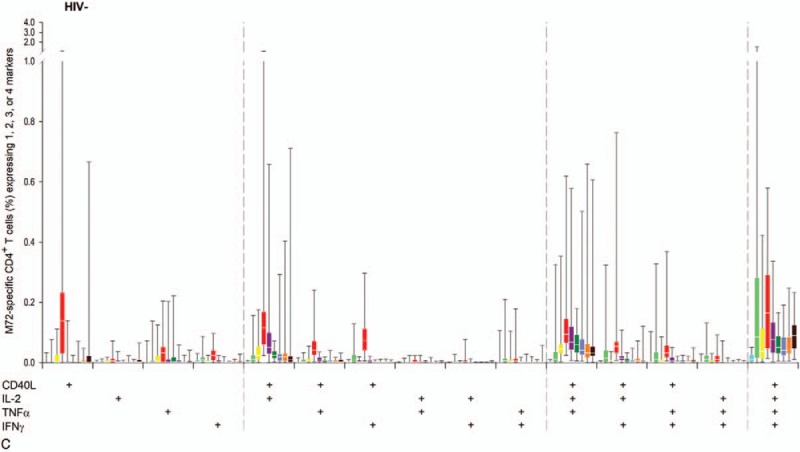
Results: Of 240 enrolled and vaccinated participants, 214 completed the long-term follow-up part of the study.In addition to SAEs previously described, between Y1 and Y2 1 M72/AS01E recipient in the HIV+ART+ cohort reported 2 SAEs (sinus cavernous thrombosis and gastroenteritis) that were not considered as causally related to the study vaccine.Vaccination elicited persistent humoral immune responses against M72. At Y3, seropositivity rates were 97.1%, 66.7%, and 97.3% and geometric mean concentrations (GMCs) were 22.0 ELISA units (EU)/mL, 4.9 EU/mL, and 24.3 EU/mL in the HIV+ART+, HIV+ART-, and HIV- cohorts, respectively. Humoral immune response was lowest in the HIV+ART- cohort.In M72/AS01E recipients, no notable decrease in the frequency of M72-specific CD4 T-cells expressing ≥2 immune markers among interleukin-2 (IL-2), IFN-γ, tumour necrosis factor alpha (TNF-α) and CD40 ligand (CD40L) was observed at Y3 post-vaccination. Median values (interquartile range) of 0.35% (0.13-0.49), 0.05% (0.01-0.10), and 0.15% (0.09-0.22) were recorded in the HIV+ART+, HIV+ART- and HIV- cohorts, respectively. CD4 T-cell response was lowest in the HIV+ART- cohort.No CD8 T-cell response was observed.

Conclusion: The cellular and humoral immune responses induced by M72/AS01E in HIV+ and HIV- adults persisted up to Y3 post-vaccination. No safety concerns were raised regarding administration of M72/AS01E to HIV+ adults.

Clinical trial registration: NCT01262976 (www.clinicaltrials.gov).


Conflict of interest statement

The authors report no other conflicts of interest

Figures

Figure 1
Figure 1
Study design. Day 0 = pre-vaccination; HIV+ART+ = HIV-positive participants on antiretroviral therapy; HIV+ART- = HIV-positive, antiretroviral therapy-naïve participants; HIV− = HIV-negative participants; only for HIV+ cohorts; ∗∗only for HIV+ART- cohort.
Figure 2
Figure 2
Participant flow. HIV+ART+ = HIV-positive participants on antiretroviral therapy; HIV+ART- = HIV-positive, antiretroviral therapy-naïve participants; HIV− = HIV-negative participants; N =  number of participants.
Figure 3
Figure 3
Seropositivity rate. The percentage of participants seropositive for antibodies against M72 at each timepoint, along with 95% CIs, is presented for participants who received M72/AS01E and were included in the ATP cohort for immunogenicity. ATP = according-to-protocol; CI = confidence interval; D30 = 30 days post-dose 1; D60 = 30 days post-dose 2; HIV+ART+ = HIV-positive participants on antiretroviral therapy; HIV+ART- = HIV-positive, antiretroviral therapy-naïve participants; HIV− = HIV-negative participants; M7 = 6 months post-dose 2; Pre = pre-vaccination; Y1 = 1 year post-dose 2; Y2 = 2 years post-dose 2; Y3 = 3 years post-dose 2.
Figure 4
Figure 4
Geometric mean concentrations of antibodies against M72. Geometric mean concentrations are presented for participants who received M72/AS01E and were included in the ATP cohort for immunogenicity. The colours represent the corresponding time points in Figure 5, 6, and 7. CI = confidence interval; D30 = 30 days post-dose 1; D60 = 30 days post-dose 2; EU = enzyme-linked immunosorbent assay units; GMCs = geometric mean concentrations; HIV+ART+ = HIV-positive participants on antiretroviral therapy; HIV+ART- = HIV-positive, antiretroviral therapy-naïve participants; HIV- = HIV-negative participants; M7 = 6 months post-dose 2; Y1 = 1 year post-dose 2; Pre = pre-vaccination; Y2 = 2 years post-dose 2; Y3 = 3 years post-dose 2. Note: The lower limit of the 95% CI is zero.
Figure 5
Figure 5
M72-specific CD4+ T-cell responses following vaccination with M72/AS01E. Data for all participants vaccinated with M72/AS01E and included in the ATP cohort are presented as percentages of M72-specific CD4+ T-cells expressing at least 2 immune markers among IFN-γ, IL-2, TNF-α, and CD40L of all CD4+ T-cells, along with first and third quartiles and minimum and maximum values measured. % = percentage; D7 = 7 days post-dose 1; D30 = 30 days post-dose 1; D37 = 7 days post-dose 2; D60 = 30 days post-dose 2; HIV+ART+ = HIV-positive participants on antiretroviral therapy; HIV+ART- = HIV-positive, antiretroviral therapy-naïve participants; HIV− = HIV-negative participants; M7 = 6 months post-dose 2; Pre = pre-vaccination; Q1 = first quartile; Q3 = third quartile; Y1 = 1 year post-dose 2; Y2 = 2 years post-dose 2; Y3 = 3 years post-dose 2.
Figure 6
Figure 6
Immune-marker expression profiles following vaccination with M72/AS01E. Data for all participants vaccinated with M72/AS01E and included in the ATP cohort are presented as percentages of M72-specific CD4+ T-cells expressing single immune markers among IFN-γ, IL-2, TNF-α and CD40L of all CD4+ T-cells and any combination of the 4 markers, along with first and third quartiles and minimum and maximum values measured. % = percentage; D7 = 7 days post-dose 1; D30 = 30 days post-dose 1; D37 = 7 days post-dose 2; D60 = 30 days post-dose 2; HIV+ART+ = HIV-positive participants on antiretroviral therapy; HIV+ART- = HIV-positive, antiretroviral therapy-naïve participants; HIV− = HIV-negative participants; M7 = 6 months post-dose 2; Pre = pre-vaccination; Q1 = first quartile; Q3 = third quartile; Y1 = 1 year post-dose 2; Y2 = 2 years post-dose 2; Y3 = 3 years post-dose 2.
Figure 6 (Continued)
Immune-marker expression profiles following vaccination with M72/AS01E. Data for all participants vaccinated with M72/AS01E and included in the ATP cohort are presented as percentages of M72-specific CD4+ T-cells expressing single immune markers among IFN-γ, IL-2, TNF-α and CD40L of all CD4+ T-cells and any combination of the 4 markers, along with first and third quartiles and minimum and maximum values measured. % = percentage; D7 = 7 days post-dose 1; D30 = 30 days post-dose 1; D37 = 7 days post-dose 2; D60 = 30 days post-dose 2; HIV+ART+ = HIV-positive participants on antiretroviral therapy; HIV+ART- = HIV-positive, antiretroviral therapy-naïve participants; HIV− = HIV-negative participants; M7 = 6 months post-dose 2; Pre = pre-vaccination; Q1 = first quartile; Q3 = third quartile; Y1 = 1 year post-dose 2; Y2 = 2 years post-dose 2; Y3 = 3 years post-dose 2.
Figure 7
Figure 7
M72-specific CD4+ T-cell responses following vaccination with M72/AS01E according to Interferon Gamma Release Assay results at baseline. Data for IGRA-positive and IGRA-negative participants vaccinated with M72/AS01E and included in the ATP cohort are presented as percentages of M72-specific CD4+ T-cells expressing at least 2 immune markers among IFN-γ, IL-2, TNF-α, and CD40L of all CD4+ T-cells, along with first and third quartiles and minimum and maximum values measured. % = percentage; ATP = according-to-protocol; D7 = 7 days post-dose 1; D30 = 30 days post-dose 1; D37 = 7 days post-dose 2; D60 = 30 days post-dose 2; HIV+ART+ = HIV-positive participants on antiretroviral therapy; HIV+ART- = HIV-positive, antiretroviral therapy-naïve participants; HIV− = HIV-negative participants; IGRA = interferon-gamma release assay; M7 = 6 months post-dose 2; Pre = pre-vaccination; Q1 = first quartile; Q3 = third quartile; Y1 = 1 year post-dose 2; Y2 = 2 years post-dose 2; Y3 = 3 years post-dose 2.
Figure 8
Figure 8
Focus on the patient section.

References

    1. Tiberi S, Carvalho AC, Sulis G, et al. The cursed duet today: tuberculosis and HIV-coinfection. Presse Med 2017;46:e23–39. - PubMed
    1. WHO. Global tuberculosis report 2017. Geneva: World Health Organization; 2017.
    1. Pawlowski A, Jansson M, Skold M, et al. Tuberculosis and HIV co-infection. PLoS Pathog 2012;8:e1002464. - PMC - PubMed
    1. von Reyn CF, Bakari M, Arbeit RD, et al. New vaccines for the prevention of tuberculosis in human immunodeficiency virus infection. Int J Tuberc Lung Dis 2012;16:718–23. - PubMed
    1. Usman MM, Ismail S, Teoh TC. Vaccine research and development: tuberculosis as a global health threat. Cent Eur J Immunol 2017;42:196–204. - PMC - PubMed

Publication types

Associated data