. 2016 Feb 27;7(3):38.
doi: 10.3390/mi7030038.

Allergy Testing and Drug Screening on an ITO-Coated Lab-on-a-Disc

Affiliations

Allergy Testing and Drug Screening on an ITO-Coated Lab-on-a-Disc

Ho Chin Kwok et al. Micromachines (Basel). .

Abstract

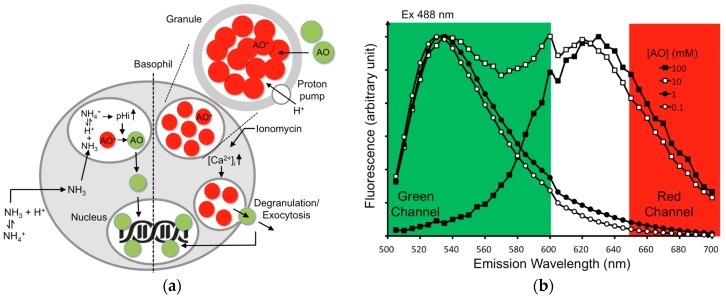
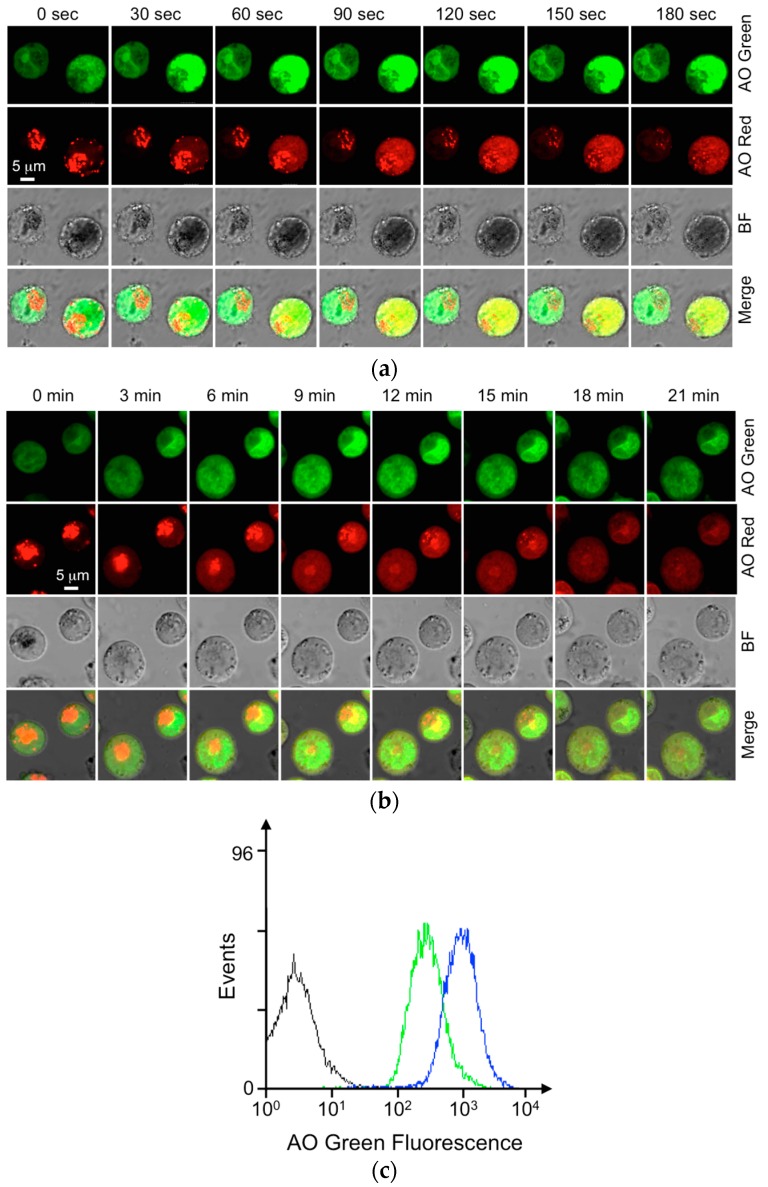
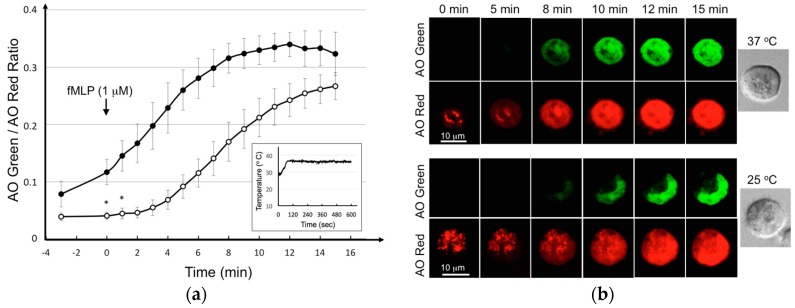
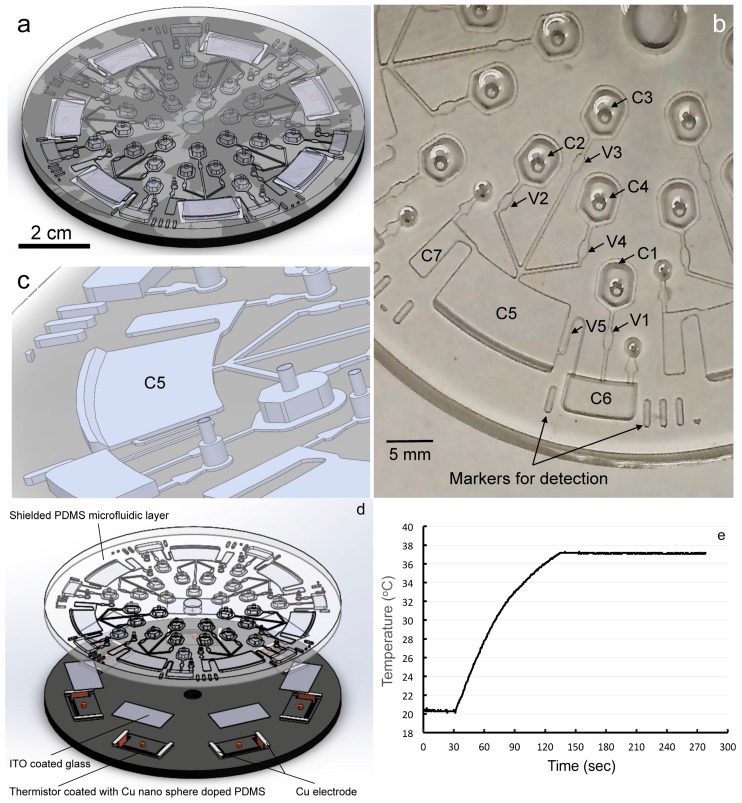
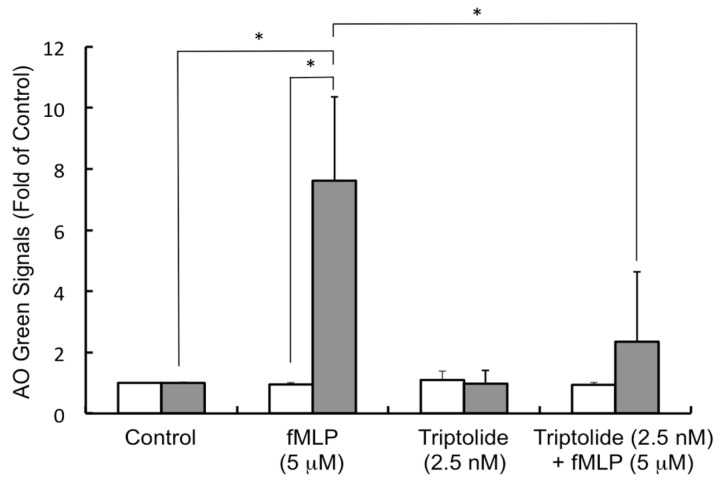
A lab-on-a-disc (LOAD) is a centrifugal microfluidic set-up based on centrifugal force without using micro-pumps to drive reagents and cells to various chambers through channels and valves for reactions. A LOAD coated with conductive transparent indium tin oxide (ITO) for thermal control was developed to screen allergy-blocking agents. When the acridine orange (AO)-loaded KU-812 human basophilic cells were activated in the LOAD by stimuli, AO trapped in the cytoplasmic granules was released externally as an allergic mediator mimetic to report degranulation. This response was monitored by fluorescence when the released AO in supernatant had been transferred, with a higher spinning speed, from the reaction chamber to detection chamber in the LOAD where AO reacted with exogenous DNA. We report here the principles of the system and an improved LOAD set-up with the ITO-coated glass resistive microheater to run assays at 37 °C. By using this platform, we demonstrate here for the first time that triptolide, an active ingredient from the Chinese medicine herb Tripterygium wilfordii Hook f., was able to suppress the fMLP-mediated degranulation in basophils. This serves as an example how LOADs can be used to screen agents to alleviate symptoms of allergy.

Keywords: N-formyl-methionine-leucine-phenylalanine (fMLP); Traditional Chinese Medicine (TCM); World Allergy Organization (WAO); acridine orange (AO); basophil activation test (BAT); bisphenol A (BPA); indium tin oxide (ITO); lab-on-a-disc (LOAD); phorbol 12-myristate 13-acetate (PMA); protein kinase C (PKC).


Conflict of interest statement

All authors declare no conflict of interest.

Figures

Figure 1
Figure 1
AO are trapped in the granules of basophils and exhibit red shift at high concentrations. Weakly basic AO molecules are selectively accumulated within granules as a result of the intragranular acidic pH. Upon entering the basophilic granules, AO dyes become protonated and are trapped inside the organelles (a, right). The resulting high concentrations of AO cause a red shift, thereby giving red fluorescence after excitation at 488 nm. When challenged with NH4Cl, NH4Cl decomposes into ammonia in solution that passes through membranes easily, accumulating in the basophilic granules and promoting granular alkalinization to release AO (a, left). When challenged with ionomycin, the intracellular Ca2+ ion level ([Ca2+]i) increases, which triggers degranulation and releases AO externally (a, right). The released AO dyes then bind to the nuclear DNA and generate strong green fluorescence (a). To demonstrate the phenomenon of red shift, AO was dissolved at the concentration (mM) as indicated (0.1 (open circle), 1 (solid circle), 10 (open square), 100 (solid square)). Emission spectrum of AO at each concentration was scanned from 500 to 700 nm with excitation at 488 nm; emission peak from the solutions of various AO concentrations was normalized to the same level for comparison because the quantum efficiency of the AO red fluorescence is much weaker than that of the green one. High concentrations of AO (≥10 mM) show a red shift (b).
Figure 2
Figure 2
AO was released from the granules of live KU-812 cells by NH4Cl and ionomycin with PMA. KU-812 cells (1 × 10⁶/mL) were loaded with AO (0.5 μg/mL) overnight at 37 °C, 5% CO2. During incubation, AO was actively accumulated in the acidic granules. After loading, cells in suspension were placed in a confocal dish coated with polylysine. After stabilization, cells were activated with NH4Cl (10 mM) (a) or ionomycin (1.0 μM) with PMA (20 nM) (b) at time zero. Bright field (BF), AO red fluorescence, AO green fluorescence images were acquired from a confocal microscope at the time as indicated. Scale bar represents the cell dimension; after stimulation, AO released in the supernatant was transferred to another Eppendorff to label DNA in the chemically fixed HepG2 cells. Histograms from left to right (x-axis in log scale): fixed HepG2 cells in PBS; fixed HepG2 with the supernatant from untreated KU-812 cells; fixed HepG2 with the supernatant from KU-812 cells treated with ionomycin (1.0 μM) and PMA (20 nM) for 20 min at 37 °C, 5% CO2 (c).
Figure 3
Figure 3
Release of AO from the granules of live KU-812 cells by fMLP at different temperatures. AO-loaded KU-812 cells were prepared for live confocal imaging as described in Figure 2. Cells were then challenged with fMLP (1 μM) at time zero. Bright field, AO red fluorescence, AO green fluorescence images were acquired from a confocal microscope at the time as indicated at 25 or 37 °C in an ITO-coated confocal dish. Experiments were repeated at 25 or 37 °C. The ratio of AO green to AO red from cells were calculated and plotted against time, 25 °C: open circle; 37 °C: solid circle. Results are mean ± SD from 5 single cells in one assay. Results were analyzed by Student’s t-test and the p-values less than 0.05 were considered statistically significant. All the data points have a p < 0.05 when compared to the corresponding control values except those with * (a); scale bar in confocal images represents cell dimension (b).
Figure 4
Figure 4
The next generation LOAD for testing allergy. A schematic diagram showing the layout of the LOAD with 7 identical units (a); arrangement of chambers, channels, valves and siphon in one unit for testing allergy (b); a zoom-in diagram showing the flange in C5 (c); assembly of the integrated microfluidic layers with ITO-glass microheaters, electrodes and thermistors is given in panel (d); a typical temperature profile in one reaction chamber of the LOAD using an ITO microheater to control temperature at 37 °C (e).
Figure 5
Figure 5
Triptolide suppressed the fMLP-mediated AO release in KU-812 cells. AO-loaded KU-812 cells were prepared for assay as described in Figure 2. Cells were then challenged with medium buffer alone (Control), fMLP (5 μM) or triptolide (2.5 nM) for AO release at room temperature (open bar) or 37 °C (solid bar) in the LOAD. In the last experiment, cells were pretreated with triptolide (2.5 nM) overnight at 37 °C, 5% CO2. After washing, the AO-loaded KU-812 cells were challenged with fMLP (5 μM) in the LOAD at room temperature or 37 °C. Signals from test groups are normalized with the control data. Results are mean ± SD (n = 4), * p < 0.05.

Similar articles

Cited by

References

    1. WAO White Book 2013. [(accessed on 7 December 2015)]. Available online: http://www.worldallergy.org/definingthespecialty/white_book.php.
    1. Lambert C., Sarrat A., Bienvenu F., Brabant S., Nicaise-Roland P., Alyanakian M.A., Apoil P.A., Capron C., Couderc R., Evrard B., et al. The importance of EN ISO 15189 accreditation of allergen-specific IgE determination for reliable in vitro allergy diagnosis. Allergy. 2015;70:180–186. doi: 10.1111/all.12546. - DOI - PubMed
    1. Novembre E., Bernardini R., Bertini G., Massai G., Vierucci A. Skin-prick-test-induced anaphylaxis. Allergy. 1995;50:511–513. doi: 10.1111/j.1398-9995.1995.tb01187.x. - DOI - PubMed
    1. Pien G.C., Orange J.S. Evaluation and clinical interpretation of hypergammaglobulinemia E: differentiating atopy from immunodeficiency. Ann Allergy Asthma Immunol. 2008;100:392–395. doi: 10.1016/S1081-1206(10)60605-9. - DOI - PubMed
    1. Thyssen J.P., Menné T., Elberling J., Plaschke P., Johansen J.D. Hypersensitivity to local anaesthetics—Update and proposal of evaluation algorithm. Contact Dermat. 2008;59:69–78. doi: 10.1111/j.1600-0536.2008.01366.x. - DOI - PubMed

LinkOut - more resources