. 2019 Feb 1;11(2):459-471.
doi: 10.1093/gbe/evy248.

Dissecting the Genomic Diversification of Late Embryogenesis Abundant (LEA) Protein Gene Families in Plants

Affiliations

Dissecting the Genomic Diversification of Late Embryogenesis Abundant (LEA) Protein Gene Families in Plants

Mariana Aline Silva Artur et al. Genome Biol Evol. .

Abstract

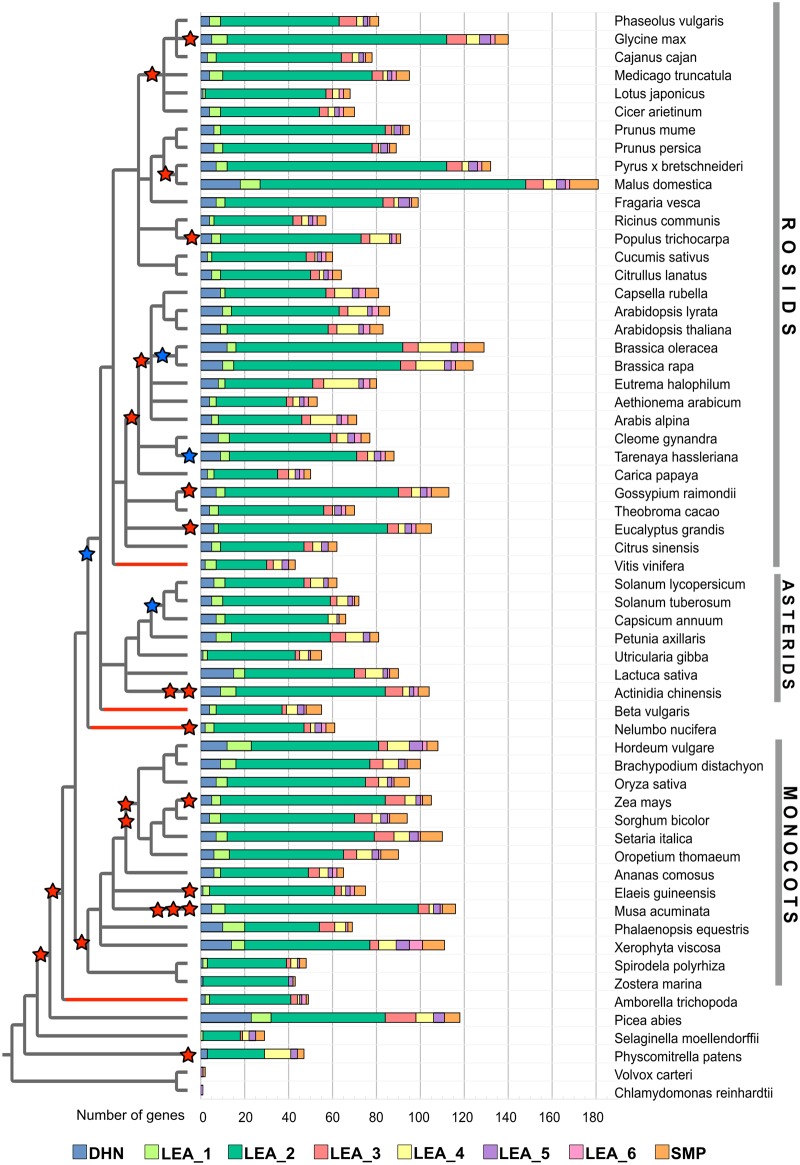
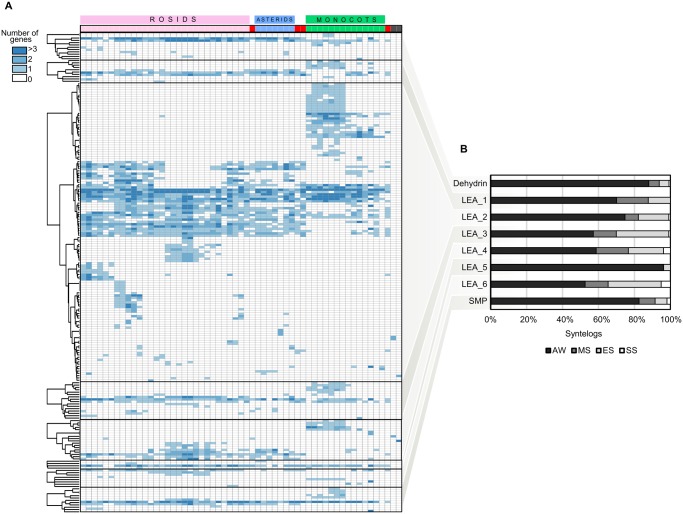
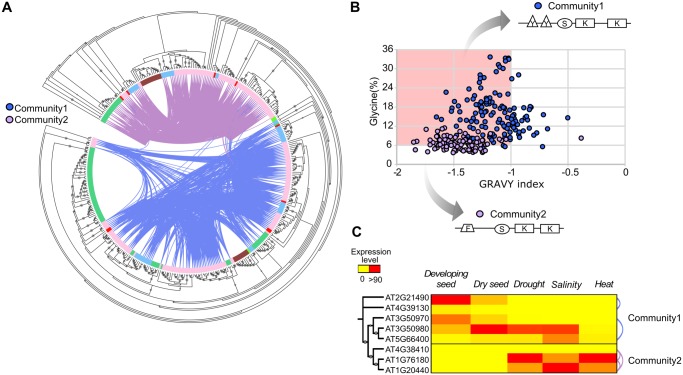
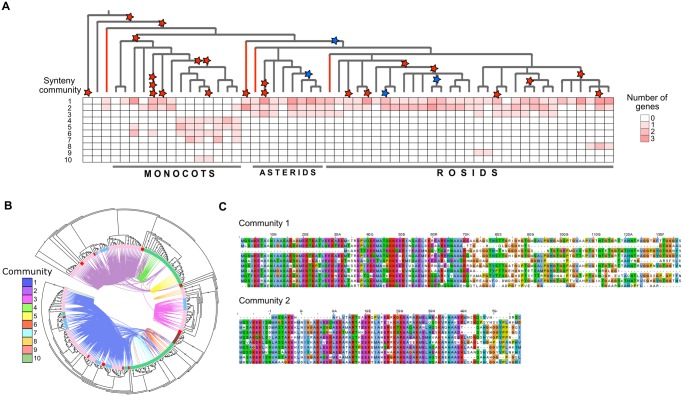
Late embryogenesis abundant (LEA) proteins include eight multigene families that are expressed in response to water loss during seed maturation and in vegetative tissues of desiccation tolerant species. To elucidate LEA proteins evolution and diversification, we performed a comprehensive synteny and phylogenetic analyses of the eight gene families across 60 complete plant genomes. Our integrated comparative genomic approach revealed that synteny conservation and diversification contributed to LEA family expansion and functional diversification in plants. We provide examples that: 1) the genomic diversification of the Dehydrin family contributed to differential evolution of amino acid sequences, protein biochemical properties, and gene expression patterns, and led to the appearance of a novel functional motif in angiosperms; 2) ancient genomic diversification contributed to the evolution of distinct intrinsically disordered regions of LEA_1 proteins; 3) recurrent tandem-duplications contributed to the large expansion of LEA_2; and 4) dynamic synteny diversification played a role on the evolution of LEA_4 and its function on plant desiccation tolerance. Taken together, these results show that multiple evolutionary mechanisms have not only led to genomic diversification but also to structural and functional plasticity among LEA proteins which have jointly contributed to the adaptation of plants to water-limiting environments.

Keywords: LEA proteins; abiotic stress adaptation; desiccation tolerance; gene family evolution; intrinsic disorder.


Figures

<sc>Fig</sc>. 1.
Fig. 1.
—Species phylogeny and number of LEA genes identified in plant genomes. The species tree was inferred using NCBI Taxonomy Browser (https://www.ncbi.nlm.nih.gov/taxonomy; last accessed September 27, 2017). Each LEA family is represented by a specific color (see also supplementary table S1, Supplementary Material online). The red branches in the phylogenetic tree indicate the basal rosid Vitis vinifera, the basal eudicots Beta vulgaris and Nelumbo nucifera, and the basal angiosperm Amborella trichopoda. The red and blue stars on the phylogenetic tree indicate whole-genome duplication (WGD), and whole-genome triplication (WGT), respectively.
<sc>Fig</sc>. 2.
Fig. 2.
—Phylogenetic profile and evolutionary categorization of syntenic LEA genes in the genomes analyzed. (A) Phylogenetic profile showing the number and distribution of syntenic LEA genes in plants. Rows represent synteny communities and columns indicate species. The colors on top of the profile indicate rosids (pink), asterids (blue), monocots (green), basal angiosperm species (red) and Physcomitrella patens and Selaginella moelendorffii (dark gray). The species were ordered from the most recent to the most ancient, from the left to the right. (B) Distribution of syntenic genes in each evolutionary category. AW, angiosperm-wide; MS, monocot-specific; ES, eudicot-specific; SS, species-specific (see also supplementary table S3, Supplementary Material online).
<sc>Fig</sc>. 3.
Fig. 3.
—Characteristics of Dehydrin synteny communities. (A) Maximum likelihood tree of all DHN genes found in the genome of 60 species. The inner circle indicates species belonging to monocots (green), rosids (pink), asterids (blue), basal species (red), the gymnosperm Picea abies (brown), and the bryophyte Physcomitrella patens (light green). The connections between the branches indicate synteny between the gene pairs. Synteny communities 1 and 2 are indicated (blue and pink connections, respectively), dots on the branches represent bootstrap support values (>85). The larger the dots the higher the bootstrap values. (B) Glycine (Gly) content and GRAVY index plot (Gly/GRAVY plot) showing the distribution of hydrophylins (highlighted in red) between community 1 and 2. The arrows indicate a schematic representation of the consensus sequence of proteins of community 1 and 2, respectively. The F-, Y-, S-, and K-protein segments are indicated according to their position in the protein sequences. (C) Expression levels of DHN genes in Arabidopsis thaliana. The expression data were retrieved from the Bio-Array Resource for Arabidopsis Functional Genomics (http://bar.utoronto.ca/) and from Hundertmark and Hincha (2008). The dots on the branches of the phylogenetic tree indicate bootstrap support values (>75). Connections between the rows represent synteny relationships.
<sc>Fig</sc>. 4.
Fig. 4.
—Phylogenetic and synteny characteristics of LEA_1. (A) Phylogenetic profile of LEA_1 indicating the distribution of the synteny communities detected in the species phylogenetic tree. The red and blue stars indicate whole-genome duplication (WGD) and whole-genome triplication (WGT), respectively. (B) Maximum likelihood tree of the LEA_1 family. The circle inside the tree indicates species belonging to monocots (green), rosids (pink), asterids (blue), basal species (red), the gymnosperm Picea abies (brown), the bryophyte Physcomitrella patens (light green), and the lycophyte Selaginella moellendorffii (olive green). The connections between the branches indicate synteny between the gene pairs, and dots on the branches represent bootstrap support values (>85).The larger the dots the higher the bootstrap values. (C) Partial representation of the multiple sequence alignments of amino acid sequences of the communities 1 and 2 (top ten sequences).
<sc>Fig</sc>. 5.
Fig. 5.
—Tandem duplications of the LEA_2 family. (A) Maximum likelihood tree containing all LEA_2 genes identified. The colors displayed in the inner circle indicate genes belonging to monocots (green), rosids (pink), asterids (blue), basal species (red), the gymnosperm Picea abies (brown), the bryophyte Physcomitrella patens (light green), and the lycophyte Selaginella moellendorffii (olive green). The connections between the branches indicate synteny between the gene pairs, and all the communities with at least 100 syntenic genes are displayed in different colors. Synteny communities 1 and 2 are indicated. The dots on the branches indicate bootstrap support values (>85). The larger the dots the higher the bootstrap values. (B) Synteny network of genes belonging to community 1 (circles) and community 2 (triangles). The colors displayed in the nodes represent the clades as indicated in (A). Tandem genes are indicated by a thicker black border. (C) Summary of the number of tandem duplicates in the synteny communities 1 and 2 (see also supplementary table S4, Supplementary Material online). The tree is a simplified version of the species tree presented in figure 1. Red stairs indicate WGD and blue stars indicate WGT.

Similar articles

Cited by

References

    1. Agarwal T. 2017. Different dehydrins perform separate functions in Physcomitrella patens. Planta 245(1):101–118. - PubMed
    1. Amara I, et al. 2014. Insights into late embryogenesis abundant (LEA) proteins in plants: from structure to the functions. Am J Plant Sci. 05(22):3440–3445.
    1. Arsovski AA, Pradinuk J, Guo XQ, Wang S, Adams KL.. 2015. Evolution of cis-regulatory elements and regulatory networks in duplicated genes of Arabidopsis. Plant Physiol. 169(4):2982–2991. - PMC - PubMed
    1. Babu RC, et al. 2004. HVA1, a LEA gene from barley confers dehydration tolerance in transgenic rice (Oryza sativa L.) via cell membrane protection. Plant Sci. 166:855–862.
    1. Banerjee A, Roychoudhury A.. 2016. Group II late embryogenesis abundant (LEA) proteins: structural and functional aspects in plant abiotic stress. Plant Growth Regul. 79(1):1–17.

Publication types

Substances