

MORC2 promotes development of an aggressive colorectal cancer phenotype through inhibition of NDRG1
- PMID: 30407715
- PMCID: PMC6317918
- DOI: 10.1111/cas.13863
MORC2 promotes development of an aggressive colorectal cancer phenotype through inhibition of NDRG1
Abstract
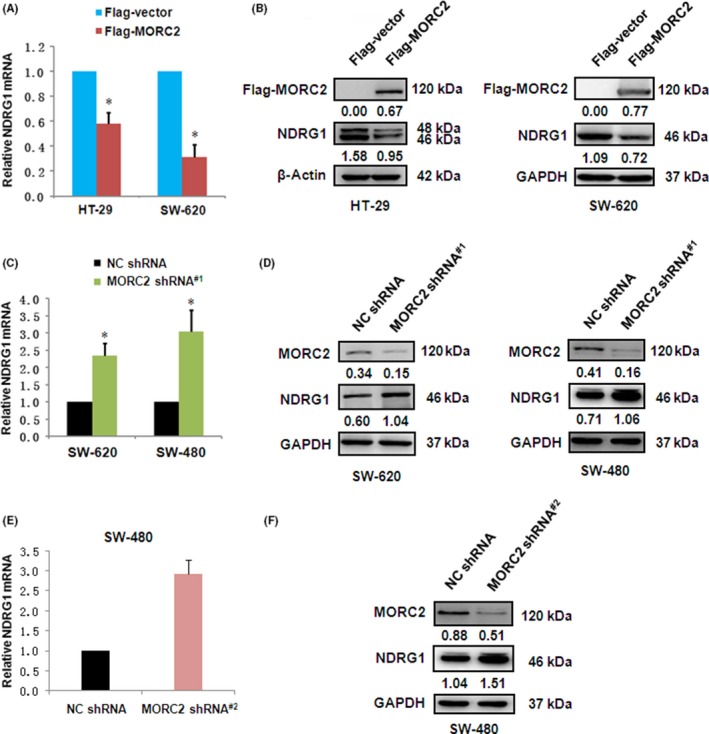
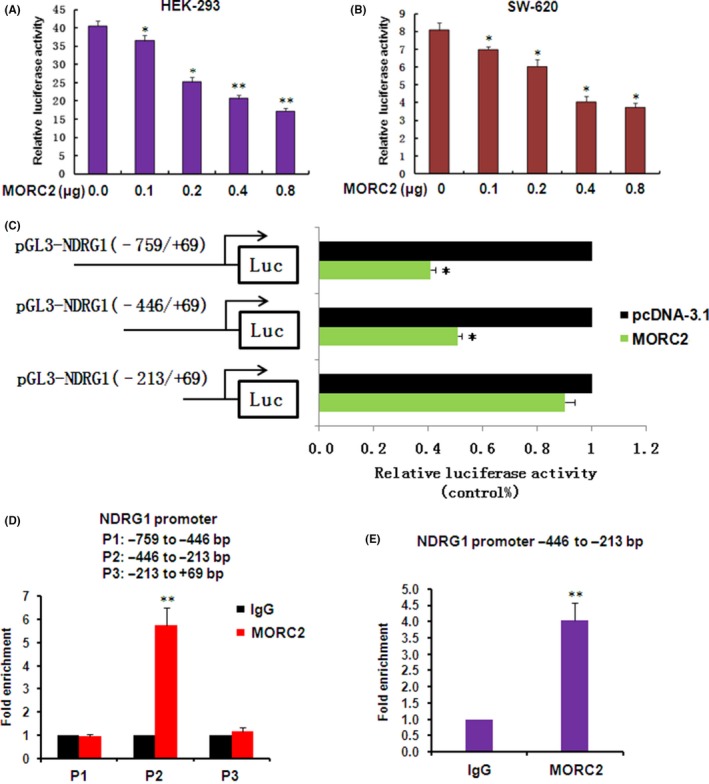
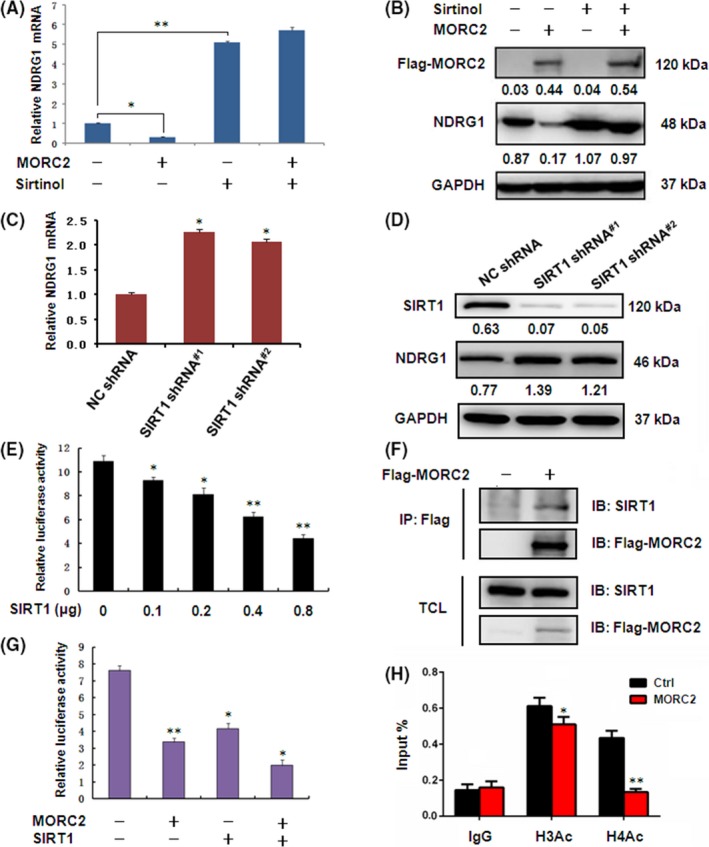
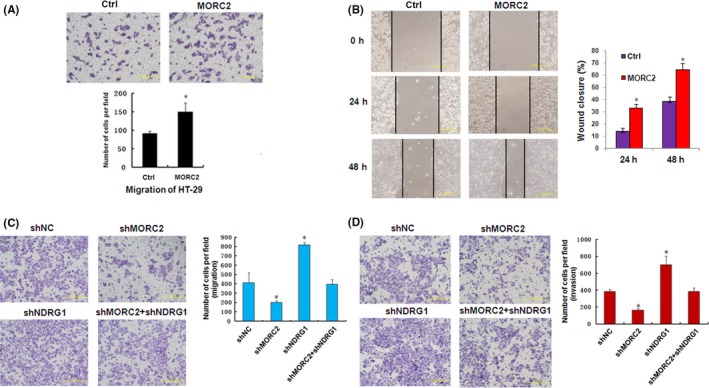
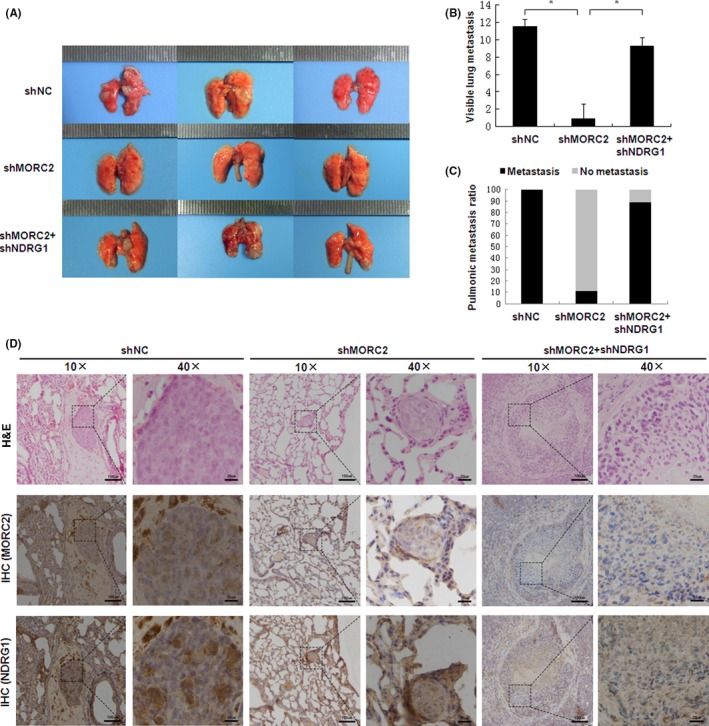
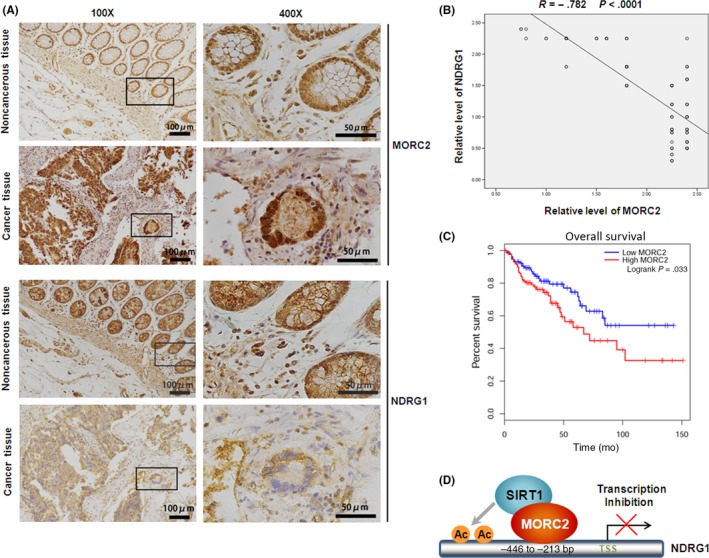
MORC2 (microrchidia family CW-type zinc finger 2) is a newly identified chromatin remodeling protein that functions in diverse biological processes including gene transcription. NDRG1 is a metastasis suppressor and a prognostic biomarker for colorectal cancer (CRC). However, the relationship between MORC2 and NDRG1 transcriptional regulation and the roles of MORC2 in CRC remain elusive. Here, we showed that MORC2 downregulated NDRG1 mRNA, protein levels, and promoter activity in CRC cells. We also found that MORC2 bound to the -446 to -213 bp region of the NDRG1 promoter. Mechanistically, histone deacetylase sirtuin 1 (SIRT1) was involved in NDRG1 transcriptional regulation. MORC2 was able to interact with SIRT1 and inhibit NDRG1 promoter activity cumulatively with SIRT1. MORC2 overexpression led to a decrease of H3Ac and H4Ac of the NDRG1 promoter. Importantly, we showed that NDRG1 was essential in MORC2-mediated promotion of CRC cell migration and invasion in vitro, as well as lung metastasis of CRC cells in vivo. Moreover, MORC2 expression correlated negatively with NDRG1 expression in CRC patients. High expression of MORC2 was significantly associated with lymph node metastasis (P = 0.019) and poor pTNM stage (P = 0.02) and the expression of MORC2 correlated with poor prognosis in colon cancer patients. Our findings thus contribute to the knowledge of the regulatory mechanism of MORC2 in downregulating NDRG1, and suggest MORC2 as a potential therapeutic target for CRC.
Keywords: MORC2; NDRG1; SIRT1; colorectal cancer; transcriptional regulation.
© 2018 The Authors. Cancer Science published by John Wiley & Sons Australia, Ltd on behalf of Japanese Cancer Association.
Figures
Similar articles
-
Microrchidia family CW‑type zinc finger 2 promotes the proliferation, invasion, migration and epithelial‑mesenchymal transition of glioma by regulating PTEN/PI3K/AKT signaling via binding to N‑myc downstream regulated gene 1 promoter.Int J Mol Med. 2022 Feb;49(2):16. doi: 10.3892/ijmm.2021.5071. Epub 2021 Dec 16. Int J Mol Med. 2022. PMID: 34913078 Free PMC article.
-
The metastasis suppressor, NDRG1, inhibits "stemness" of colorectal cancer via down-regulation of nuclear β-catenin and CD44.Oncotarget. 2015 Oct 20;6(32):33893-911. doi: 10.18632/oncotarget.5294. Oncotarget. 2015. PMID: 26418878 Free PMC article.
-
MORC2 regulates RBM39-mediated CDK5RAP2 alternative splicing to promote EMT and metastasis in colon cancer.Cell Death Dis. 2024 Jul 24;15(7):530. doi: 10.1038/s41419-024-06908-y. Cell Death Dis. 2024. PMID: 39048555 Free PMC article.
-
Biological functions and molecular mechanisms of MORC2 in human diseases.Mol Cells. 2025 Jan;48(1):100166. doi: 10.1016/j.mocell.2024.100166. Epub 2024 Dec 3. Mol Cells. 2025. PMID: 39637946 Free PMC article. Review.
-
Pharmacological targeting and the diverse functions of the metastasis suppressor, NDRG1, in cancer.Free Radic Biol Med. 2020 Sep;157:154-175. doi: 10.1016/j.freeradbiomed.2019.05.020. Epub 2019 May 24. Free Radic Biol Med. 2020. PMID: 31132412 Review.
Cited by
-
Inhibition of MORC2 Mediates HDAC4 to Promote Cellular Senescence through p53/p21 Signaling Axis.Molecules. 2022 Sep 22;27(19):6247. doi: 10.3390/molecules27196247. Molecules. 2022. PMID: 36234785 Free PMC article.
-
CD105 expression is associated with invasive capacity in ovarian cancer and promotes invasiveness by inhibiting NDRG1 and regulating the epithelial-mesenchymal transition.Am J Transl Res. 2021 Nov 15;13(11):12461-12479. eCollection 2021. Am J Transl Res. 2021. PMID: 34956466 Free PMC article.
-
Investigating the Effects of HMGB1 Overexpression on Colorectal Cancer Cell Migration via Oncolytic Herpes simplex Virus Type 1 (oHSV-1).Avicenna J Med Biotechnol. 2024 Apr-Jun;16(2):120-129. doi: 10.18502/ajmb.v16i2.14863. Avicenna J Med Biotechnol. 2024. PMID: 38618508 Free PMC article.
-
Comprehensive analysis of the transcriptome-wide m6A methylome in colorectal cancer by MeRIP sequencing.Epigenetics. 2021 Apr;16(4):425-435. doi: 10.1080/15592294.2020.1805684. Epub 2020 Aug 12. Epigenetics. 2021. PMID: 32749190 Free PMC article.
-
Oncogenic MORC2 in cancer development and beyond.Genes Dis. 2023 Jul 3;11(2):861-873. doi: 10.1016/j.gendis.2023.05.010. eCollection 2024 Mar. Genes Dis. 2023. PMID: 37692502 Free PMC article. Review.
References
MeSH terms
Substances
Grants and funding
LinkOut - more resources
Full Text Sources
Medical
