

Biofilm-induced profiles of immune response gene expression by oral epithelial cells
- PMID: 30407731
- PMCID: PMC6335182
- DOI: 10.1111/omi.12251
Biofilm-induced profiles of immune response gene expression by oral epithelial cells
Abstract
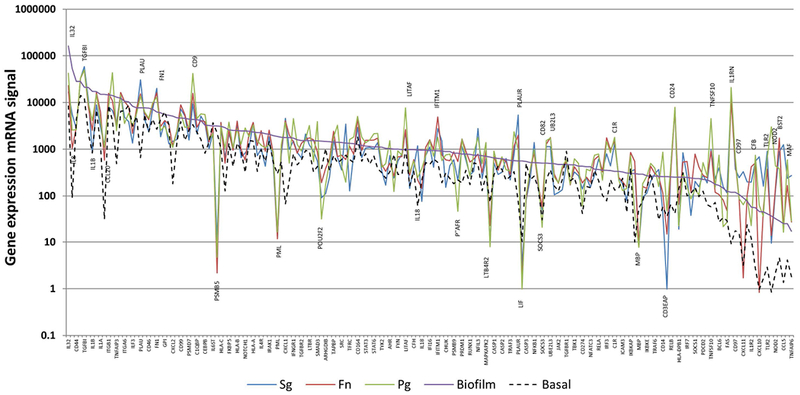
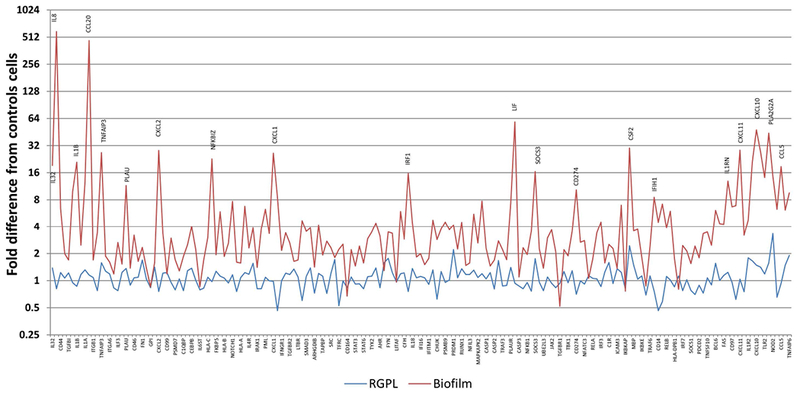
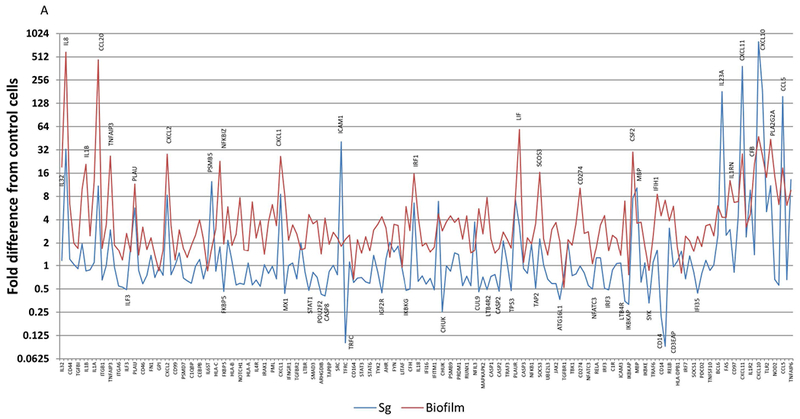
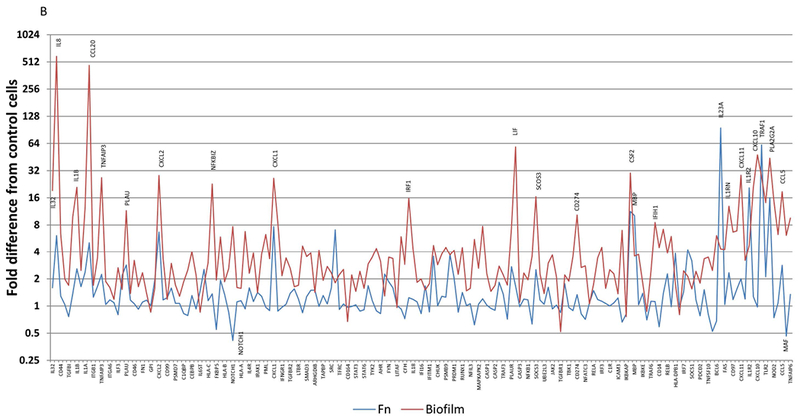
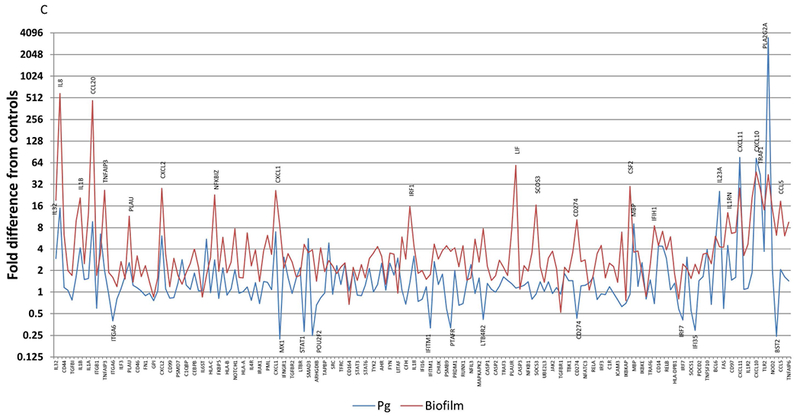
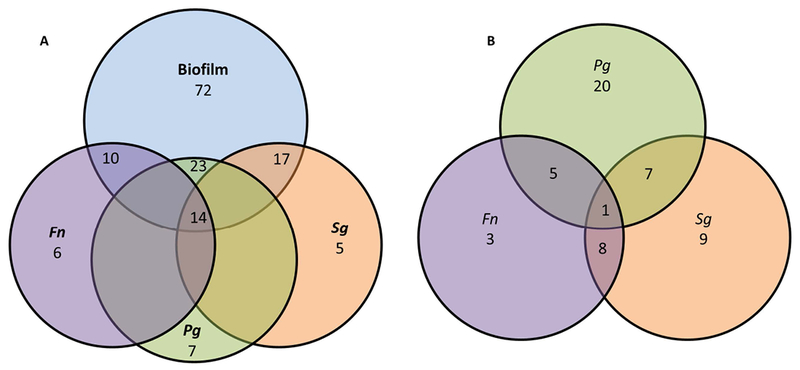
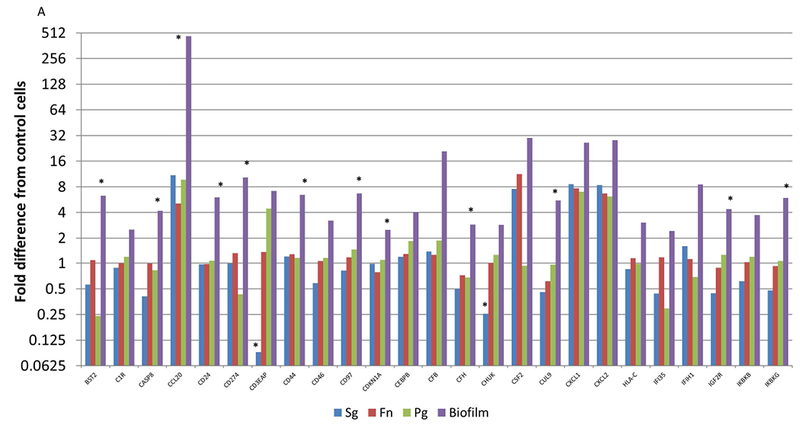
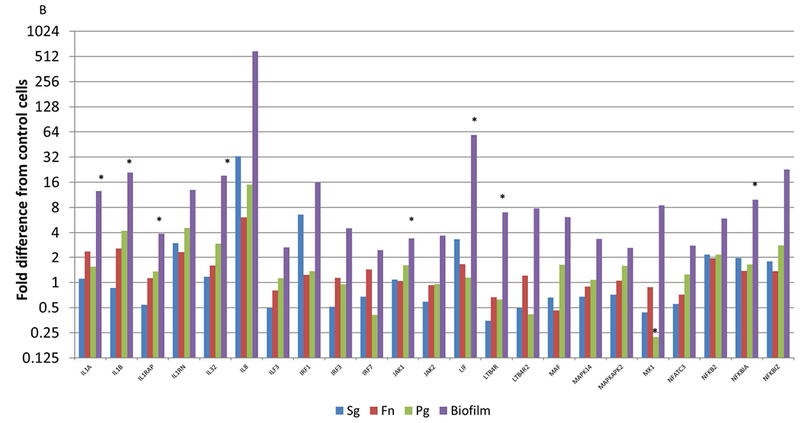
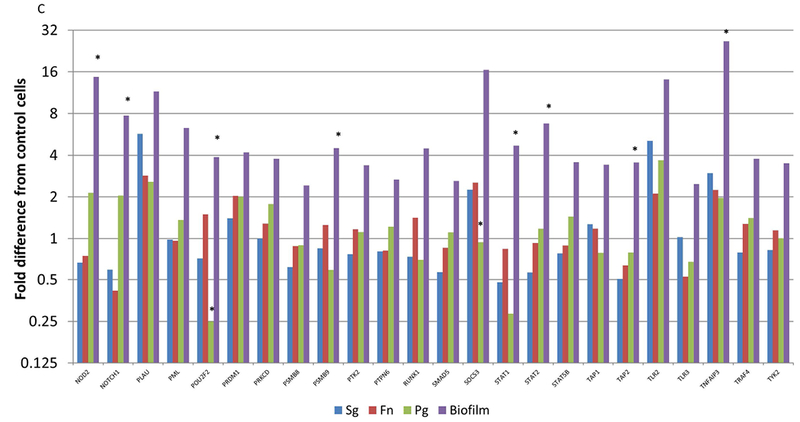
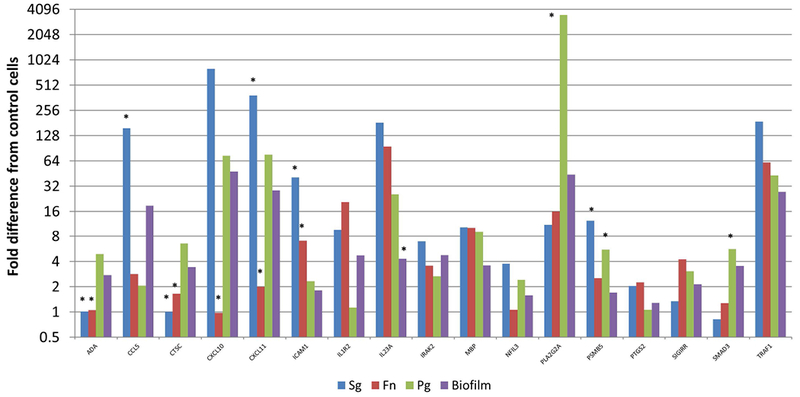
This study examined the oral epithelial immunotranscriptome response patterns modulated by oral bacterial planktonic or biofilm challenge. We assessed gene expression patterns when epithelial cells were challenged with a multispecies biofilm composed of Streptococcus gordonii, Fusobacterium nucleatum, and Porphyromonas gingivalis representing a type of periodontopathic biofilm compared to challenge with the same species of planktonic bacteria. Of the 579 human immunology genes, a substantial signal of the epithelial cells was observed to 181 genes. Biofilm challenged stimulated significant elevations compared to planktonic bacteria for IL32, IL8, CD44, B2M, TGFBI, NFKBIA, IL1B, CD59, IL1A, CCL20 representing the top 10 signals comprising 55% of the overall signal for the epithelial cell responses. Levels of PLAU, CD9, IFITM1, PLAUR, CD24, TNFSF10, and IL1RN were all elevated by each of the planktonic bacterial challenge vs the biofilm responses. While the biofilms up-regulated 123/579 genes (>2-fold), fewer genes were increased by the planktonic species (36 [S gordonii], 30 [F nucleatum], 44 [P gingivalis]). A wide array of immune genes were regulated by oral bacterial challenge of epithelial cells that would be linked to the local activity of innate and adaptive immune response components in the gingival tissues. Incorporating bacterial species into a structured biofilm dramatically altered the number and level of genes expressed. Additionally, a specific set of genes were significantly decreased with the multispecies biofilms suggesting that some epithelial cell biologic pathways are down-regulated when in contact with this type of pathogenic biofilm.
© 2018 John Wiley & Sons A/S. Published by John Wiley & Sons Ltd.
Figures
Similar articles
-
Environmental lead effects on gene expression in oral epithelial cells.J Periodontal Res. 2018 Dec;53(6):961-971. doi: 10.1111/jre.12594. Epub 2018 Aug 26. J Periodontal Res. 2018. PMID: 30152021
-
Differential regulation of cytokine genes in gingival epithelial cells challenged by Fusobacterium nucleatum and Porphyromonas gingivalis.Microb Pathog. 2004 Dec;37(6):303-12. doi: 10.1016/j.micpath.2004.10.003. Epub 2004 Dec 8. Microb Pathog. 2004. PMID: 15619426
-
Label-free quantitative proteomic analysis of the oral bacteria Fusobacterium nucleatum and Porphyromonas gingivalis to identify protein features relevant in biofilm formation.Anaerobe. 2021 Dec;72:102449. doi: 10.1016/j.anaerobe.2021.102449. Epub 2021 Sep 17. Anaerobe. 2021. PMID: 34543761
-
Halitosis vaccines targeting FomA, a biofilm-bridging protein of fusobacteria nucleatum.Curr Mol Med. 2013 Sep;13(8):1358-67. doi: 10.2174/15665240113139990063. Curr Mol Med. 2013. PMID: 23865430 Review.
-
Biofilm Models to Study the Etiology and Pathogenesis of Oral Diseases.Monogr Oral Sci. 2021;29:30-37. doi: 10.1159/000510197. Epub 2020 Dec 21. Monogr Oral Sci. 2021. PMID: 33427216 Review.
Cited by
-
The dental plaque biofilm matrix.Periodontol 2000. 2021 Jun;86(1):32-56. doi: 10.1111/prd.12361. Epub 2021 Mar 10. Periodontol 2000. 2021. PMID: 33690911 Free PMC article. Review.
-
Two CD9 tetraspanin family members of Japanese flounder (Paralichthys olivaceus): characterization and comparative analysis of the anti-infectious immune function.Vet Res. 2021 Feb 17;52(1):28. doi: 10.1186/s13567-021-00903-3. Vet Res. 2021. PMID: 33597018 Free PMC article.
-
Long Term Delta-9-tetrahydrocannabinol Administration Inhibits Proinflammatory Responses in Minor Salivary Glands of Chronically Simian Immunodeficieny Virus Infected Rhesus Macaques.Viruses. 2020 Jul 1;12(7):713. doi: 10.3390/v12070713. Viruses. 2020. PMID: 32630206 Free PMC article.
-
Role of Porphyromonas gingivalis in oral and orodigestive squamous cell carcinoma.Periodontol 2000. 2022 Jun;89(1):154-165. doi: 10.1111/prd.12425. Epub 2022 Mar 4. Periodontol 2000. 2022. PMID: 35244980 Free PMC article. Review.
-
E-Cigarette Aerosol Exposure Favors the Growth and Colonization of Oral Streptococcus mutans Compared to Commensal Streptococci.Microbiol Spectr. 2022 Apr 27;10(2):e0242121. doi: 10.1128/spectrum.02421-21. Epub 2022 Apr 4. Microbiol Spectr. 2022. PMID: 35377225 Free PMC article.
References
-
- Partida-Rodriguez O, Serrano-Vazquez A, Nieves-Ramirez ME, et al. Human Intestinal Microbiota: Interaction Between Parasites and the Host Immune Response. Arch Med Res. 2017;48(8):690–700. - PubMed
-
- Ahluwalia B, Magnusson MK, Ohman L. Mucosal immune system of the gastrointestinal tract: maintaining balance between the good and the bad. Scand J Gastroenterol. 2017;52(11):1185–1193. - PubMed
Publication types
MeSH terms
Substances
Grants and funding
LinkOut - more resources
Full Text Sources
Molecular Biology Databases
Research Materials
Miscellaneous
