Comparative Study
. 2018 Nov 8;14(11):e1006483.
doi: 10.1371/journal.pcbi.1006483. eCollection 2018 Nov.

A benchmark driven guide to binding site comparison: An exhaustive evaluation using tailor-made data sets (ProSPECCTs)

Affiliations
Comparative Study

A benchmark driven guide to binding site comparison: An exhaustive evaluation using tailor-made data sets (ProSPECCTs)

Christiane Ehrt et al. PLoS Comput Biol. .

Abstract

The automated comparison of protein-ligand binding sites provides useful insights into yet unexplored site similarities. Various stages of computational and chemical biology research can benefit from this knowledge. The search for putative off-targets and the establishment of polypharmacological effects by comparing binding sites led to promising results for numerous projects. Although many cavity comparison methods are available, a comprehensive analysis to guide the choice of a tool for a specific application is wanting. Moreover, the broad variety of binding site modeling approaches, comparison algorithms, and scoring metrics impedes this choice. Herein, we aim to elucidate strengths and weaknesses of binding site comparison methodologies. A detailed benchmark study is the only possibility to rationalize the selection of appropriate tools for different scenarios. Specific evaluation data sets were developed to shed light on multiple aspects of binding site comparison. An assembly of all applied benchmark sets (ProSPECCTs-Protein Site Pairs for the Evaluation of Cavity Comparison Tools) is made available for the evaluation and optimization of further and still emerging methods. The results indicate the importance of such analyses to facilitate the choice of a methodology that complies with the requirements of a specific scientific challenge.


Conflict of interest statement

The authors have declared that no competing interests exist.

Figures

Fig 1
Fig 1. Binding site modeling approaches for different comparison algorithms.
The binding site of coagulation factor Xa (PDB ID 1f0r, chain A) bound to the nanomolar inhibitor RPR208815 is shown together with a schematic representation of the ways in which binding site features are modeled. The methodologies are connected with the corresponding underlying data structures used for the comparison. Binding site visualizations were generated using UCSF Chimera[60].
Fig 2
Fig 2. Evaluation of different binding site comparison tools with respect to the data set of structures with identical sequences.
A-C) The ROC curves for residue- (A), surface- (B), and interaction-based (C) comparison methods. The name of the tool is colored according to its corresponding ROC curve. The binding site comparison tools are sorted in descending order with respect to the AUC. Thin lines represent the resulting ROC curve for the scoring scheme that yielded the highest AUC. (A) A slightly higher AUC for SiteAlign was obtained if distance d2 was applied for binding site pair ranking. (B) For the surface-based methods, the Tanimoto (color) for Shaper or VolSite/Shaper and the ColorTanimoto for SiteHopper led to the highest AUC. (C) The use of the Tanimoto coefficient as similarity measure led to the highest AUC for TIFP(PDB). D-F) EFs for residue- (D), surface- (E), and interaction-based (F) comparison methods. A linear color gradient ranging from white for the highest value to gray to black for the lowest value was applied for the EFs at different percentages of screened data set.
Fig 3
Fig 3
Changes in the molecular interaction patterns of dihydrofolate reductase ligands and changes in the binding site upon ligand binding (PDB ID 1ohk, chain A (A and D); PDB ID 4kd7, chain A (B and E); PDB ID 1drf, chain A (C and F)). A-C) Representation of the binding site structures. Figures were generated using UCSF Chimera[60]. D-F) Schematic view of the crucial interactions between protein and ligand. Figures were generated using LigPlot+[69].
Fig 4
Fig 4. Evaluation of different binding site comparison tools with respect to the data set of NMR structures.
A-C) The ROC curves for residue- (A), surface- (B), and interaction-based (C) comparison methods. The name of the tool is colored according to its corresponding ROC curve. The binding site comparison tools are sorted in descending order with respect to the AUC. (A) The highest AUC was obtained for SiteAlign when using distance d1. (B) All Shaper comparisons led to higher AUCs for the scoring measure Tanimoto (color). SiteEngine results slightly improved the AUC for the distance scoring scheme. D-F) EFs for residue- (D), surface- (E), and interaction-based (F) comparison methods. A linear color gradient ranging from white for the highest value to gray to black for the lowest value was applied for the EFs at different percentages of screened data set.
Fig 5
Fig 5. Different interaction patterns for structures from the solution NMR ensemble of ileal lipid-binding protein (PDB ID 1eio, chain A).
The ensemble contains five conformers in total. Models 1, 3, and 4 (from left to right) were used to generate this illustration. Residues with alternating interaction patterns in the different conformations are highlighted and occupy nearly half of the pocket. The remaining part of the pocket is mainly engaged in hydrophobic contacts and three hydrogen bond interactions with the small molecule glycocholate. The figure was generated using LigPlot+[69].
Fig 6
Fig 6. Evaluation of different binding site comparison tools with respect to data set 3 (five substitutions by physicochemically different residues).
A-C) The ROC curves for residue- (A), surface- (B), and interaction-based (C) comparison methods. The name of the tool is colored according to its corresponding ROC curve. The binding site comparison tools are sorted in descending order with respect to their AUC. (A) PocketMatch showed the best AUC for the score PMScoremin (thin orange line). (B) The scores SVA, RefTversky (color), RefTversky (color), RefTversky (color), RefTversky (color), and ColorTanimoto led to the highest AUC values for ProBiS, Shaper, Shaper(PDB), VolSite/Shaper, VolSite/Shaper(PDB), and SiteHopper, respectively (thin lines). (C) The highest AUC was obtained for IsoMIF and TIFP(PDB) when using taniM and the Tanimoto coefficient as similarity measure (thin lines). D-F) EFs for residue- (D), surface- (E), and interaction-based (F) comparison methods. A linear color gradient ranging from white for the highest value to gray to black for the lowest value was applied for the EFs at different percentages of screened data set.
Fig 7
Fig 7. Evaluation of different binding site comparison tools with respect to the data set of rational decoy structures (five mutations).
A-C) The ROC curves for residue- (A), surface- (B), and interaction-based (C) comparison methods. The name of the tool is colored according to its corresponding ROC curve. The binding site comparison tools are sorted in descending order with respect to their AUC. (A) PocketMatch showed the best AUC for the score PMScoremin (thin orange line). (B) The scores SVA, Tanimoto (color), Tanimoto (color), RefTversky (color), RefTversky (color), and ColorTanimoto led to the highest AUC values for ProBiS, Shaper, Shaper(PDB), VolSite/Shaper, VolSite/Shaper(PDB), and SiteHopper, respectively (thin lines). (C) The highest AUC was obtained for TIFP(PDB) when using the Tanimoto coefficient as scoring measure (thin dark green line). D-F) EFs for residue- (D), surface- (E), and interaction-based (F) comparison methods. A linear color gradient ranging from white for the highest value to gray to black for the lowest value was applied for the EFs at different percentages of screened data set.
Fig 8
Fig 8. Evaluation of different binding site comparison tools with respect to the data set of Kahraman structures [63] after the exclusion of phosphate binding sites.
A-C) The ROC curves for residue- (A), surface- (B), and interaction-based (C) comparison methods. The name of the tool is colored according to its corresponding ROC curve. The binding site comparison tools are sorted in descending order with respect to the AUC. (A) The best AUC for SiteAlign resulted from the d1 distance (thin red line). (B) For ProBiS, VolSite/Shaper, SiteEngine, and SiteHopper the scores SVA, Tanimoto (color), TotalScore, and ShapeTanimoto yielded the best AUC values (thin lines). (C) For TIFP(PDB), the use of the Hamming distance led to the best results with respect to AUC (thin line). D-F) EFs for residue- (D), surface- (E), and interaction-based (F) comparison methods. A linear color gradient ranging from white for the highest value to gray to black for the lowest value was applied for the EFs at different percentages of screened data set.
Fig 9
Fig 9. Similarity score matrices for the Kahraman data set generated from the SiteHopper (left) and IsoMIF (right) results.
Both methods are able to find clusters of binding sites with identical ligands. The combination of both methods might even give rise to an improved differentiation. Similarity scores (tani) above 0.4 are colored green for the matrix obtained with IsoMIF. Similarity scores (PatchScore) above 0.65 are colored green for all SiteHopper-derived site alignments.
Fig 10
Fig 10. Evaluation of different binding site comparison tools with respect to the data set of Barelier et al.[64].
A-C) The ROC curves for residue- (A), surface- (B), and interaction-based (C) comparison methods. The name of the tool is colored according to its corresponding ROC curve. The binding site comparison tools are sorted in descending order with respect to the AUC. (A) The thin red line represents the resulting ROC curve for SiteAlign when using the distance d1. (B) Thin lines represent the ROC curves for ProBiS, Shaper, Shaper(PDB), VolSite/Shaper, VolSite/Shaper(PDB), SiteEngine and SiteHopper when using the scoring schemes SVA, FitTversky (color), FitTversky (color), RefTversky (color), Tanimoto (fit), distance, and ShapeTanimoto, respectively. (C) The thin line represents the resulting ROC curve for IsoMIF and the taniMW score. D-F) EFs for residue- (D), surface- (E), and interaction-based (F) comparison methods. A linear color gradient ranging from white for the highest value to gray to black for the lowest value was applied for the EFs at different percentages of screened data set.
Fig 11
Fig 11
Alignments of high-scoring binding site pairs of the Barelier data set generated by (A) Cavbase, (B) TM-align, (C) SMAP, and (D) Shaper. (A) Superposition of angiotensin-converting enzyme (PDB ID 2x8z, green) and leukotriene A4 hydrolase (PDB ID 4dpr, purple) in complex with captopril (ball-and-sticks representation). Red spheres denote hydrogen bond acceptor features while purple spheres represent mixed hydrogen bond acceptor/donor features. Metal coordination sites are marked by orange spheres and blue and yellow spheres denote residues with aromatic and aliphatic characteristics, respectively. The Cavbase similarity score for this match is 11.37. (B) Alignment of leukotriene A4 hydrolase (PDB ID 3fty, green) and mitogen-activated protein kinase 14 (PDB ID 1w7h, purple) crystallized with the small molecule fragment 3-(benzyloxy)-pyridine-2-amine (3IP, ball-and-sticks-representation). Residues within a 4 Å radius of any ligand atom are depicted in stick representation. This alignment yields a TM-score of 0.32. (C) Superposition of adipocyte lipid-binding protein (PDB ID 2ans, green) and pheromone-binding protein (PDB ID 1ow4, purple) in complex with the fluorescent probe 8-anilino-1-naphthalene sulfonate (2AN, ball-and-sticks). The residues shown in stick representation represent only a fraction of all matched residues. The SMAP RawScore for this site pair is 63.44. (D) Shaper-based alignment of the neocarzinostatin (PDB ID 2g0l, green) and tankyrase-2 (PDB ID 4hki, purple) flavone (FLN, ball-and-sticks) binding sites (TanimotoCombo = 0.92). Residues within a 4 Å radius of the ligand are represented as sticks. Hydrogen bond interactions are depicted as green springs.
Fig 12
Fig 12
Results of a binding site feature analysis for the class A, B, and C pairs of Barelier et al.[64] and a sequence-culled subset of druggable binding sites. The relative frequencies of the binned properties are presented in light gray for class A structures, in dark gray for structures belonging to class B and C pairs, and in black for the sequence-culled sc-PDB[65] subset. The binding site features were calculated using DoGSite[73].
Fig 13
Fig 13. Evaluation of different binding site comparison tools with respect to the data set of successful applications.
A-C) The ROC curves for residue- (A), surface- (B), and interaction-based (C) comparison methods. The name of the tool is colored according to its corresponding ROC curve. The binding site comparison tools are sorted in descending order with respect to the AUC. (A) SiteAlign yielded a slightly better AUC if the distance d1 was used (thin line). (B) The best AUC values for ProBis, Shaper, Shaper(PDB), VolSite/Shaper, VolSite/Shaper(PDB), SiteEngine, and SiteHopper resulted from the scoring measures Zscore, Tanimoto (color), Tanimoto (color), Tanimoto (color), Tanimoto (color), TotalScore, and ShapeTanimoto, respectively (thin lines). D-F) EFs for residue- (D), surface- (E), and interaction-based (F) comparison methods. A linear color gradient ranging from white for the highest value to gray to black for the lowest value was applied for the EFs at different percentages of screened data set.
Fig 14
Fig 14. Binding site alignments for similar cavity pairs which most tools failed to identify.
(A) Alignment of human carbonic anhydrase II (PDB ID 1bn4, green) and cyclooxygenase-2 (PDB ID 6cox, purple) as obtained with IsoMIF. (B) The binding sites of synapsin (PDB ID 1aux, green) and PIM-1 kinase (PDB ID 3a99, purple) as aligned by SiteEngine. All illustrations were generated using UCSF Chimera[60].
Fig 15
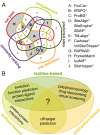
Fig 15. Guiding the choice of appropriate binding site comparison tools.
(A) Venn diagram illustrating differences in the strengths of the comparison methods based on a subset of quality criteria. An asterisk marks methods which provide a binding site alignment for a visualisation of site similarities. (B) Venn diagram of successful applications of the evaluated residue-, surface-, and interaction-based tools in different research scenarios. Both diagrams were generated using DrawVenn[100].

Similar articles

Cited by

References

    1. Berman HM. The Protein Data Bank. Nucleic Acids Res. 2000;28(1):235–42. 10.1093/nar/28.1.235 - DOI - PMC - PubMed
    1. Volkamer A, Rarey M. Exploiting structural information for drug-target assessment. Future Med Chem. 2014;6(3):319–31. 10.4155/fmc.14.3 . - DOI - PubMed
    1. Haupt VJ, Schroeder M. Old friends in new guise: repositioning of known drugs with structural bioinformatics. Brief Bioinformatics. 2011;12(4):312–26. 10.1093/bib/bbr011 . - DOI - PubMed
    1. Konc J, Janežič D. Binding site comparison for function prediction and pharmaceutical discovery. Curr Opin Struct Biol. 2014;25:34–9. 10.1016/j.sbi.2013.11.012 . - DOI - PubMed
    1. Ehrt C, Brinkjost T, Koch O. Impact of binding site comparisons on medicinal chemistry and rational molecular design. J Med Chem. 2016;59(9):4121–51. 10.1021/acs.jmedchem.6b00078 . - DOI - PubMed

Publication types