

Systematically benchmarking peptide-MHC binding predictors: From synthetic to naturally processed epitopes
- PMID: 30408041
- PMCID: PMC6224037
- DOI: 10.1371/journal.pcbi.1006457
Systematically benchmarking peptide-MHC binding predictors: From synthetic to naturally processed epitopes
Abstract
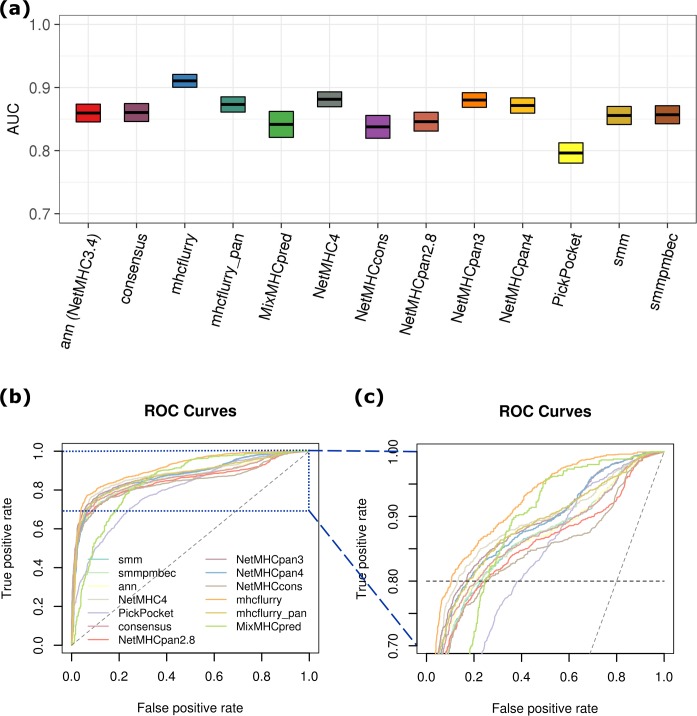
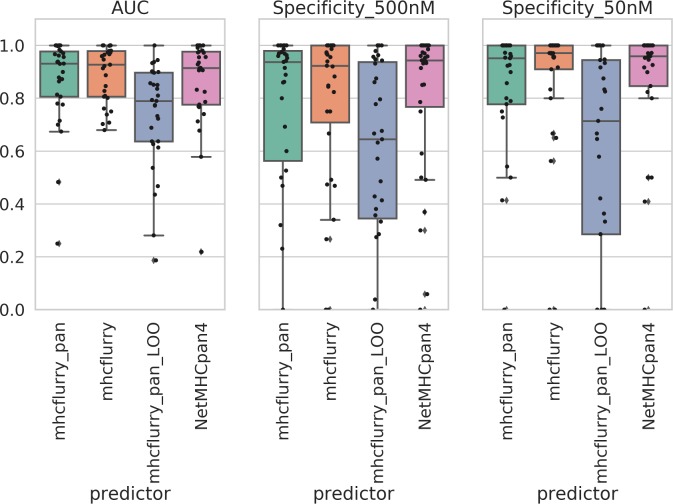
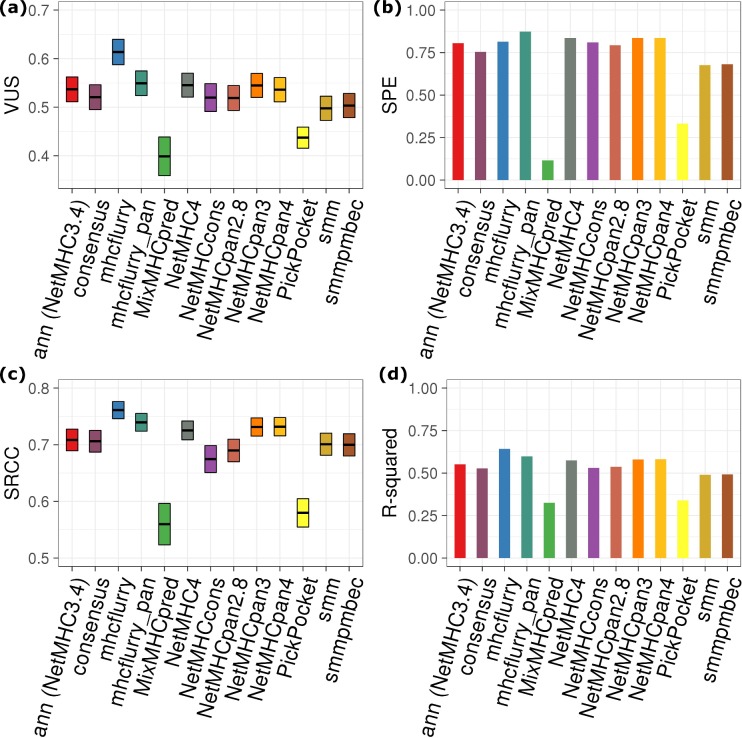
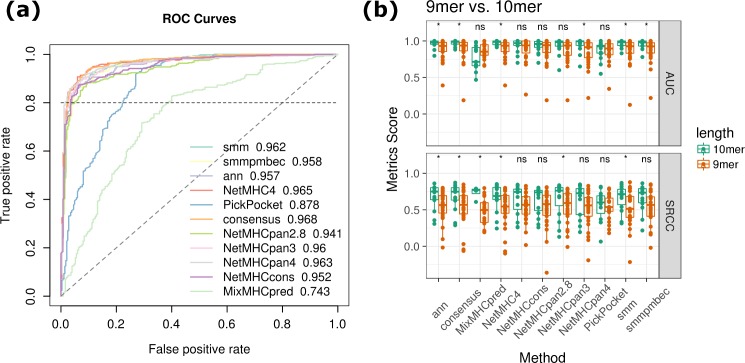
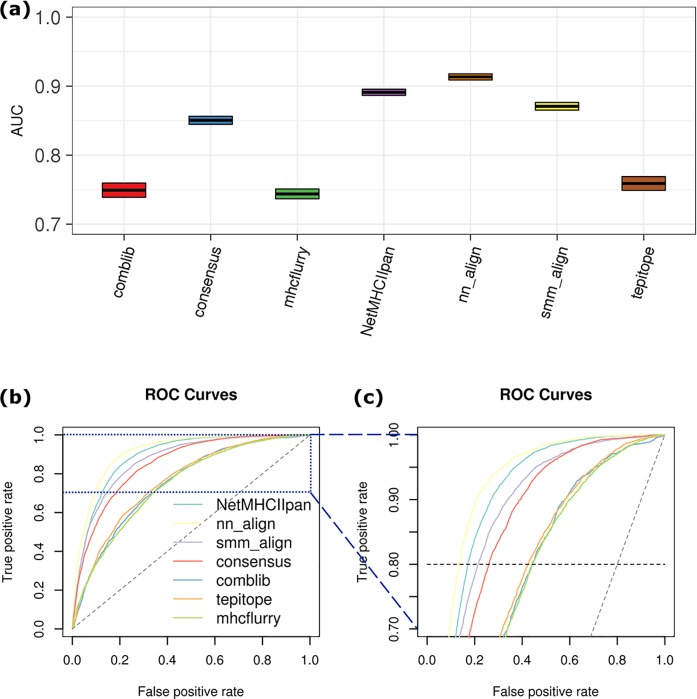
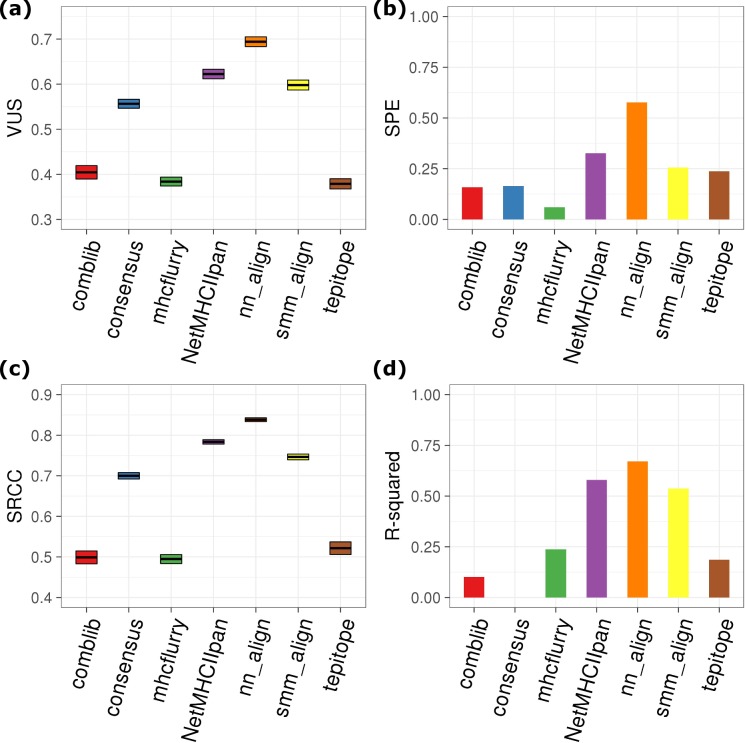
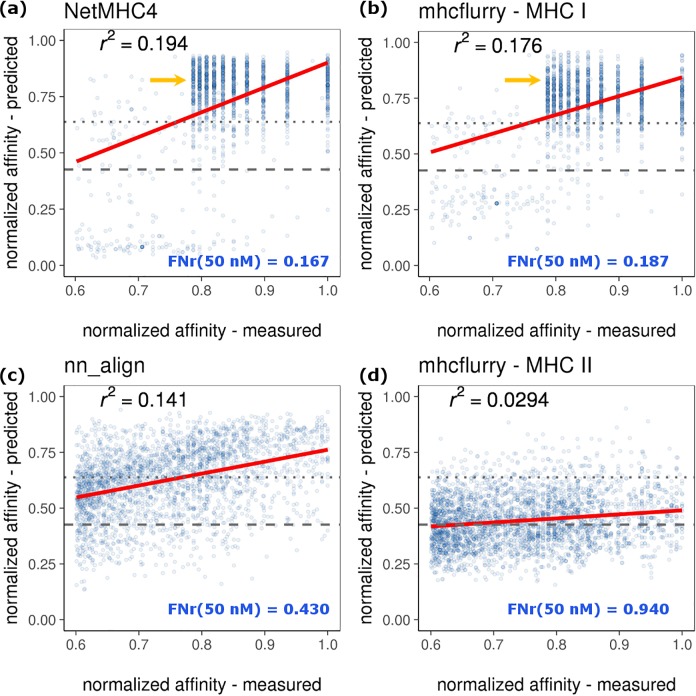
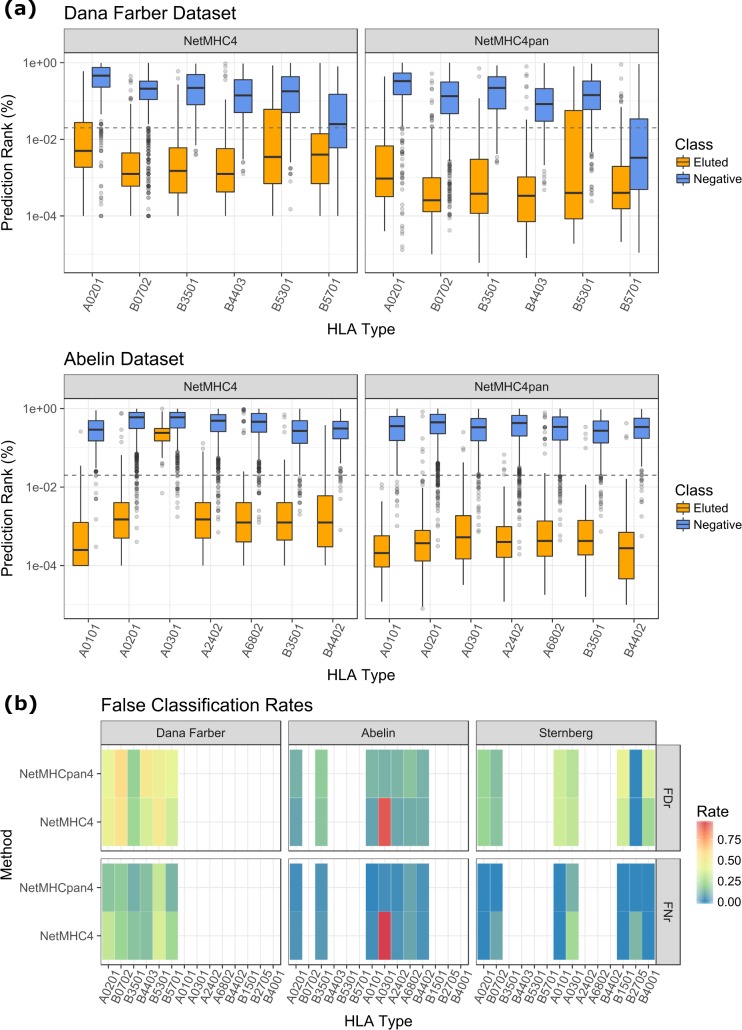
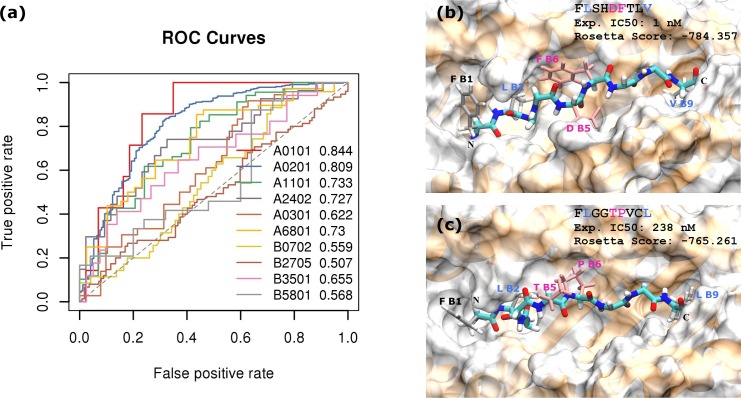
A number of machine learning-based predictors have been developed for identifying immunogenic T-cell epitopes based on major histocompatibility complex (MHC) class I and II binding affinities. Rationally selecting the most appropriate tool has been complicated by the evolving training data and machine learning methods. Despite the recent advances made in generating high-quality MHC-eluted, naturally processed ligandome, the reliability of new predictors on these epitopes has yet to be evaluated. This study reports the latest benchmarking on an extensive set of MHC-binding predictors by using newly available, untested data of both synthetic and naturally processed epitopes. 32 human leukocyte antigen (HLA) class I and 24 HLA class II alleles are included in the blind test set. Artificial neural network (ANN)-based approaches demonstrated better performance than regression-based machine learning and structural modeling. Among the 18 predictors benchmarked, ANN-based mhcflurry and nn_align perform the best for MHC class I 9-mer and class II 15-mer predictions, respectively, on binding/non-binding classification (Area Under Curves = 0.911). NetMHCpan4 also demonstrated comparable predictive power. Our customization of mhcflurry to a pan-HLA predictor has achieved similar accuracy to NetMHCpan. The overall accuracy of these methods are comparable between 9-mer and 10-mer testing data. However, the top methods deliver low correlations between the predicted versus the experimental affinities for strong MHC binders. When used on naturally processed MHC-ligands, tools that have been trained on elution data (NetMHCpan4 and MixMHCpred) shows better accuracy than pure binding affinity predictor. The variability of false prediction rate is considerable among HLA types and datasets. Finally, structure-based predictor of Rosetta FlexPepDock is less optimal compared to the machine learning approaches. With our benchmarking of MHC-binding and MHC-elution predictors using a comprehensive metrics, a unbiased view for establishing best practice of T-cell epitope predictions is presented, facilitating future development of methods in immunogenomics.
Conflict of interest statement
All authors are employed by Merck Co. & Inc.
Figures
Similar articles
-
Benchmarking predictions of MHC class I restricted T cell epitopes in a comprehensively studied model system.PLoS Comput Biol. 2020 May 26;16(5):e1007757. doi: 10.1371/journal.pcbi.1007757. eCollection 2020 May. PLoS Comput Biol. 2020. PMID: 32453790 Free PMC article.
-
Determination of a Predictive Cleavage Motif for Eluted Major Histocompatibility Complex Class II Ligands.Front Immunol. 2018 Aug 6;9:1795. doi: 10.3389/fimmu.2018.01795. eCollection 2018. Front Immunol. 2018. PMID: 30127785 Free PMC article.
-
Development and validation of an epitope prediction tool for swine (PigMatrix) based on the pocket profile method.BMC Bioinformatics. 2015 Sep 15;16:290. doi: 10.1186/s12859-015-0724-8. BMC Bioinformatics. 2015. PMID: 26370412 Free PMC article.
-
A comprehensive review and performance evaluation of bioinformatics tools for HLA class I peptide-binding prediction.Brief Bioinform. 2020 Jul 15;21(4):1119-1135. doi: 10.1093/bib/bbz051. Brief Bioinform. 2020. PMID: 31204427 Free PMC article. Review.
-
Peptide binding motifs for MHC class I and II molecules.Curr Protoc Immunol. 2001 May;Appendix 1:Appendix 1I. doi: 10.1002/0471142735.ima01is36. Curr Protoc Immunol. 2001. PMID: 18432645 Review.
Cited by
-
Ranking-Based Convolutional Neural Network Models for Peptide-MHC Class I Binding Prediction.Front Mol Biosci. 2021 May 17;8:634836. doi: 10.3389/fmolb.2021.634836. eCollection 2021. Front Mol Biosci. 2021. PMID: 34079815 Free PMC article.
-
Immunogenic SARS-CoV-2 Epitopes: In Silico Study Towards Better Understanding of COVID-19 Disease-Paving the Way for Vaccine Development.Vaccines (Basel). 2020 Jul 23;8(3):408. doi: 10.3390/vaccines8030408. Vaccines (Basel). 2020. PMID: 32717854 Free PMC article.
-
Establishment of a novel tumor neoantigen prediction tool for personalized vaccine design.Hum Vaccin Immunother. 2024 Dec 31;20(1):2300881. doi: 10.1080/21645515.2023.2300881. Epub 2024 Jan 12. Hum Vaccin Immunother. 2024. PMID: 38214336 Free PMC article.
-
A Universal Antigen-Ranking Method to Design Personalized Vaccines Targeting Neoantigens against Melanoma.Life (Basel). 2023 Jan 5;13(1):155. doi: 10.3390/life13010155. Life (Basel). 2023. PMID: 36676104 Free PMC article.
-
Relationship between HLA-DPA1 genetic polymorphism and anembryonic pregnancy.Mol Genet Genomic Med. 2020 Jan;8(1):e1046. doi: 10.1002/mgg3.1046. Epub 2019 Nov 30. Mol Genet Genomic Med. 2020. PMID: 31785132 Free PMC article.
References
-
- Tang H, Tsarevsky N V. Preparation and functionalization of linear and reductively degradable highly branched cyanoacrylate-based polymers. J Polym Sci Part A Polym Chem. 2016. December 1;54(23):3683–93.
Publication types
MeSH terms
Substances
LinkOut - more resources
Full Text Sources
Other Literature Sources
Research Materials
Miscellaneous
