

Analysis of healthcare service utilization after transport-related injuries by a mixture of hidden Markov models
- PMID: 30408046
- PMCID: PMC6224052
- DOI: 10.1371/journal.pone.0206274
Analysis of healthcare service utilization after transport-related injuries by a mixture of hidden Markov models
Erratum in
-
Correction: Analysis of healthcare service utilization after transport-related injuries by a mixture of hidden Markov models.PLoS One. 2019 Apr 1;14(4):e0214973. doi: 10.1371/journal.pone.0214973. eCollection 2019. PLoS One. 2019. PMID: 30934023 Free PMC article.
Abstract
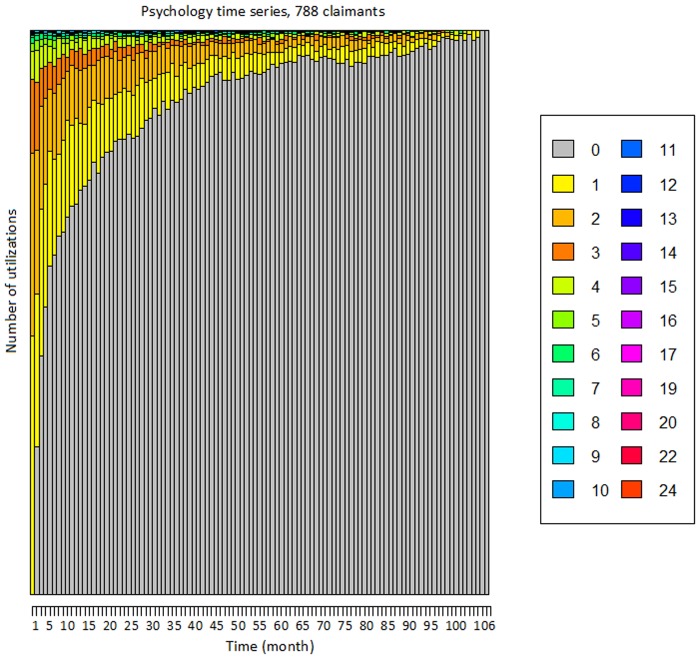
Background: Transport injuries commonly result in significant disease burden, leading to physical disability, mental health deterioration and reduced quality of life. Analyzing the patterns of healthcare service utilization after transport injuries can provide an insight into the health of the affected parties, allow improved health system resource planning, and provide a baseline against which any future system-level interventions can be evaluated. Therefore, this research aims to use time series of service utilization provided by a compensation agency to identify groups of claimants with similar utilization patterns, describe such patterns, and characterize the groups in terms of demographic, accident type and injury type.
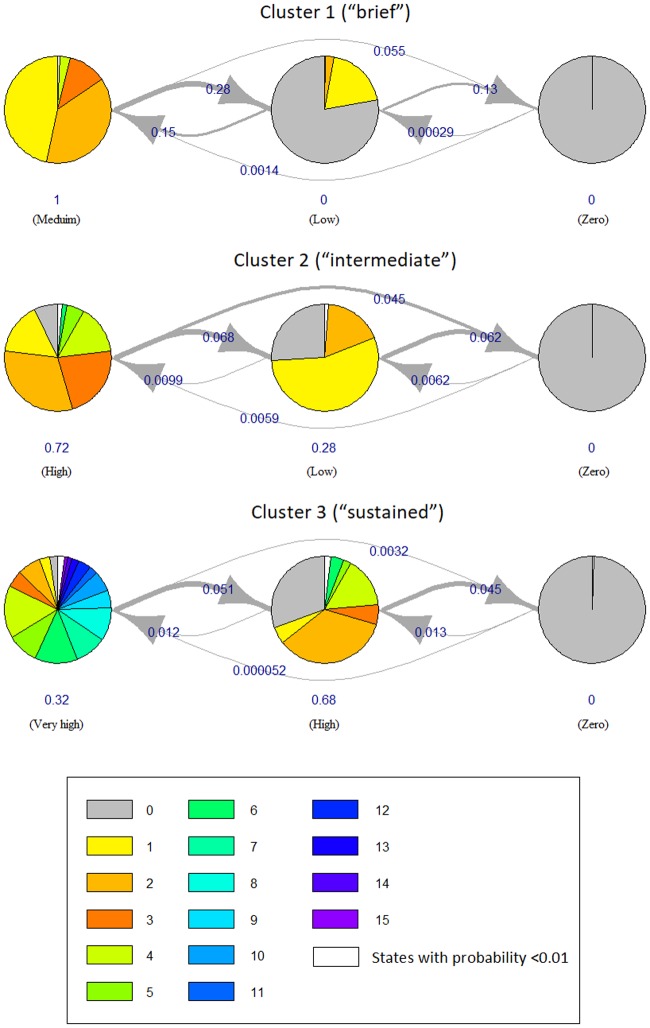
Methods: To achieve this aim, we have proposed an analytical framework that utilizes latent variables to describe the utilization patterns over time and group the claimants into clusters based on their service utilization time series. To perform the clustering without dismissing the temporal dimension of the time series, we have used a well-established statistical approach known as the mixture of hidden Markov models (MHMM). Ensuing the clustering, we have applied multinomial logistic regression to provide a description of the clusters against demographic, injury and accident covariates.
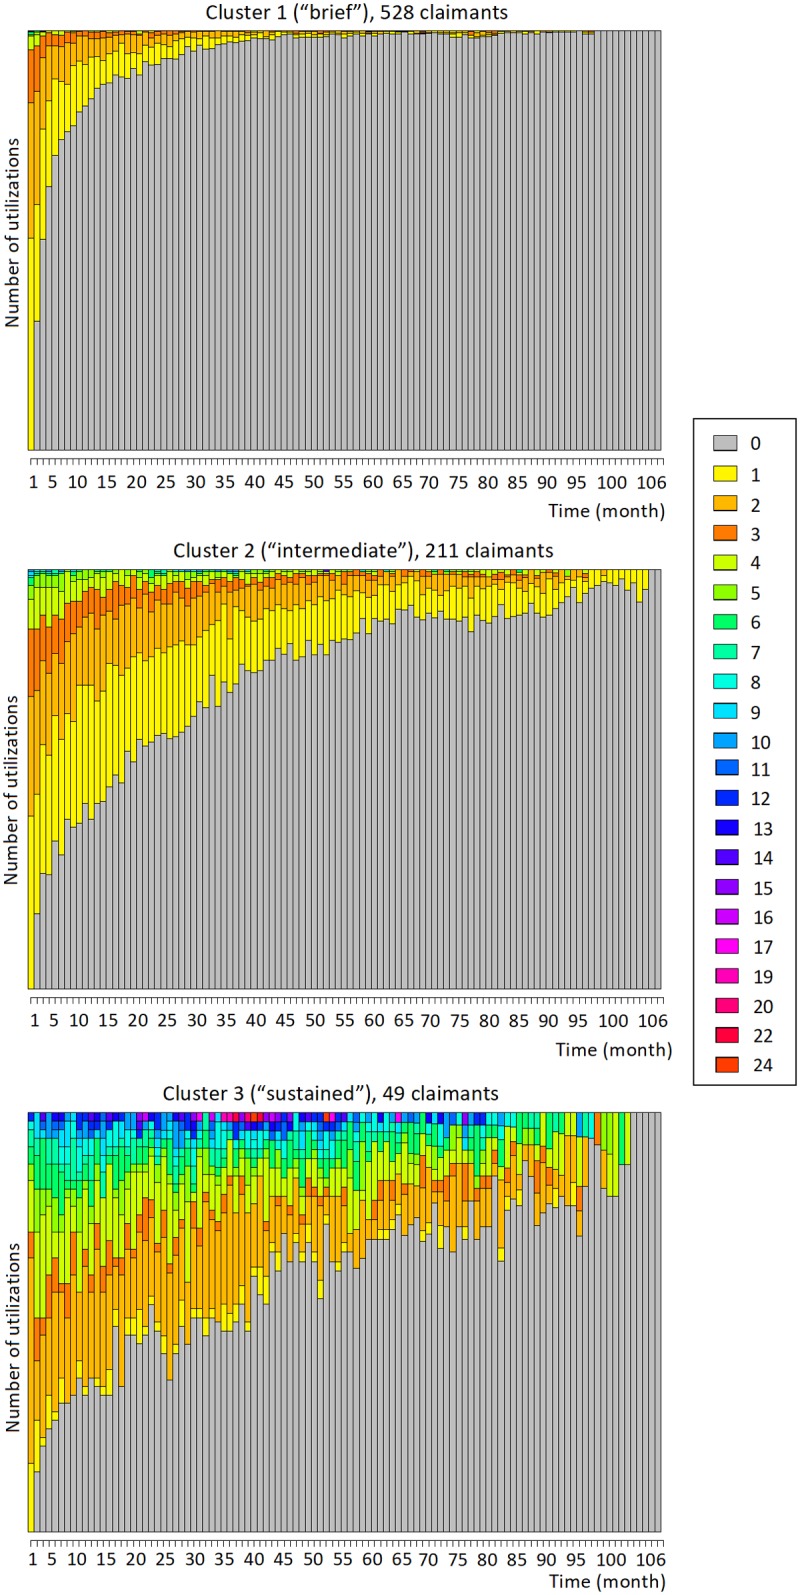
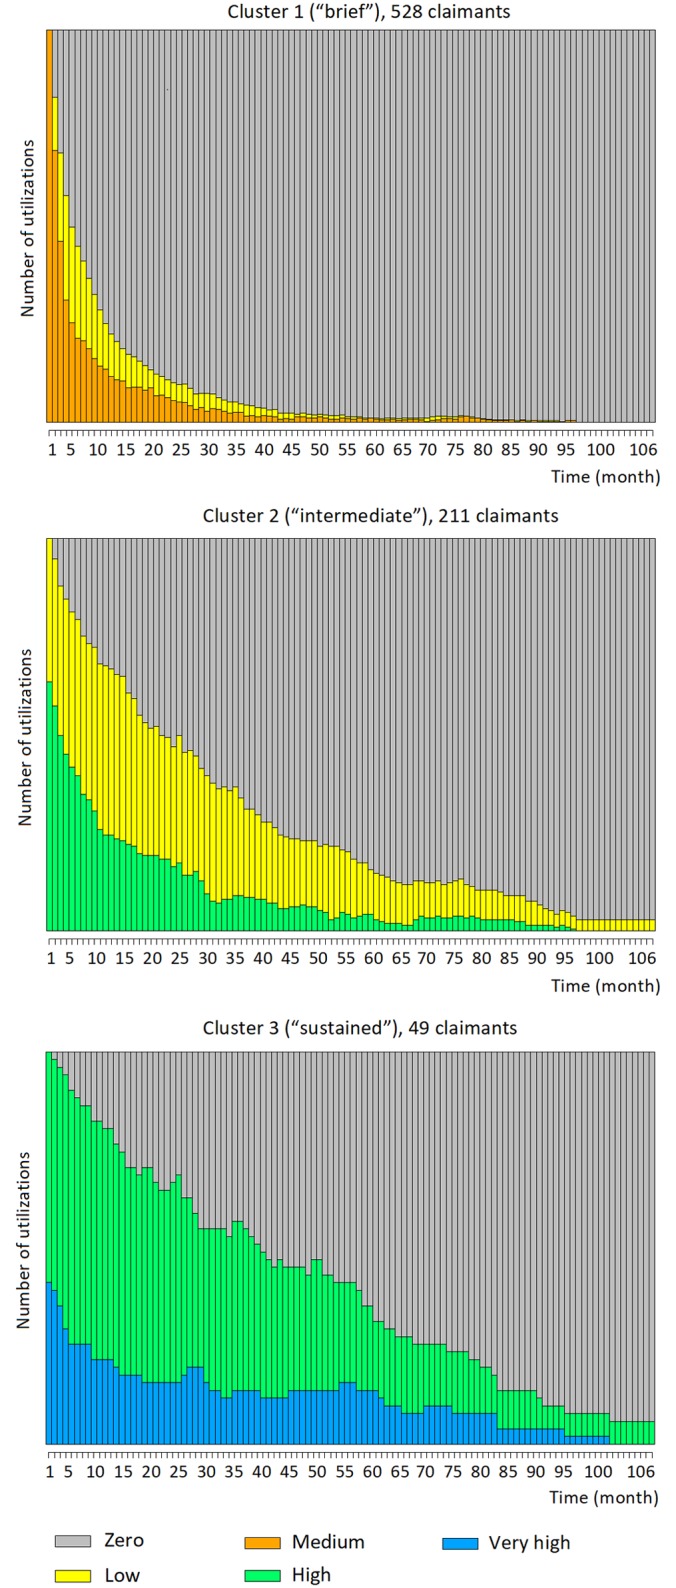
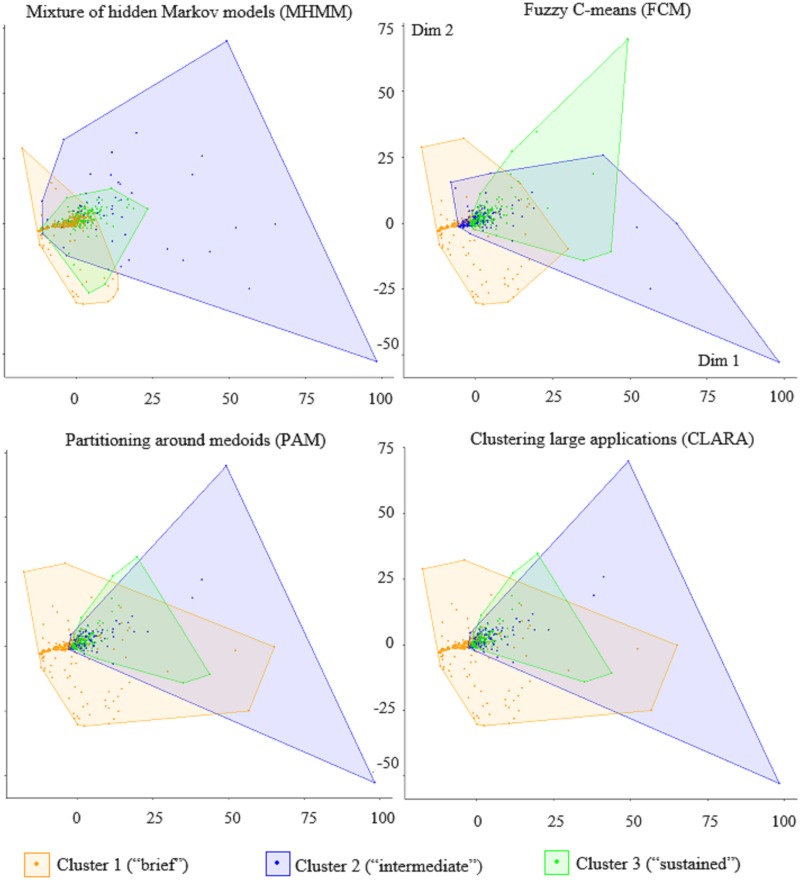
Results: We have tested our model with data on psychology service utilization from one of the main compensation agencies for transport accidents in Australia, and found that three clear clusters of service utilization can be evinced from the data. These three clusters correspond to claimants who have tended to use the services 1) only briefly after the accident; 2) for an intermediate period of time and in moderate amounts; and 3) for a sustained period of time, and intensely. The size of these clusters is approximately 67%, 27% and 6% of the number of claimants, respectively. The multinomial logistic regression analysis has showed that claimants who were 30 to 60-year-old at the time of accident, were witnesses, and who suffered a soft tissue injury were more likely to be part of the intermediate cluster than the majority cluster. Conversely, claimants who suffered more severe injuries such as a brain head injury or anon-limb fracture injury and who started their service utilization later were more likely to be part of the sustained cluster.
Conclusion: This research has showed that clustering of service utilization time series is an effective approach for identifying the main user groups and utilization patterns of a healthcare service. In addition, using logistic regression to describe the clusters in terms of demographic, injury and accident covariates has helped identify the salient attributes of the claimants in each cluster. This finding is very important for the compensation agency and potentially other authorities as it provides a baseline to improve need understanding, resource planning and service provision.
Conflict of interest statement
The authors have declared that no competing interests exist.
Figures
Similar articles
-
Multichannel mixture models for time-series analysis and classification of engagement with multiple health services: An application to psychology and physiotherapy utilization patterns after traffic accidents.Artif Intell Med. 2021 Jan;111:101997. doi: 10.1016/j.artmed.2020.101997. Epub 2020 Nov 27. Artif Intell Med. 2021. PMID: 33461690
-
Healthcare and disability service utilization in the 5-year period following transport-related traumatic brain injury.Brain Inj. 2012;26(13-14):1611-20. doi: 10.3109/02699052.2012.698790. Epub 2012 Jun 27. Brain Inj. 2012. PMID: 22738249
-
Relationship between stressfulness of claiming for injury compensation and long-term recovery: a prospective cohort study.JAMA Psychiatry. 2014 Apr;71(4):446-53. doi: 10.1001/jamapsychiatry.2013.4023. JAMA Psychiatry. 2014. PMID: 24522841
-
Preserving workers' dignity in workers' compensation systems: an international perspective.Am J Ind Med. 2012 Jun;55(6):519-36. doi: 10.1002/ajim.22022. Epub 2012 Feb 21. Am J Ind Med. 2012. PMID: 22354856 Review.
-
[Patient injuries reported to the Norwegian System of Patient Injury Compensation 2011–17].Tidsskr Nor Laegeforen. 2020 Mar 3;140(4). doi: 10.4045/tidsskr.19.0191. Print 2020 Mar 17. Tidsskr Nor Laegeforen. 2020. PMID: 32192261 Review. Norwegian.
Cited by
-
Correction: Analysis of healthcare service utilization after transport-related injuries by a mixture of hidden Markov models.PLoS One. 2019 Apr 1;14(4):e0214973. doi: 10.1371/journal.pone.0214973. eCollection 2019. PLoS One. 2019. PMID: 30934023 Free PMC article.
-
Artificial intelligence and machine learning in precision and genomic medicine.Med Oncol. 2022 Jun 15;39(8):120. doi: 10.1007/s12032-022-01711-1. Med Oncol. 2022. Retraction in: Med Oncol. 2025 Apr 26;42(6):180. doi: 10.1007/s12032-025-02732-2. PMID: 35704152 Free PMC article. Retracted. Review.
-
Trajectories of Rehabilitation across Complex Environments (TRaCE): design and baseline characteristics for a prospective cohort study on spinal cord injury and acquired brain injury.BMC Health Serv Res. 2019 Oct 15;19(1):700. doi: 10.1186/s12913-019-4564-5. BMC Health Serv Res. 2019. PMID: 31615532 Free PMC article.
References
-
- Brussoni M, George MA, Jin A, Amram O, McCormick R, Lalonde CE. Hospitalizations due to unintentional transport injuries among Aboriginal population of British Columbia, Canada: incidence, changes over time and ecological analysis of risk markers. PLoS One. 2018;13(1):e0191384 10.1371/journal.pone.0191384 - DOI - PMC - PubMed
-
- World Health Organization (WHO). Road traffic injuries. March, 2018. http://www.who.int/mediacentre/factsheets/fs358/en/.
-
- Henley G, Harrison JE. Trends in injury deaths, Australia: 1999–00 to 2009–10. Australian Institute of Health and Welfare, Canberra; 2015.
-
- Litchfield F. The cost of road crashes in Australia 2016: an overview of safety strategies. The Australian National University; 2016.
Publication types
MeSH terms
LinkOut - more resources
Full Text Sources
Medical
