Meta-Analysis
. 2019 Jan;28(2):420-430.
doi: 10.1111/mec.14920. Epub 2018 Dec 7.

How quantitative is metabarcoding: A meta-analytical approach

Affiliations
Meta-Analysis

How quantitative is metabarcoding: A meta-analytical approach

Philip D Lamb et al. Mol Ecol. 2019 Jan.

Abstract

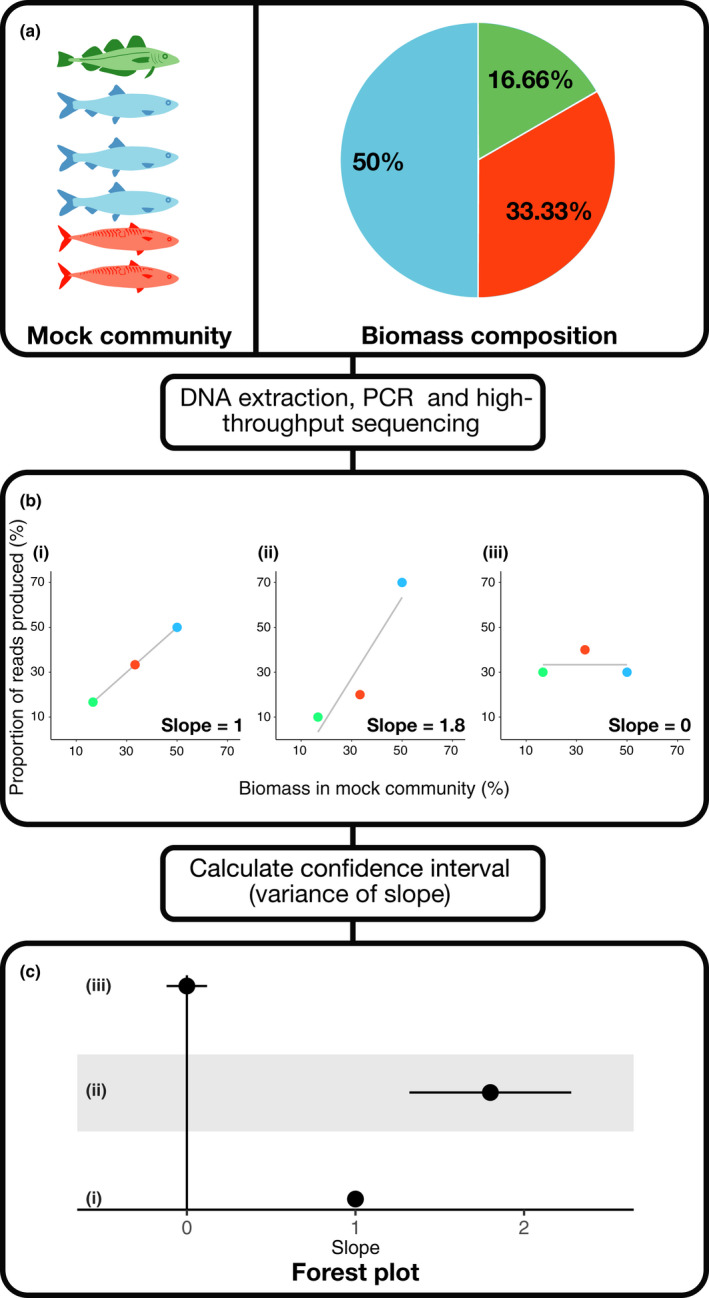
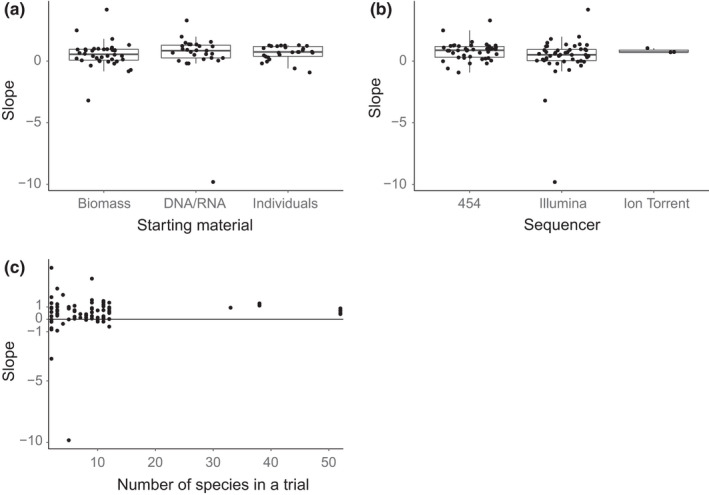
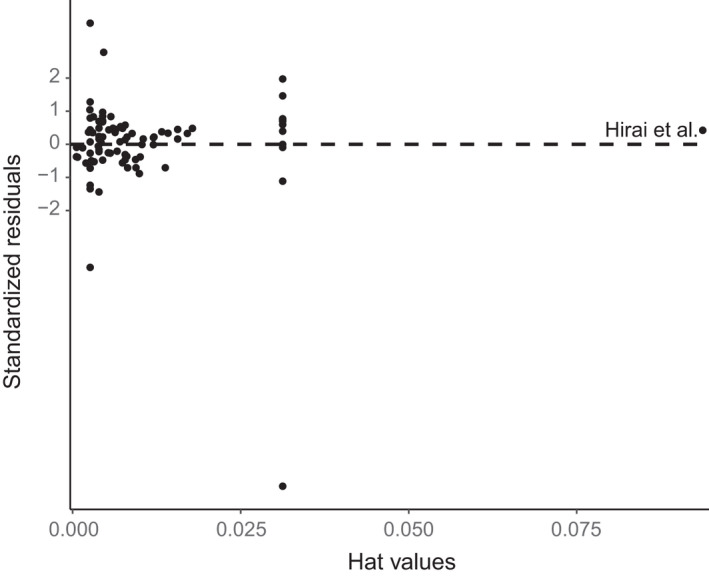
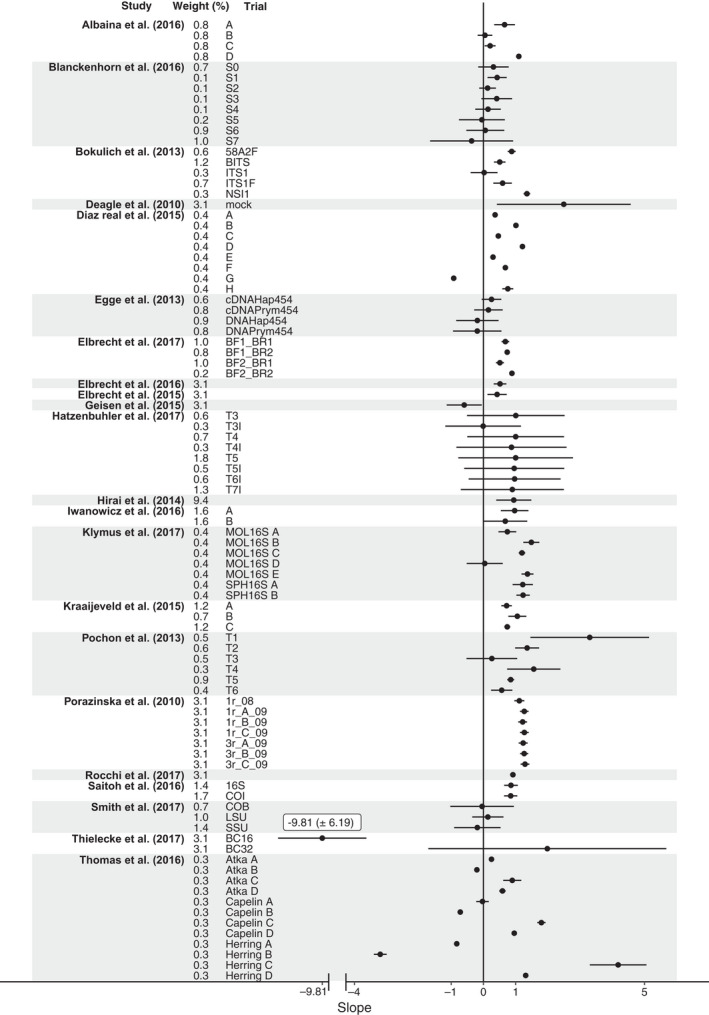
Metabarcoding has been used in a range of ecological applications such as taxonomic assignment, dietary analysis and the analysis of environmental DNA. However, after a decade of use in these applications there is little consensus on the extent to which proportions of reads generated corresponds to the original proportions of species in a community. To quantify our current understanding, we conducted a structured review and meta-analysis. The analysis suggests that a weak quantitative relationship may exist between the biomass and sequences produced (slope = 0.52 ± 0.34, p < 0.01), albeit with a large degree of uncertainty. None of the tested moderators, sequencing platform type, the number of species used in a trial or the source of DNA, were able to explain the variance. Our current understanding of the factors affecting the quantitative performance of metabarcoding is still limited: additional research is required before metabarcoding can be confidently utilized for quantitative applications. Until then, we advocate the inclusion of mock communities when metabarcoding as this facilitates direct assessment of the quantitative ability of any given study.

Keywords: biomass; high-throughput sequencing; meta-analysis; metabarcoding; next-generation sequencing.


Figures

Figure 1
Figure 1
Overview of HTS procedure and factors that can influence the quantitative output [Colour figure can be viewed at wileyonlinelibrary.com]
Figure 2
Figure 2
A schematic illustrating how data are utilized in the meta‐analysis. (a) The mock community with quantified biomass. (b) Three hypothetical outcomes of the metabarcoding step: (i) a perfect quantitative relationship between biomass and sequencing yield; that is, a 1% increase in biomass yields a 1% increase in reads, generating a slope = 1. (ii) A quantitative signal in which rank abundance is same in the mock community, but with over‐representation of common sequences and under‐representation of rare sequences resulting in a slope greater than 1. A slope of between 0 and 1 would be produced when common sequences are under‐represented and rare sequences over‐represented (not shown). (iii) No quantitative information, with a slope close to 0. Negative slopes would also be indicative of nonquantitative signals. (c) shows how (i),(ii) and (iii) would be visualized in a forest plot with corresponding variance of slope denoted by error bars [Colour figure can be viewed at wileyonlinelibrary.com]
Figure 3
Figure 3
The quantitative ability of metabarcoding using (a) various starting materials, (b) different sequencing platforms and (c) different number of species within in a trial. Note that each point represents a trial, which may not be fully independent from one another. However, this nonindependence is accounted for in the meta‐analysis model
Figure 4
Figure 4
Hat values of trials included within the meta‐analysis (a measure of influence on the meta‐analysis model plotted against standardized residuals). Outlying trials are labelled. Note the points correspond to trial‐level influence, not study‐level influence
Figure 5
Figure 5
Forest plot showing the slope estimates for all trials in the meta‐analysis (± variance of slope). Trials are clustered at the paper level denoted by the grey and white shading

Similar articles

Cited by

References

    1. Albaina, A. , Aguirre, M. , Abad, D. , Santos, M. , & Estonba, A. (2016). 18S rRNA V9 metabarcoding for diet characterization: A critical evaluation with two sympatric zooplanktivorous fish species. Ecology and Evolution, 6(6), 1809–1824. 10.1002/ece3.1986 - DOI - PMC - PubMed
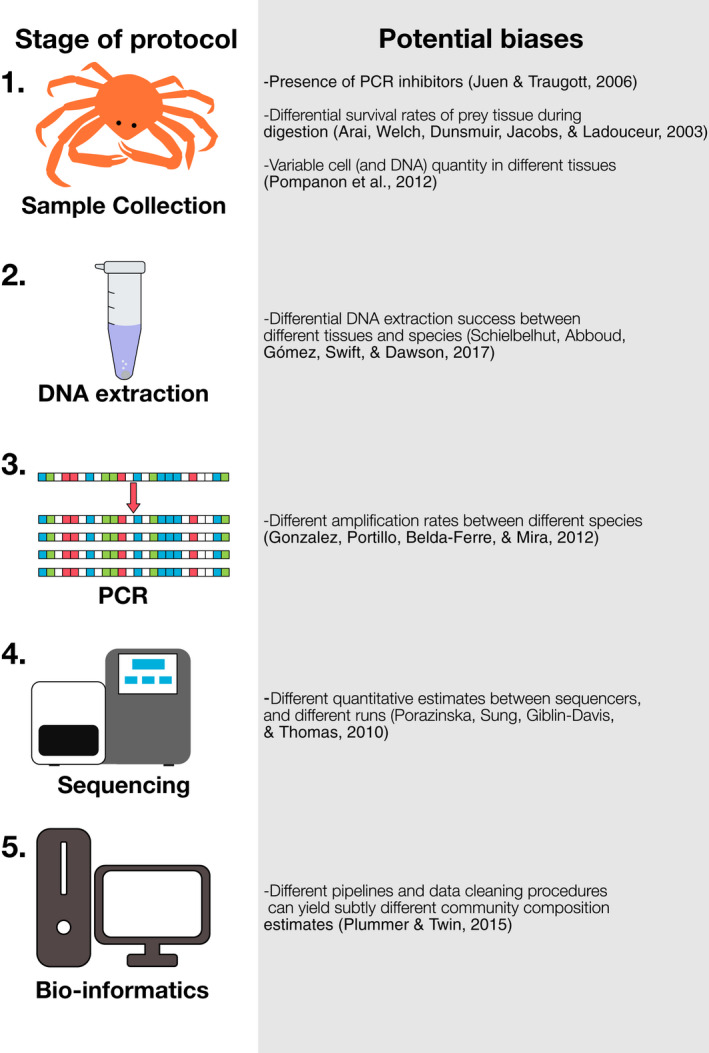
    1. Arai, M. N. , Welch, D. W. , Dunsmuir, A. L. , Jacobs, M. C. , & Ladouceur, A. R. (2003). Digestion of pelagic Ctenophora and Cnidaria by fish. Canadian Journal of Fisheries and Aquatic Sciences, 60, 825–829. 10.1139/f03-071 - DOI
    1. Blanckenhorn, W. U. , Rohner, P. T. , Bernasconi, M. V. , Haugstetter, J. , & Buser, A. (2016). Is qualitative and quantitative metabarcoding of dung fauna biodiversity feasible? Environmental Toxicology and Chemistry, 35(8), 1970–1977. 10.1002/etc.3275 - DOI - PubMed
    1. Bohmann, K. , Monadjem, A. , Noer, C. L. , Rasmussen, M. , Zeale, M. R. K. , Clare, E. , … Gilbert, M. T. P. (2011). Molecular diet analysis of two African free‐tailed bats (Molossidae) using high throughput sequencing. PLoS One, 6(6), e21441 10.1371/journal.pone.0021441 - DOI - PMC - PubMed
    1. Bokulich, N. A. , & Mills, D. A. (2013). Improved selection of internal transcribed spacer‐specific primers enables quantitative, ultra‐high‐throughput profiling of fungal communities. Applied and Environmental Microbiology, 79(8), 2519–2526. 10.1128/AEM.03870-12 - DOI - PMC - PubMed

Publication types