. 2018 Nov 7;100(3):728-738.e7.
doi: 10.1016/j.neuron.2018.10.042.

Noninvasive Ultrasonic Drug Uncaging Maps Whole-Brain Functional Networks

Affiliations

Noninvasive Ultrasonic Drug Uncaging Maps Whole-Brain Functional Networks

Jeffrey B Wang et al. Neuron. .

Abstract

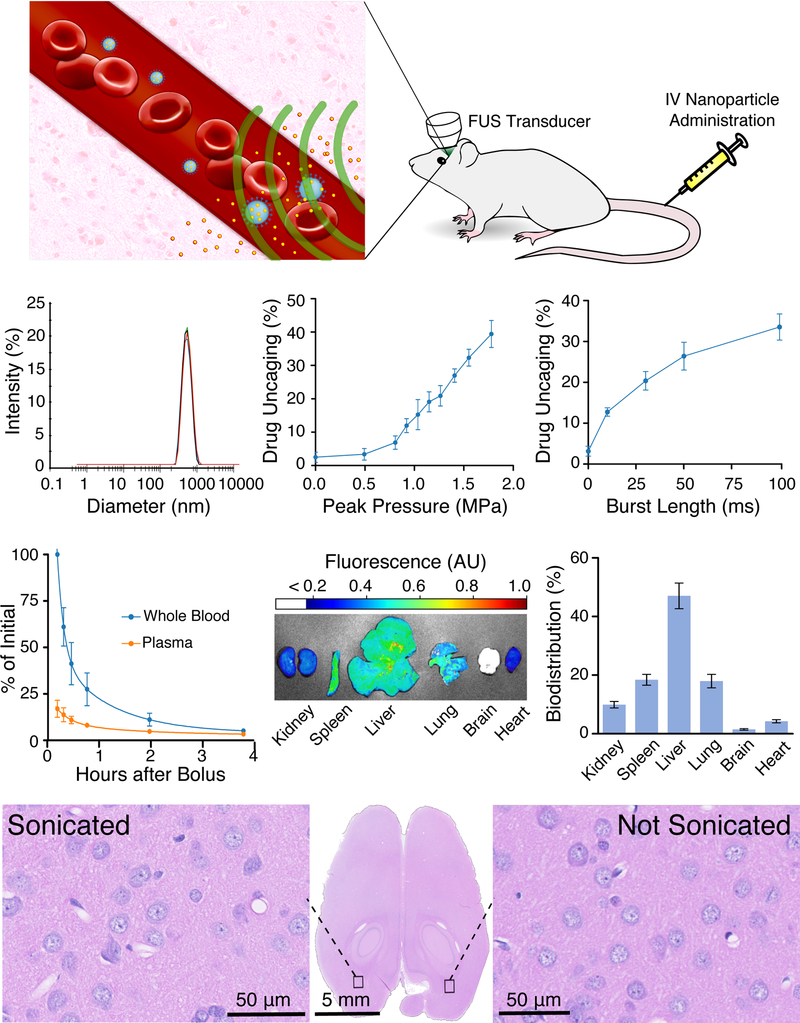
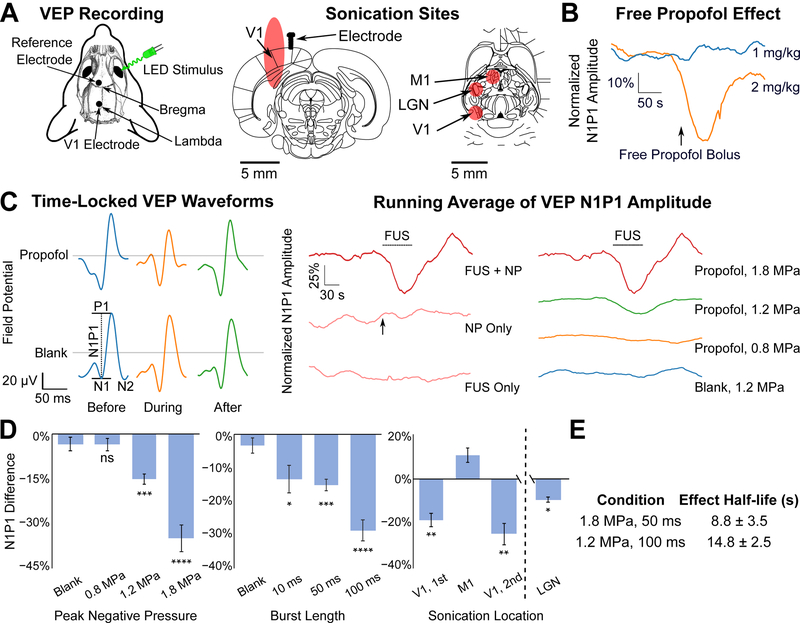
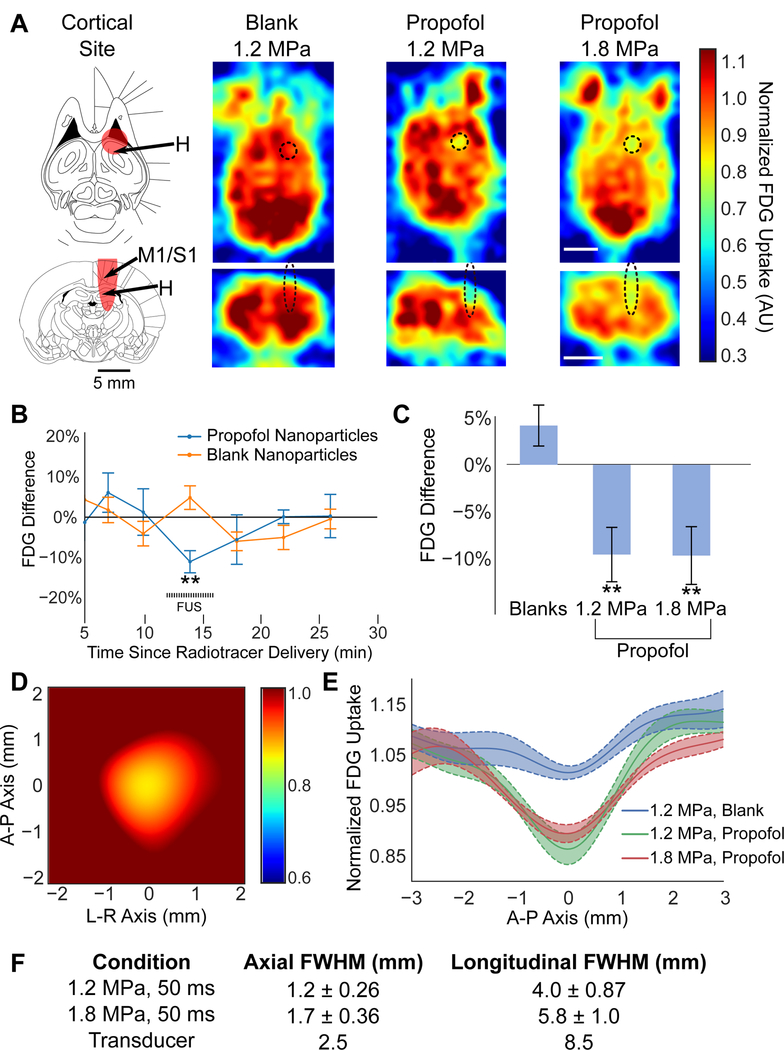
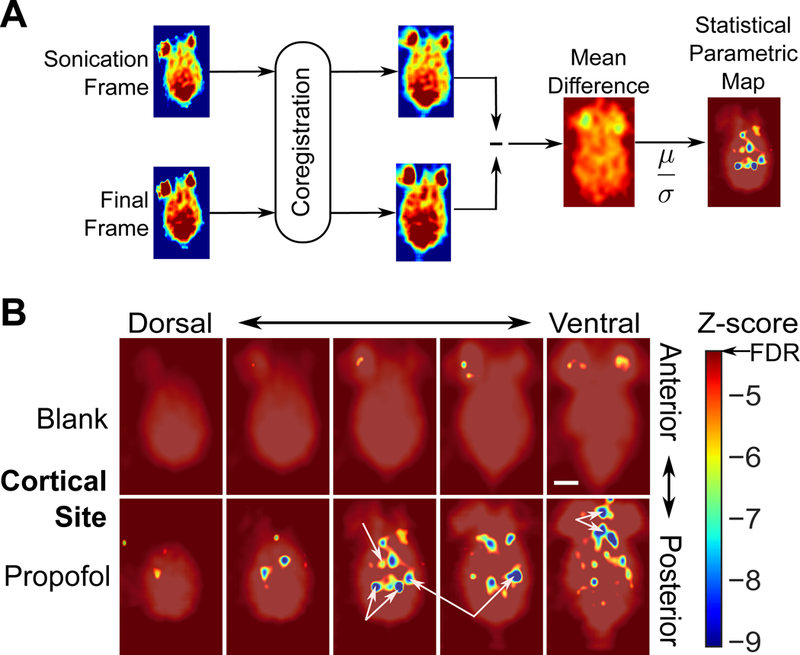
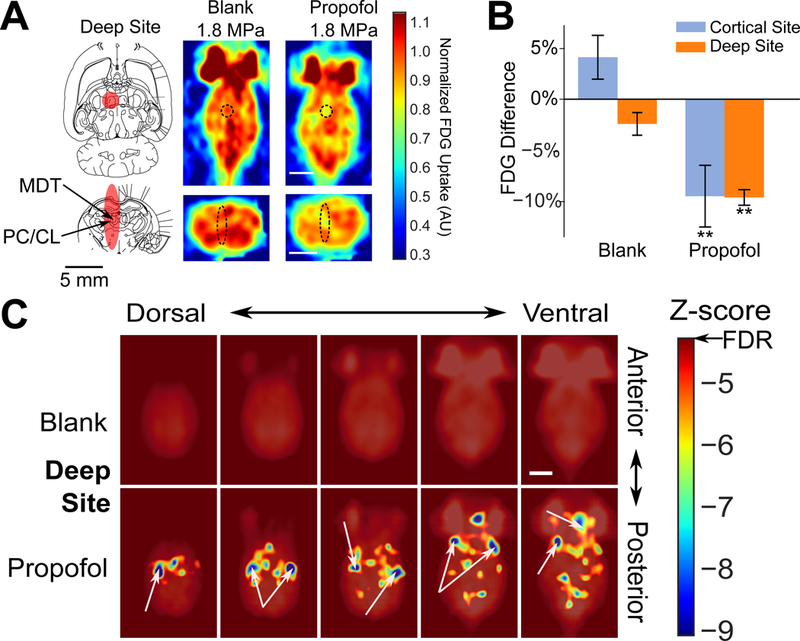
Being able to noninvasively modulate brain activity, where and when an experimenter desires, with an immediate path toward human translation is a long-standing goal for neuroscience. To enable robust perturbation of brain activity while leveraging the ability of focused ultrasound to deliver energy to any point of the brain noninvasively, we have developed biocompatible and clinically translatable nanoparticles that allow ultrasound-induced uncaging of neuromodulatory drugs. Utilizing the anesthetic propofol, together with electrophysiological and imaging assays, we show that the neuromodulatory effect of ultrasonic drug uncaging is limited spatially and temporally by the size of the ultrasound focus, the sonication timing, and the pharmacokinetics of the uncaged drug. Moreover, we see secondary effects in brain regions anatomically distinct from and functionally connected to the sonicated region, indicating that ultrasonic drug uncaging could noninvasively map the changes in functional network connectivity associated with pharmacologic action at a particular brain target.

Keywords: drug delivery; focused ultrasound; functional connectivity; functional imaging; nanotechnology; neuromodulation.


Conflict of interest statement

Declaration of interests: Patent applications have been filed on the nanoparticles described in this manuscript (17–163 – Provisional application w ith Stanford University; QZ and RDA) and on related technology (PCT/US2017/033226 with Johns Hopkins University; RDA).

Figures

Fig. 1:
Fig. 1:. Nanoparticles for ultrasonic drug uncaging are effective and well-tolerated.
(A) Schematic of nanoparticle use. Intravenously administered nanoparticles (blue) distribute in the blood volume. When focused ultrasound (FUS; green) is applied to a parenchymal target, drug (yellow) is uncaged from the nanoparticles into the blood, and then the drug diffuses into the brain across the blood-brain barrier. (B) Typical nanoparticle dynamic light scattering results show a monodisperse peak of nanoscale material with Z-averaged diameter 397.3 ± 10.0 nm, polydispersity index 0.068 ± 0.023, zeta potential −26.7 ± 0.6 mV. ( C) Drug uncaging efficacy in vitro with 650 kHz focused sonication, while varying in situ pressure (left; with 60 × 50 ms burst length at 1 Hz burst frequency) or burst length (right; with 1.2 MPa peak in situ pressure) applied to an aqueous suspension of propofol-loaded nanoparticles quantified by the amount of uncaged drug that partitions to an organic solvent as a fraction of the total loaded drug (N=3, mean +/− S.E.M.). (D) Particle clearance kinetics in whole blood and plasma following intravenous bolus administration of 1 mg/kg of propofol encapsulated in nanoparticles doped with an infrared fluorescent dye. Curves represent a double-exponential model fit to the data (N=3, mean +/− S.E.M.). (E) Nanoparticle biodistribution in a single animal (left) and quantified (right; N=3, mean +/− S.E.M.) in end organs 24 h after intravenous bolus administration of propofol-loaded nanoparticles doped with an infrared fluorescent dye, presented as the percent of fluorescence seen across the six harvested organs. (F) Representative hematoxylin and eosin-stained transverse section of the brain (center) of a rat administered propofol-loaded nanoparticles intravenously and exposed to focused sonication (60 × 100 ms bursts with 1 Hz burst frequency at 1.8 MPa) directed to the occipital cortex, with 40x views of the sonication target (left) and the contralateral non-sonicated brain (right).
Fig. 2:
Fig. 2:. Dose-response relationship and temporal kinetics of ultrasonic propofol uncaging, revealed by visual evoked potentials (VEPs).
(A) Schematic of recording electrode and light stimulus configuration (left) and sonication sites (right) represented by the expected full-width half-maximum (FWHM) of the sonication targets overlaid onto atlas slices (Paxinos and Watson, 2013) middle: −6.5 mm caudal to bregma, right: −5.1 mm ventral to bregma. V1: primary visual cortex, M1: primary motor cortex, LGN: lateral geniculate nucleus. (B) Running average (N=3 animals each) of the VEP N1P1 amplitude over time during a flashing light stimulus (10 ms monocular light stimulus at 1 Hz), normalized by the 60 seconds of stimulus presentation prior to bolus administration. Intravenous free propofol administration shows no effect with a 1 mg/kg bolus (blue) of free propofol, and a pronounced effect only with 2 mg/kg (orange). In all nanoparticle experiments, 1 mg/kg of encapsulated propofol was given in a bolus. (C) Left: Time-locked VEP waveforms (10 ms monocular light stimulus at 1 Hz), averaged over 60 s from an individual representative session before, during, or after sonication (60 × 50 ms bursts, 1 Hz burst frequency at 1.2 MPa est. peak in situ pressure) applied to V1 contralateral from the light stimulus, following intravenous administration of propofol-loaded (top) or blank (bottom) nanoparticles. Scheme of N1P1 amplitude measurement indicated on the bottom left waveform. Middle: Running average (N=5 animals) of the VEP N1P1 amplitude over time for presentations of focused ultrasound (FUS) only (bottom; 60 × 50 ms bursts, 1 Hz burst frequency at 1.8 MPa est. peak in situ pressure), followed by nanoparticle (NP) administration (middle; arrow indicates start of bolus administration), and then focused ultrasound with nanoparticles in circulation (FUS + NP, top) during the indicated time period (dashed bar). Time traces are normalized by the 60 seconds prior to intervention (i.e., FUS for the “F US + NP” and “FUS Only” conditions or bolus administration for the NP Only condition) Right: Running average (N=5–9 animals) of VEP N1P1 amplitude following sonication (60 × 50 ms bursts, 1 Hz burst frequency) applied to V1 With the indicated peak in situ pressure, normalized by the 60 seconds prior to FUS administration. 1.8 MPa trace repeated from the middle panel. Dashed bar: sonication time. (D) Quantification of the difference in N1P1 amplitude seen between the beginning and end of sonication (60 bursts at 1 Hz burst frequency) while varying the peak in situ pressure (left; 50 ms bursts) or burst length (middle; 1.2 MPa pressure); and for two separate experiments (right) first while moving the sonication (1.2 MPa, 60 × 50 ms bursts, 1 Hz burst frequency) between V1 and M1 successively in the same animal (statistical comparison to M1 sonication), or separately sonicating LGN. Presented are mean +/− S.E.M. for groups of N=4–9. *: p<0.05, **: p<0.01, ***: p<0.001, by two-tailed t-tests, comparing to blank nanoparticle sonication unless otherwise noted. Process for computing the difference in N1P1 amplitude is described in STAR Methods. (E) Effect half-life indicated by a model (see Fig. S2, STAR Methods) fitted to the N1P1 time traces for the indicated condition.
Figure 3:
Figure 3:. Spatial profile of ultrasonic drug uncaging quantified by PET imaging.
(A) Left: Full-width half-maximum (FWHM) of the cortical sonication target (red) indicated on atlas sections (Paxinos and Watson, 2013) top: −6.9 mm ventral to bregma, bottom: −2 mm caudal to bregma. H: Hippocampus, M1: Primary motor cortex, S1: Primary somatosensory cortex. Right: Transverse (top) and axial (bottom) PET images obtained during sonication (60 × 50 ms bursts at 1 Hz burst frequency; black dashed ellipse: expected sonication FWHM) at the indicated peak in situ pressure, following blank or propofol-loaded nanoparticle administration. Color bar represents FDG uptake, normalized against the average FDG uptake in the contralateral hemisphere. Note that the anterior paired structures outside the brain are the Harderian glands. Scale bar: 5 mm. (B) Difference of the minimum FDG avidity across time for the voxels within the sonication FWHM averaged across animals receiving blank (orange) or propofol-loaded (blue) nanoparticles at 2 min following radiotracer administration. FDG avidity values are normalized against the contralateral field to account for different temporal features of FDG uptake in different animals, due to different body weights, blood glucose level, and general anesthesia level (Fig. S3B). (C) Quantification of FDG uptake during sonication for voxels in the sonication field minus the contralateral non-sonicated field following blank or propofol-loaded nanoparticle administration. (D) Locally registered, interpolated, and averaged image of FDG uptake at the sonication site for 1.2 MPa sonication with propofol-loaded nanoparticles, normalized by the contralateral field. A-P: anterior-posterior; L-R: left-right. (E) FDG uptake across a sagittal slice centered at the sonication site for each condition. Each individual animal was registered to each other by the minimal FDG uptake within the sonication site. (F) Estimated full-width at half-maximum (FWHM) of the sonication-induced changes in FDG avidity for each condition, and for the transducer used in these experiments. Presented are mean ± S.E.M. for groups of N=5–7. **: p<0.01 by two-tailed t-tests.
Fig. 4:
Fig. 4:. Ultrasonic propofol uncaging maps functional connectivity of a cortical target.
(A) Analysis scheme for statistical parametric mapping of the whole-brain effects of targeted ultrasonic propofol uncaging. Following whole-brain coregistration, FDG PET frames during sonication and at the end of the acquisition were subtracted. This difference was averaged across animals, divided by the standard error across each group on a voxel-by-voxel basis, and thresholded at the false discovery rate (FDR), producing a z-score statistical parametric map. (B) Functional connectivity maps for cortical target sonication of animals receiving blank (top) or propofol-loaded (bottom) nanoparticles. Unannotated map is provided in Fig. S4A-B. CT: Central thalamus, Tc/PT: Tectum/posterior thalamus, H: Hippocampus, O: Olfactory bulbs and cortex.
Fig. 5:
Fig. 5:. Ultrasonic propofol uncaging in deep structures yields a unique functional connectivity signature.
(A) Left: Deep sonication target FWHM (red) overlaid onto transverse (top: −5.6 mm ventral to bregma) and axial (bottom: −3 mm caudal to bregma) rat atlas sections (Paxinos and Watson, 2013). MDT: mediodorsal thalamus, PC/CL: paracentral/centrolateral nuclei of the thalamus. Right: Individual animal transverse (top) and axial (bottom) PET images obtained during sonication (60 × 50 ms bursts at 1 Hz burst frequency, 1.8 MPa peak in situ pressure; black dashed ellipse: expected sonication FWHM), following blank or propofol-loaded nanoparticle administration. Color bar represents FDG uptake, normalized against the average FDG uptake in the contralateral hemisphere. Scale bars: 5 mm. (B) Quantification of FDG avidity difference during sonication in the sonication field minus the contralateral non-sonicated field following blank or propofol-loaded nanoparticle administration for either cortical (repeated from Fig. 3 for ease of comparison) or deep target sonication. Presented are mean +/− S.E.M. for groups of N=6–7. **: p<0.01 by two-tailed t-tests. (C) Functional connectivity maps for deep target sonication of animals receiving blank or propofol-loaded nanoparticles. Unannotated map is provided in Fig. S4C. FC: Frontal cortex, LT: Lateral thalamus, TeA: Tegmental association area, I: Insula, O: Olfactory bulbs and cortex.

References

    1. Airan R (2017). Neuromodulation with nanoparticles. Science (New York, N.Y.) 357, 465. - PubMed
    1. Airan RD, Meyer RA, Ellens NPK, Rhodes KR, Farahani K, Pomper MG, Kadam SD, and Green JJ (2017). Noninvasive Targeted Transcranial Neuromodulation via Focused Ultrasound Gated Drug Release from Nanoemulsions. Nano Letters 17, 652–659. - PMC - PubMed
    1. Allan C, Kalu U-G, Sexton CE, Ebmeier KP, Kennedy S, Giacobbe P, Allan C, Herrmann L, Ebmeier K, Slotema C, et al. (2012). Transcranial stimulation in depression. The British Journal of Psychiatry : The Journal of Mental Science 200, 10–11. - PubMed
    1. Azhari H (2010). Basics of biomedical ultrasound for engineers (Wiley; ).
    1. Bichot NP, Heard MT, and Desimone R (2011). Stimulation of the nucleus accumbens as behavioral reward in awake behaving monkeys. Journal of Neuroscience Methods 199, 265–272. - PMC - PubMed

Publication types

LinkOut - more resources