

Amputee perception of prosthetic ankle stiffness during locomotion
- PMID: 30409168
- PMCID: PMC6225626
- DOI: 10.1186/s12984-018-0432-5
Amputee perception of prosthetic ankle stiffness during locomotion
Abstract
Background: Prosthetic feet are spring-like, and their stiffness critically affects the wearer's stability, comfort, and energetic cost of walking. Despite the importance of stiffness in ambulation, the prescription process often entails testing a limited number of prostheses, which may result in patients receiving a foot with suboptimal mechanics. To understand the resolution with which prostheses should be individually optimized, we sought to characterize below-knee prosthesis users' psychophysical sensitivity to prosthesis stiffness.
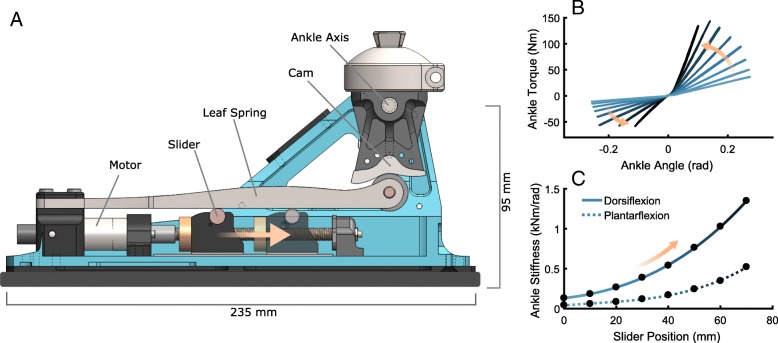
Methods: We used a novel variable-stiffness ankle prosthesis to measure the repeatability of user-selected preferred stiffness, and implemented a psychophysical experiment to characterize the just noticeable difference of stiffness during locomotion.
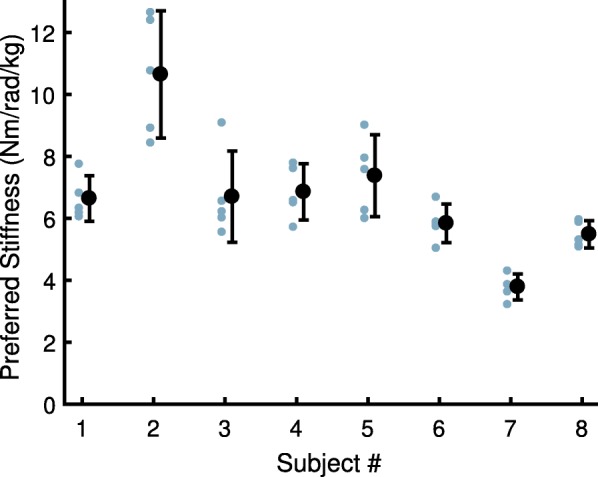
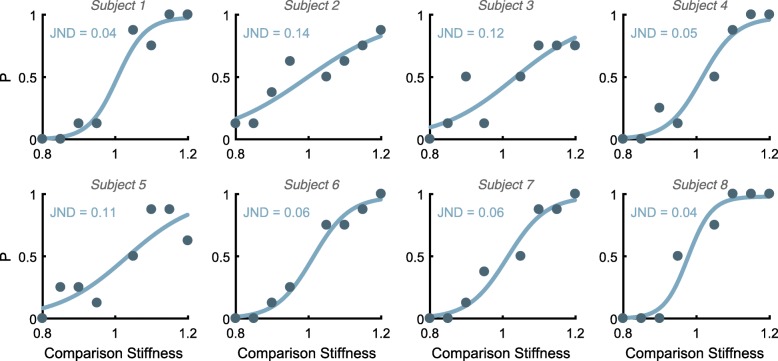
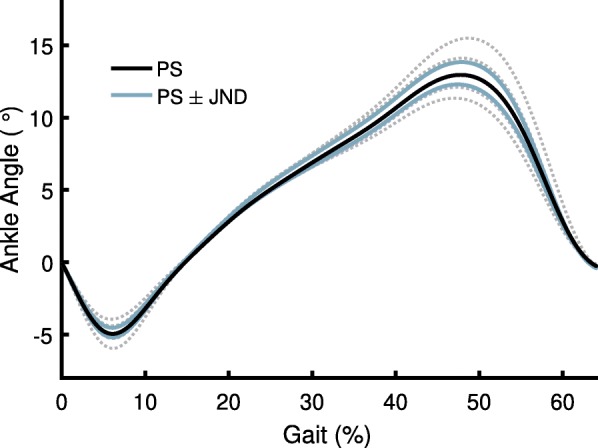
Results: All eight subjects with below-knee amputation exhibited high repeatability in selecting their Preferred Stiffness (mean coefficient of variation: 14.2 ± 1.7%) and were able to correctly identify a 7.7 ± 1.3% change in ankle stiffness (with 75% accuracy).
Conclusions: This high sensitivity suggests prosthetic foot stiffness should be tuned with a high degree of precision on an individual basis. These results also highlight the need for a pairing of new robotic prescription tools and mechanical characterizations of prosthetic feet.
Keywords: Perception; Prosthetics; Stiffness; Variable-stiffness.
Conflict of interest statement
Ethics approval and consent to participate
This study was approved by the Northwestern University Institutional Review Board. All participants provided written informed consent prior to participation in the experiments.
Consent for publication
Not applicable
Competing interests
MS and ER hold pending patents on the technology (prosthesis) used in this study.
Publisher’s Note
Springer Nature remains neutral with regard to jurisdictional claims in published maps and institutional affiliations.
Figures
References
-
- Wurdeman Shane R, Stevens Phillip M, Campbell James H. Mobility Analysis of AmpuTees (MAAT I): Quality of life and satisfaction are strongly related to mobility for patients with a lower limb prosthesis. Prosthetics and Orthotics International. 2017;42(5):498–503. doi: 10.1177/0309364617736089. - DOI - PMC - PubMed
Publication types
MeSH terms
Grants and funding
LinkOut - more resources
Full Text Sources
Medical
