. 2018 Nov 8;6(1):201.
doi: 10.1186/s40168-018-0579-0.

Visualization-assisted binning of metagenome assemblies reveals potential new pathogenic profiles in idiopathic travelers' diarrhea

Affiliations

Visualization-assisted binning of metagenome assemblies reveals potential new pathogenic profiles in idiopathic travelers' diarrhea

Qiyun Zhu et al. Microbiome. .

Abstract

Background: Travelers' diarrhea (TD) is often caused by enterotoxigenic Escherichia coli, enteroaggregative E. coli, other bacterial pathogens, Norovirus, and occasionally parasites. Nevertheless, standard diagnostic methods fail to identify pathogens in more than 40% of TD patients. It is predicted that new pathogens may be causative agents of the disease.

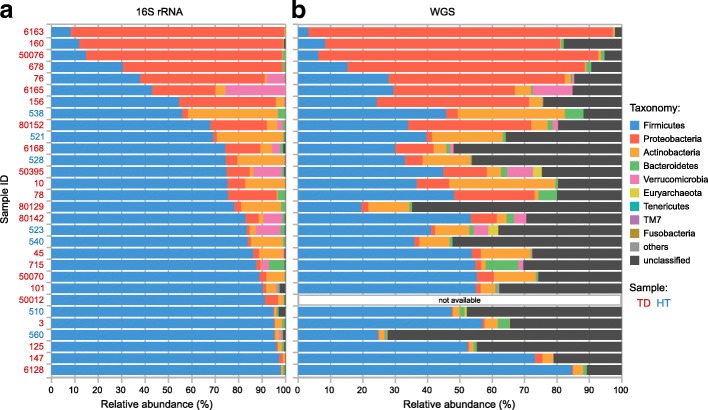
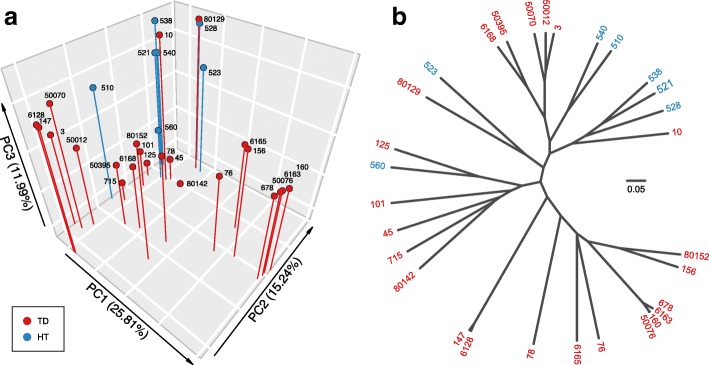
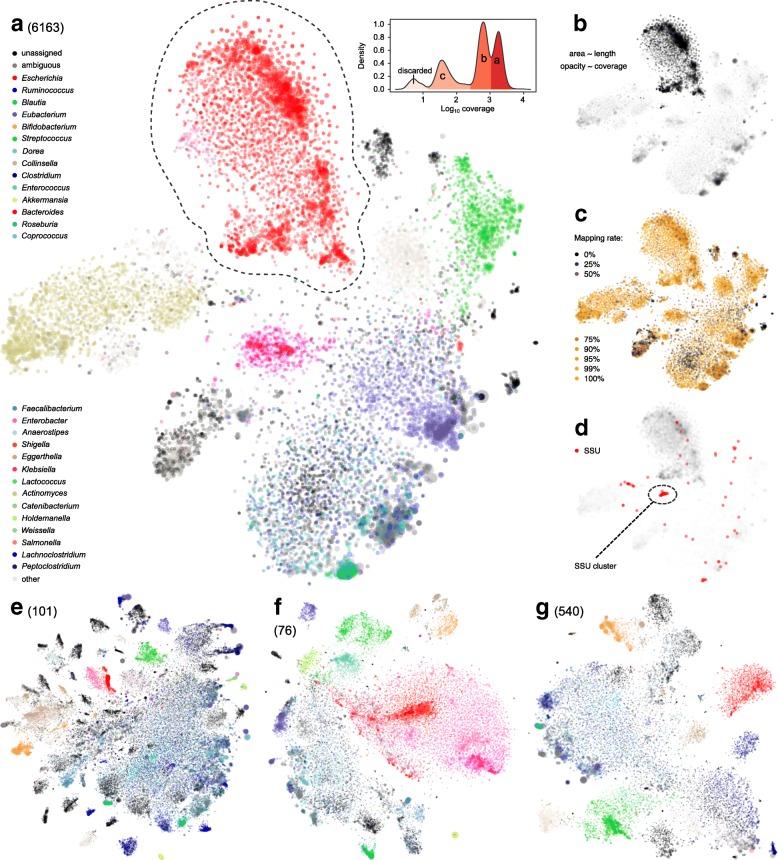
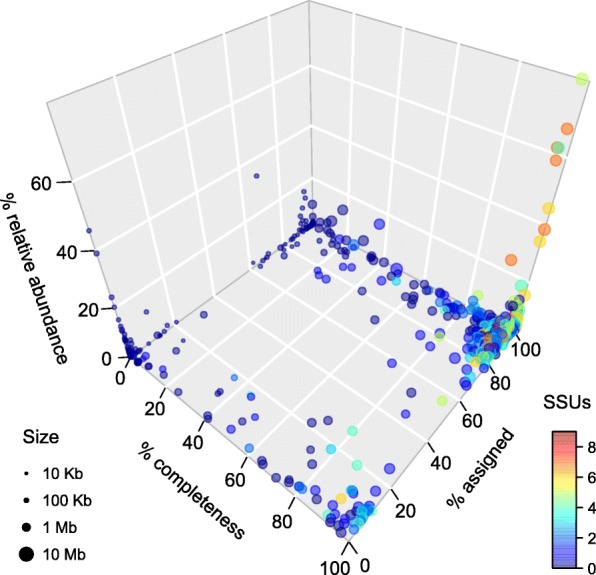
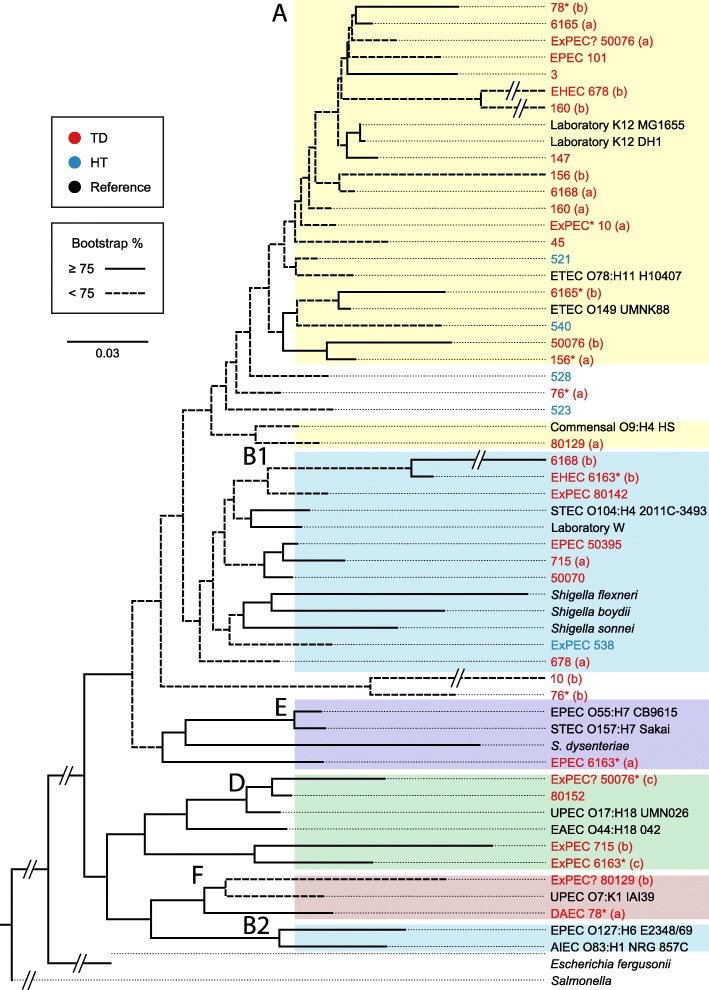
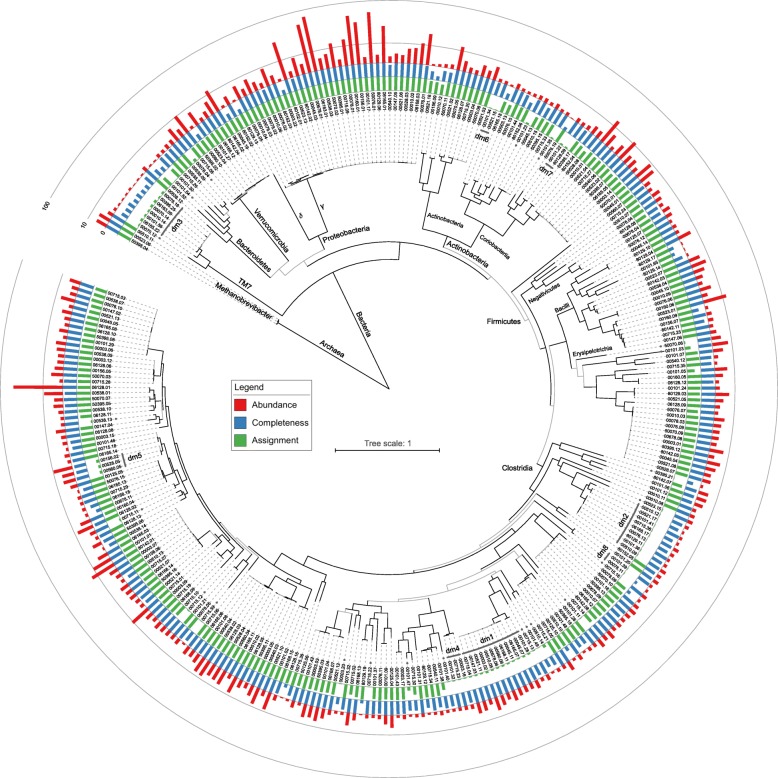
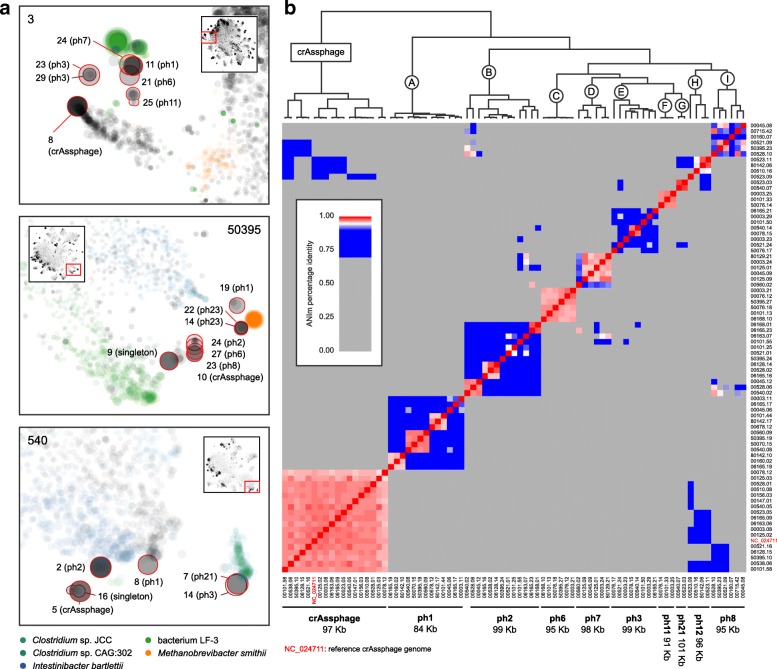
Results: We performed a comprehensive amplicon and whole genome shotgun (WGS) metagenomic study of the fecal microbiomes from 23 TD patients and seven healthy travelers, all of which were negative for the known etiologic agents of TD based on standard microbiological and immunological assays. Abnormal and diverse taxonomic profiles in TD samples were revealed. WGS reads were assembled and the resulting contigs were visualized using multiple query types. A semi-manual workflow was applied to isolate independent genomes from metagenomic pools. A total of 565 genome bins were extracted, 320 of which were complete enough to be characterized as cellular genomes; 160 were viral genomes. We made predictions of the etiology of disease for many of the individual subjects based on the properties and features of the recovered genomes. Multiple patients with low-diversity metagenomes were predominated by one to several E. coli strains. Functional annotation allowed prediction of pathogenic type in many cases. Five patients were co-infected with E. coli and other members of Enterobacteriaceae, including Enterobacter, Klebsiella, and Citrobacter; these may represent blooms of organisms that appear following secretory diarrhea. New "dark matter" microbes were observed in multiple samples. In one, we identified a novel TM7 genome that phylogenetically clustered with a sludge isolate; it carries genes encoding potential virulence factors. In multiple samples, we observed high proportions of putative novel viral genomes, some of which form clusters with the ubiquitous gut virus, crAssphage. The total relative abundance of viruses was significantly higher in healthy travelers versus TD patients.

Conclusion: Our study highlights the strength of assembly-based metagenomics, especially the manually curated, visualization-assisted binning of contigs, in resolving unusual and under-characterized pathogenic profiles of human-associated microbiomes. Results show that TD may be polymicrobial, with multiple novel cellular and viral strains as potential players in the diarrheal disease.

Keywords: Dark matter; Escherichia coli; Strain-level; TM7; Travelers’ diarrhea; Virulence factor; crAssphage.


Conflict of interest statement

Ethics approval and consent to participate

This project was granted an exemption from required ethics approval by the J. Craig Venter Institute Institutional Review Board.

Consent for publication

Not applicable.

Competing interests

The authors declare that they have no competing interests.

Publisher’s Note

Springer Nature remains neutral with regard to jurisdictional claims in published maps and institutional affiliations.

Figures

Fig. 1
Fig. 1
Phylum-level taxonomic profiles. Bar lengths represent relative abundances of sequences classified in taxonomic groups. a 16S rRNA gene-based profile, in which the baseline is the pool of all classified 16S rRNA sequences. Phyla with less than ten sequences in total are not displayed. “Unclassified” represents sequences marked as “unclassified Bacteria” by mothur. b WGS-based profile. Phyla with an average relative abundance lower than 0.001% are not displayed. “Unclassified” represents sequences not mapped to any of the reference sequences in the database. Samples are sorted by the 16S rRNA gene-based relative abundance of Firmicutes from low to high
Fig. 2
Fig. 2
16S rRNA gene-based beta diversity of samples. a Scatter plot of the top three axes by principal coordinates analysis (PCoA). The four highly Proteobacteria-dominant samples, 160, 678, 6163 and 50076, formed a distinct cluster on the PC1 axis (vs. other TDs, AMOVA p value < 0.001). Three Proteobacteria-rich samples (76, 156, and 6165) also mapped near this cluster. The two Firmicutes-predominant samples, 147 and 6128, formed a small cluster (vs. other TDs AMOVA p value = 0.012). b Dendrogram reconstructed using the UPGMA algorithm based on the average Yue & Clayton measure of dissimilarity between pairs of samples
Fig. 3
Fig. 3
Illustration of metagenomic contig clustering pattern and binning process. ad VizBin-computed, k-mer signature-based scatter plots of contigs ≥ 1 kb of the low-diversity sample 6163, in which E. coli was the dominant species (91.3%, by WGS reads, same below) and multiple E. coli genomes were detected and separated. The area of each dot is proportional to the contig size. a Taxonomic assignments of contigs. Genera with relative abundance ≥ 0.2% are colored. A contig is colored if ≥ 75% of reads mapped to it were mapped to a single genus. The dashed area shows a manually selected cluster of mostly Escherichia contigs. The kernel density function of the Escherichia contigs is plotted aside, with peaks manually divided to represent genomes of multiple E. coli strains. b Contig coverage indicated by opacity. c Taxonomic assignment rate (proportion of reads mapped to the reference genome database) indicated by color depth. d Contigs with SSU(s) are highlighted. e High-diversity sample 101 from which multiple known and “dark matter” genomes were isolated. f Sample 76 featured by the presence of multiple Enterobacteriaceae genera. g Sample 540, a healthy traveler control with moderate diversity
Fig. 4
Fig. 4
Basic statistics of the 565 genome bins extracted from 29 metagenomes. The three axes indicate relative abundance (calculated as sum of length × coverage of member contigs, normalized by the whole assembly), CheckM-computed completeness, and taxonomic assignment rate (proportion of classifiable reads mapped to member contigs), respectively. Dot area is proportional to the total length of contigs of each bin. Color scale indicates the number of SSUs identified in each bin
Fig. 5
Fig. 5
Phylogenetic tree of identified E. coli genomes. The tree was reconstructed using the maximum likelihood method using a conserved set of protein sequences. Multiple reference E. coli genomes were included to indicate the phylogenetic positions of the identified E. coli strains. Only near-complete (completeness ≥ 80%) genomes were included in the analysis. The tree is rooted with Salmonella as an outgroup. Nodal labels represent bootstrap support values (out of 100 replicates). Strains marked with an asterisk were those that were part of a polymicrobial sample. Group A is shaded yellow, B1 and B2 blue, D is green, E is violet and F is peach
Fig. 6
Fig. 6
Phylogenetic tree of 320 bins representing cellular organisms. Taxon labels are sample ID dot bin ID (see Additional file 1: Table S7). Black and gray lines represent branches with ≥ and < 75 out of 100 bootstrap support, respectively. Branch labels are taxonomic groups to which all child taxa except for unidentified organisms belong. The circular bar plots represent relative abundance (red, square root scale), completeness as a cellular organism (blue, linear scale), and proportion of reads mapped to the reference genome database (green, linear scale). All three plots are in a 0 to 100% range. Unidentified organisms (assignment < 40%) are indicated by gray lines (clusters) and dots (singletons) around the circle
Fig. 7
Fig. 7
Clustering patterns of crAssphage and “crish” viruses. a Examples of the contig co-clustering patterns in the k-mer signature-based scatter plot in samples 3, 50395, and 540. The large panels are the zoom-in views of the red boxes in the small panels, which represent the entire microbiomes. The size and opacity of a dot are proportional to the length and coverage of the contig, respectively. Contigs mapped to five representative bacteria in proximity to the viruses are colored. Extracted virus bins are highlighted by red edges and labeled by the bin ID and the virus cluster name. b Pairwise average nucleotide identity (ANI) matrix of crAssphage’s and nine clusters of “crish” viruses (assigned by letters A to I). ANI values below 70% are grayed out. The dendrogram shows the hierarchical clustering result based on the ANI matrix. The reference crAssphage genome is included for comparison. Bins that are too fragmented, incomplete, and/or low abundance are not included. Singletons are not included

References

    1. Steffen Robert. Epidemiology of Diarrhea in Travelers. JAMA: The Journal of the American Medical Association. 1983;249(9):1176. doi: 10.1001/jama.1983.03330330054035. - DOI - PubMed
    1. Mutsch M, Pitzurra R, Hatz C, Steffen R. Post-infectious sequelae of travelers’ diarrhea: irritable bowel syndrome. J Travel Med. 2014;21:141–143. doi: 10.1111/jtm.12094_1. - DOI - PubMed
    1. Connor BA, Riddle MS. Post-infectious sequelae of travelers’ diarrhea. J Travel Med. 2013;20:303–312. doi: 10.1111/jtm.12049. - DOI - PubMed
    1. Shah N, DuPont HL, Ramsey DJ. Global etiology of travelers’ diarrhea: systematic review from 1973 to the present. Am J Trop Med Hyg. 2009;80:609–614. doi: 10.4269/ajtmh.2009.80.609. - DOI - PubMed
    1. Steffen R, Hill DR, DuPont HL. Traveler’s diarrhea: a clinical review. JAMA. 2015;313:71–80. doi: 10.1001/jama.2014.17006. - DOI - PubMed

Publication types

MeSH terms