

A physical and genetic map of Cannabis sativa identifies extensive rearrangements at the THC/CBD acid synthase loci
- PMID: 30409771
- PMCID: PMC6314170
- DOI: 10.1101/gr.242594.118
A physical and genetic map of Cannabis sativa identifies extensive rearrangements at the THC/CBD acid synthase loci
Abstract
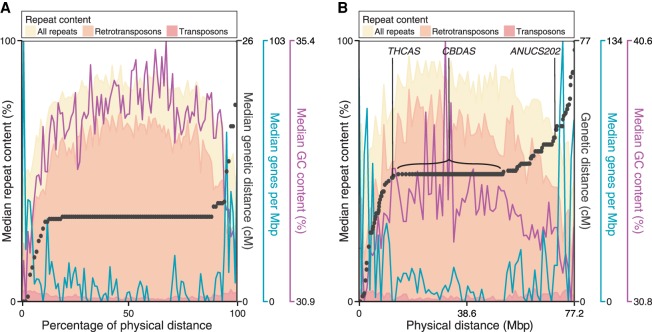
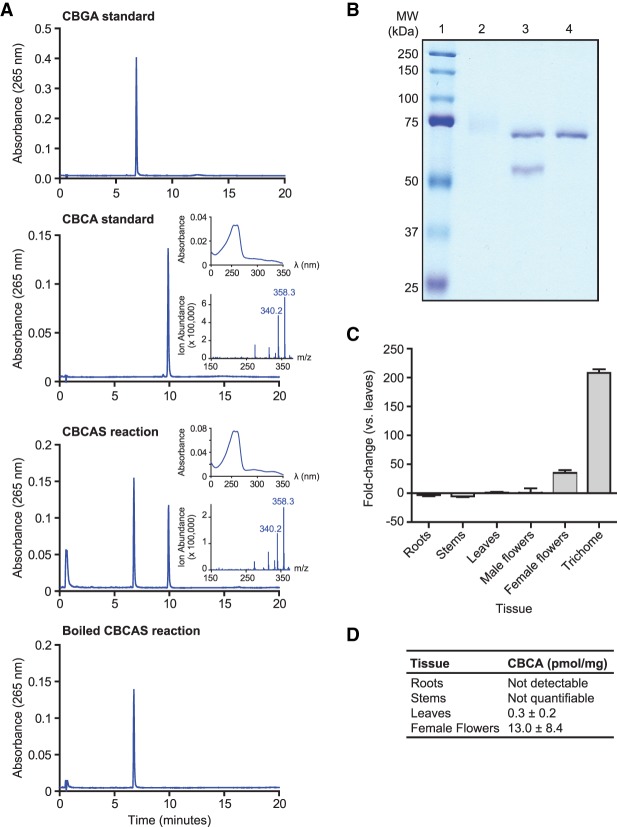
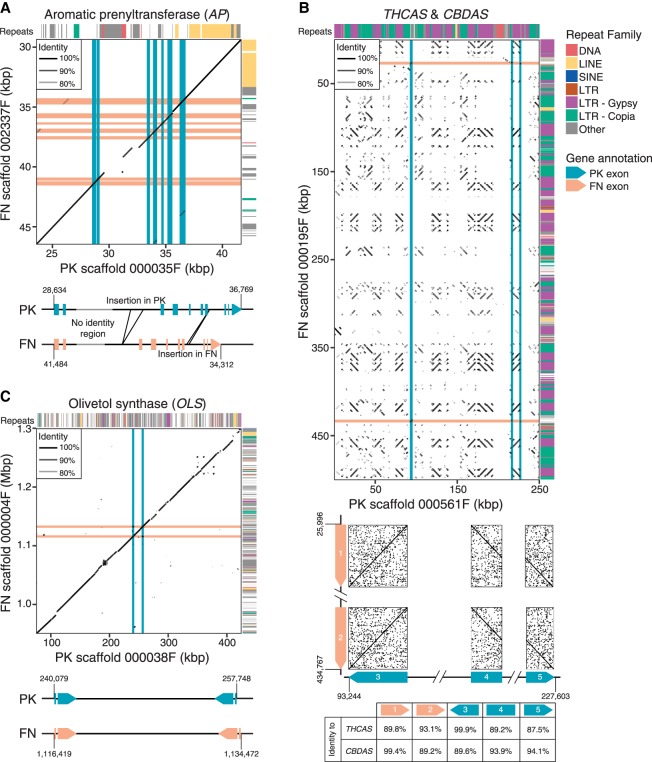
Cannabis sativa is widely cultivated for medicinal, food, industrial, and recreational use, but much remains unknown regarding its genetics, including the molecular determinants of cannabinoid content. Here, we describe a combined physical and genetic map derived from a cross between the drug-type strain Purple Kush and the hemp variety "Finola." The map reveals that cannabinoid biosynthesis genes are generally unlinked but that aromatic prenyltransferase (AP), which produces the substrate for THCA and CBDA synthases (THCAS and CBDAS), is tightly linked to a known marker for total cannabinoid content. We further identify the gene encoding CBCA synthase (CBCAS) and characterize its catalytic activity, providing insight into how cannabinoid diversity arises in cannabis. THCAS and CBDAS (which determine the drug vs. hemp chemotype) are contained within large (>250 kb) retrotransposon-rich regions that are highly nonhomologous between drug- and hemp-type alleles and are furthermore embedded within ∼40 Mb of minimally recombining repetitive DNA. The chromosome structures are similar to those in grains such as wheat, with recombination focused in gene-rich, repeat-depleted regions near chromosome ends. The physical and genetic map should facilitate further dissection of genetic and molecular mechanisms in this commercially and medically important plant.
© 2019 Laverty et al.; Published by Cold Spring Harbor Laboratory Press.
Figures
Similar articles
-
The genetics of Cannabis-genomic variations of key synthases and their effect on cannabinoid content.Genome. 2021 Apr;64(4):490-501. doi: 10.1139/gen-2020-0087. Epub 2020 Nov 13. Genome. 2021. PMID: 33186070 Review.
-
A new Cannabis genome assembly associates elevated cannabidiol (CBD) with hemp introgressed into marijuana.New Phytol. 2021 May;230(4):1665-1679. doi: 10.1111/nph.17243. Epub 2021 Feb 28. New Phytol. 2021. PMID: 33521943 Free PMC article.
-
Gene duplication and divergence affecting drug content in Cannabis sativa.New Phytol. 2015 Dec;208(4):1241-50. doi: 10.1111/nph.13562. Epub 2015 Jul 17. New Phytol. 2015. PMID: 26189495
-
Validating a predictive model of cannabinoid inheritance with feral, clinical, and industrial Cannabis sativa.Am J Bot. 2020 Oct;107(10):1423-1432. doi: 10.1002/ajb2.1550. Epub 2020 Oct 25. Am J Bot. 2020. PMID: 33103246 Free PMC article.
-
Recent advances in Cannabis sativa research: biosynthetic studies and its potential in biotechnology.Curr Pharm Biotechnol. 2007 Aug;8(4):237-43. doi: 10.2174/138920107781387456. Curr Pharm Biotechnol. 2007. PMID: 17691992 Review.
Cited by
-
Origin and Evolution of the Cannabinoid Oxidocyclase Gene Family.Genome Biol Evol. 2021 Aug 3;13(8):evab130. doi: 10.1093/gbe/evab130. Genome Biol Evol. 2021. PMID: 34100927 Free PMC article.
-
Large-scale whole-genome resequencing unravels the domestication history of Cannabis sativa.Sci Adv. 2021 Jul 16;7(29):eabg2286. doi: 10.1126/sciadv.abg2286. Print 2021 Jul. Sci Adv. 2021. PMID: 34272249 Free PMC article.
-
Genetic insights into agronomic and morphological traits of drug-type cannabis revealed by genome-wide association studies.Sci Rep. 2024 Apr 22;14(1):9162. doi: 10.1038/s41598-024-58931-w. Sci Rep. 2024. PMID: 38644388 Free PMC article.
-
Population genomics of a natural Cannabis sativa L. collection from Iran identifies novel genetic loci for flowering time, morphology, sex and chemotyping.BMC Plant Biol. 2025 Jan 21;25(1):80. doi: 10.1186/s12870-025-06045-4. BMC Plant Biol. 2025. PMID: 39838336 Free PMC article.
-
Back to the plant: overcoming roadblocks to the microbial production of pharmaceutically important plant natural products.J Ind Microbiol Biotechnol. 2020 Oct;47(9-10):815-828. doi: 10.1007/s10295-020-02300-9. Epub 2020 Aug 9. J Ind Microbiol Biotechnol. 2020. PMID: 32772209 Review.
References
Publication types
MeSH terms
Substances
Grants and funding
LinkOut - more resources
Full Text Sources
Other Literature Sources
Miscellaneous