. 2019 Apr;104(4):678-689.
doi: 10.3324/haematol.2018.198382. Epub 2018 Nov 8.

Gastrointestinal iron excretion and reversal of iron excess in a mouse model of inherited iron excess

Affiliations

Gastrointestinal iron excretion and reversal of iron excess in a mouse model of inherited iron excess

Courtney J Mercadante et al. Haematologica. 2019 Apr.

Abstract

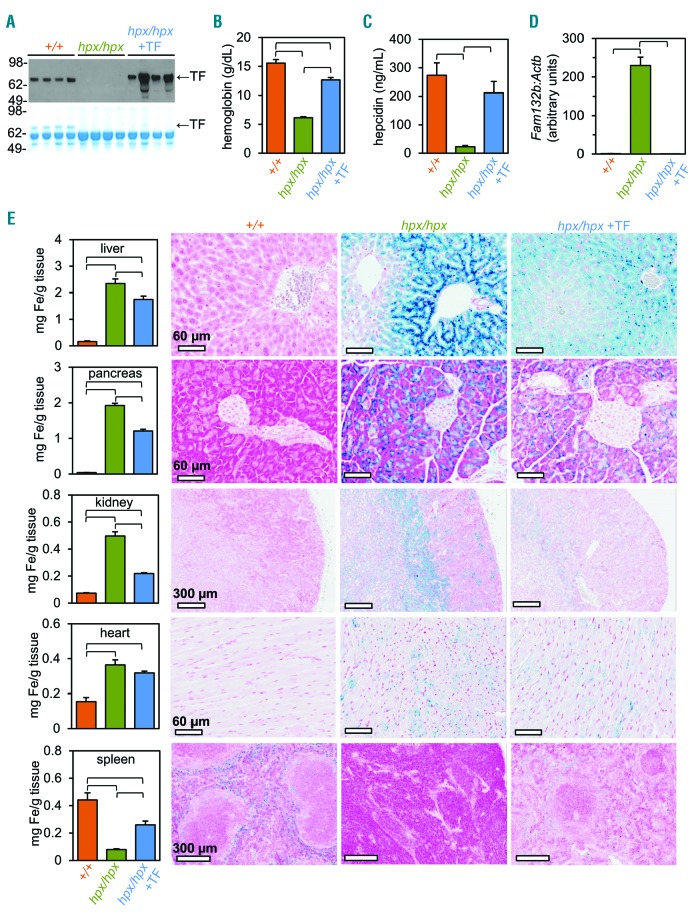
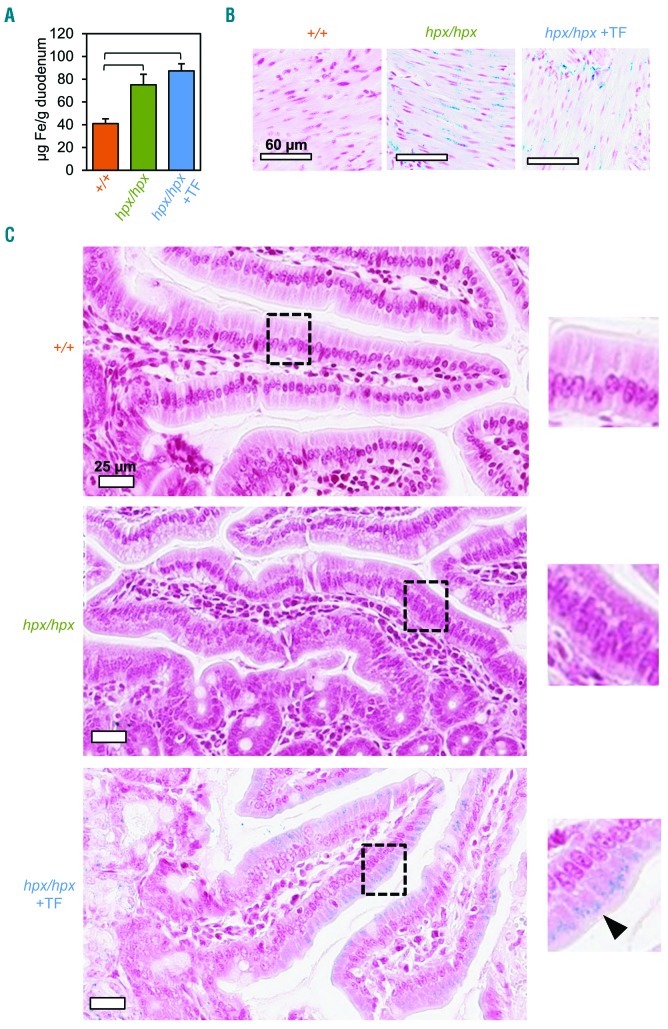
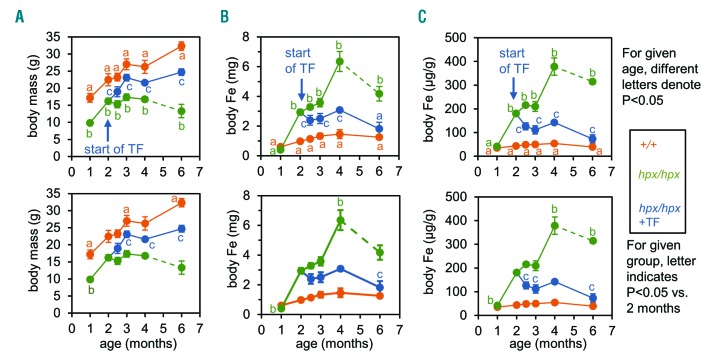
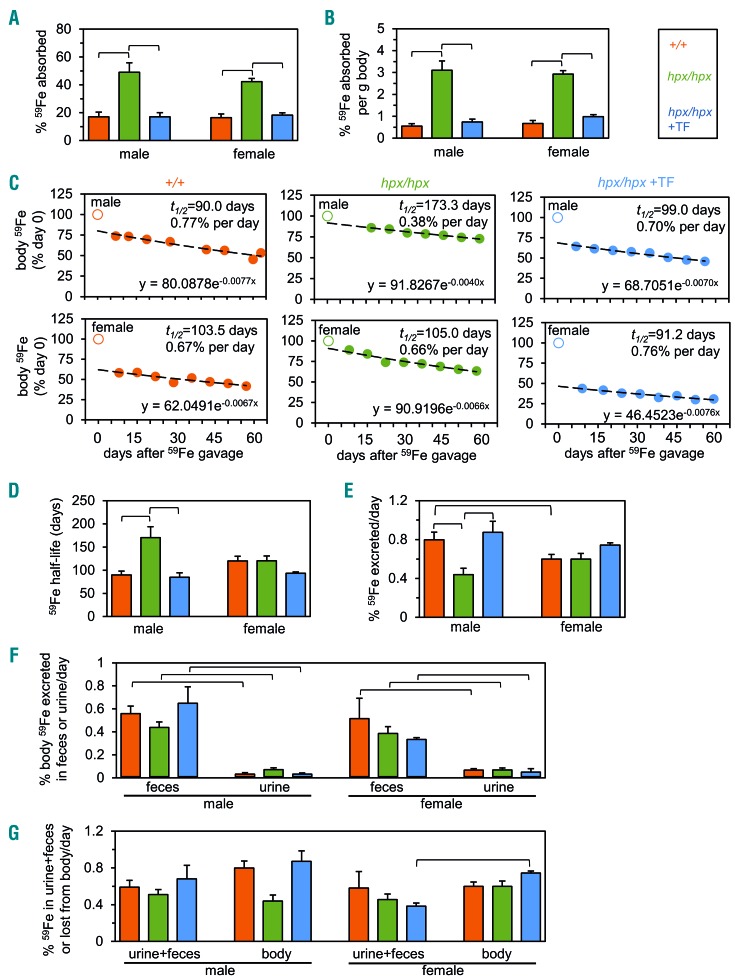
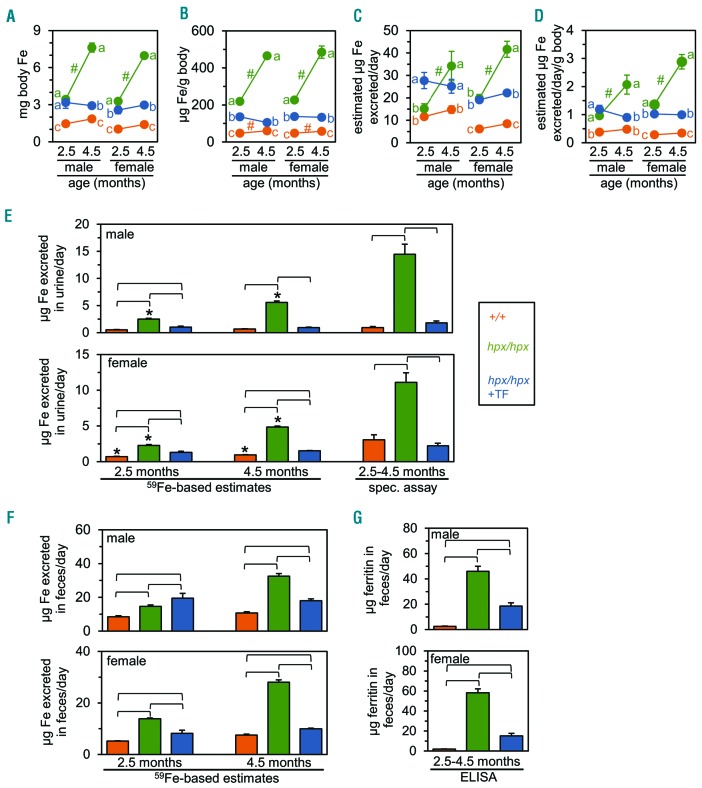
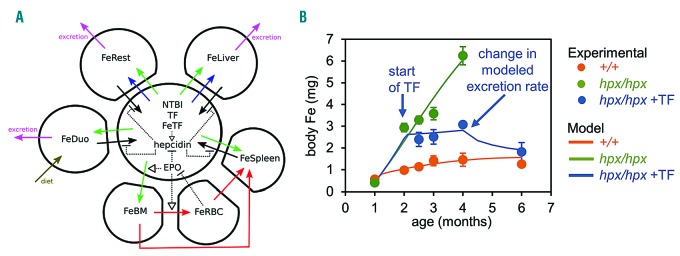
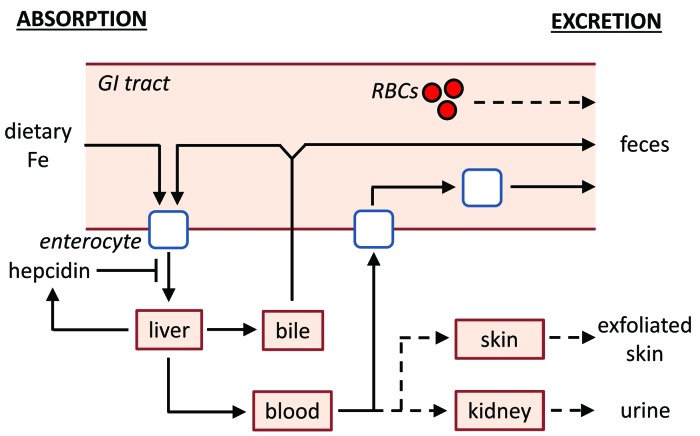
The current paradigm in the field of mammalian iron biology states that body iron levels are determined by dietary iron absorption, not by iron excretion. Iron absorption is a highly regulated process influenced by iron levels and other factors. Iron excretion is believed to occur at a basal rate irrespective of iron levels and is associated with processes such as turnover of intestinal epithelium, blood loss, and exfoliation of dead skin. Here we explore iron excretion in a mouse model of iron excess due to inherited transferrin deficiency. Iron excess in this model is attributed to impaired regulation of iron absorption leading to excessive dietary iron uptake. Pharmacological correction of transferrin deficiency not only normalized iron absorption rates and halted progression of iron excess but also reversed body iron excess. Transferrin treatment did not alter the half-life of 59Fe in mutant mice. 59Fe-based studies indicated that most iron was excreted via the gastrointestinal tract and suggested that iron-loaded mutant mice had increased rates of iron excretion. Direct measurement of urinary iron levels agreed with 59Fe-based predictions that urinary iron levels were increased in untreated mutant mice. Fecal ferritin levels were also increased in mutant mice relative to wild-type mice. Overall, these data suggest that mice have a significant capacity for iron excretion. We propose that further investigation into iron excretion is warranted in this and other models of perturbed iron homeostasis, as pharmacological targeting of iron excretion may represent a novel means of treatment for diseases of iron excess.


Figures

Figure 1.
Figure 1.
Short-term transferrin treatment reduces tissue iron excess in Trfhpx/hpx mice. (A-D) Trf+/+ (‘+/+’), untreated Trfhpx/hpx (‘hpx/hpx’), and transferrin (TF)-treated Trfhpx/hpx (‘hpx/hpx +TF’) mice were analyzed at 2.5 months of age. Treated mice were injected with TF from 2 to 2.5 months of age. (A) Serum TF levels, measured by immunoblot (top) and Coomassie-stained protein gel (bottom). (B) Hemoglobin levels, measured by complete blood count. (C) Plasma hepcidin levels, measured by ELISA. (D) Splenic RNA level ratios of Fam132b to Actb (β-actin), measured by quantitative polymerase chain reaction and normalized to Trf+/+ levels. (E) Organ iron (Fe) levels (left panels), measured by inductively coupled plasma absorption emission spectrometry, and tissue Fe distribution (right micrographs), assessed by tissue Fe stain. In (B-E), data are represented as the mean ± standard error of mean. Brackets indicate statistical significance (P<0.05) calculated by one-way analysis of variance with a Holm-Sidak post-hoc test. Each value represents data from five mice, with males and females grouped together.
Figure 2.
Figure 2.
Trfhpx/hpx mice accumulate iron in the duodenum. (A-C) Mice from Figure 1 were analyzed for duodenal iron (Fe) levels by inductively coupled plasma absorption emission spectrometry (A) and tissue Fe staining in duodenal smooth muscle (B) and villi (C). In (A), data are represented as the mean ± standard error of mean. Brackets indicate statistical significance (P<0.05) calculated by one-way analysis of variance with a Holm-Sidak post-hoc test. Each value represents data from five mice, with males and females grouped together. In (C), the arrowhead indicates detectable Fe staining in duodenal enterocytes.
Figure 3.
Figure 3.
Long-term transferrin treatment corrects body iron excess in Trfhpx/hpx mice. (A-C) Body masses (A) and iron (Fe) levels (B) and concentrations (C), measured in Trf+/+ mice (‘+/+’, orange) and untreated Trfhpx/hpx mice (‘hpx/hpx’, green) from 1 to 6 months of age and in Trfhpx/hpx mice treated with transferrin (TF) from 2 to 6 months of age (‘hpx/hpx +TF’, blue). Top and bottom graphs differ only by markers of significance (P<0.05) assessed by two-way analysis of variance with a Holm-Sidak post-hoc test. In top panels, for a given age, different letters indicate values that differ significantly. In bottom panels, for a given group, the letter indicates that a value differs significantly from the 2-month old value. In all panels, dashed lines indicate that only two untreated Trfhpx/hpx mice survived to 6 months. Data are represented as mean ± standard error of mean: each value represents data from five mice, with males and females grouped together.
Figure 4.
Figure 4.
Trf+/+ and treated Trfhpx/hpx mice have similar 59Fe absorption rates and half-lives and excrete iron largely via the gastrointestinal tract. (A) Percent 59Fe absorbed, measured after 59Fe gavage of male and female 2.5-month old Trf+/+ mice (‘+/+’, orange), untreated Trfhpx/hpx mice (‘hpx/hpx’, green), and Trfhpx/hpx mice treated with transferrin (TF) (‘hpx/hpx +TF’, blue) from 2 to 2.5 months of age. Percent 59Fe absorbed was calculated as the sum of body and urinary 59Fe levels expressed as a percent of body, urine, and feces 59Fe levels. (B) Values from (A) normalized to body size. (C) Representative plots of body 59Fe levels from 2.5 to 4.5 months of age in Trf+/+ mice, untreated Trfhpx/hpx mice, and Trfhpx/hpx mice treated with TF from 2 months of age (“hpx/hpx +TF”, blue). ‘Day 0’ indicates the day after 59Fe gavage. Unfilled circles at day 0 indicate that these points were excluded from lines of best fit. Exponential decay equations, 59Fe half-lives (t1/2), and percent 59Fe excreted per day are included in each graph. (D) 59Fe half-lives, calculated by exponential decay equations from (C). (E) Percent 59Fe excreted per day, or ‘59Fe excretion rates’, calculated by exponential decay equations from (C). (F) Percent body 59Fe excreted per day via feces or urine in mice from 2.5 to 4.5 months of age. Feces and urine were collected by housing each mouse overnight in metabolic cages at least three times during the excretion study. (G) Sums of fecal and urinary 59Fe values from (F) (“urine+feces”) compared to body 59Fe excretion rates from (E) (“body loss”). In all panels except (C), data are represented as mean ± standard error of mean with each value shown representing data from at least five mice and brackets indicating P<0.05. Statistical significance was calculated by one-way analysis of variance with a Holm-Sidak post-hoc test in (A, B, D, E) and by a two-tailed t-test in (F, G).
Figure 5.
Figure 5.
59Fe-based analyses predict relative abundance of urinary iron and fecal ferritin in Trf mice. (A, B) Body iron (Fe) levels (A) and concentrations (B) in Trf+/+ mice (‘+/+’, orange), untreated Trfhpx/hpx mice (‘hpx/hpx’, green), and Trfhpx/hpx mice treated with transferrin (TF) (‘hpx/hpx +TF’, blue) harvested at 2.5 months or 4.5 months of age at the end of the excretion study shown in Figure 4. (C) μg Fe excreted per day, calculated by multiplying values in Figure 4E by values in (A). (D) μg Fe excreted per day normalized to body size, calculated by multiplying values in Figure 4E by values in (B). (E) μg Fe excreted per day in urine. 59Fe-based estimates were calculated by multiplying urinary values in Figure 4F by values in (A). Spectrophotometric measurements (‘spec assay’) were calculated by acid digest and BPS-based assay as described in the Online Supplementary Methods. (F) μg Fe excreted per day in feces, estimated by multiplying fecal values in Figure 4F by values in (A). (G) µg ferritin excreted per day in feces measured by enzyme-linked immunosorbent assay. In all panels, data are represented as mean ± standard error of mean; each value shown represents data from at least five mice. In (A-D), at a given age, different letters indicate P<0.05 between values, calculated by one-way analysis of variance with a Holm-Sidak post-hoc test; ‘#’ indicates P<0.05 between values from 2.5- and 4.5-month old mice, calculated by a two-tailed t-test. In (E- G), brackets indicate P<0.05, calculated by one-way analysis of variance with a Holm-Sidak post-hoc test. In (E), asterisks indicate P<0.05 between 59Fe-based and spectrophotometry-based values, calculated by a two-tailed t-test.
Figure 6.
Figure 6.
Mathematical modeling predicts increased excretion rates in treated Trfhpx/hpx mice. (A) The iron (Fe) homeostasis scheme used for mathematical modeling of body Fe levels from Figure 3B. Closed polygons represent liver, spleen, red blood cells (RBC), bone marrow (BM), duodenum (Duo), or ‘rest of body’ (Rest), the last comprising stomach, intestines except the duodenum, integument, muscles, heart, fat, lungs, kidneys, brain, and reproductive organs. The circle represents plasma. Dietary Fe is absorbed into the duodenum (solid dark green arrow) and exported to plasma by ferroportin (solid black arrow). Plasma Fe, in states of Fe homeostasis, exists as Fe-loaded transferrin (FeTF) which is imported into all compartments (solid light green arrows) except RBC or, in states of Fe excess, as non-transferrin-bound iron (NTBI) which is imported into the liver and rest of the body (solid blue arrows). Bone marrow Fe is incorporated into RBC and recycled in the spleen (solid red arrows); direct Fe transfer from the bone marrow to the spleen represents recycling of immature erythroid cells in the spleen (solid red arrows). Fe can be exported from compartments by ferroportin (solid black arrows). FeTF stimulates hepcidin expression (dashed black arrow), which inhibits ferroportin-dependent Fe export from compartments (dashed blunt-ended lines). Erythropoietin (EPO) stimulates FeTF import into the bone marrow, transfer of Fe from the bone marrow to RBC, and suppression of hepcidin activity. EPO is suppressed by increased RBC Fe levels. Fe can be excreted from the liver, duodenum, and the rest of the body (solid magenta lines). (B) Results of mathematical modeling. Experimental values from Figure 3B are shown as circles. Modeled values are shown as lines.
Figure 7.
Figure 7.
Model of iron absorption and excretion. Dietary non-heme iron (Fe) is absorbed by enterocytes in the small intestine. Enterocytes export Fe into the blood; this process can be inhibited by hepcidin. Fe is then transported to the liver for storage, excretion, or distribution to other organs in the body. Fe can be excreted by the liver into bile and transported into the small intestine, where it can undergo enterohepatic circulation or can be eliminated from the body via the feces. Fe can also be excreted from the body by turnover of epithelial cells lining the intestines or from minor trauma to intestinal epithelium leading to blood loss. Dashed lines indicate minor routes of Fe excretion, which include blood loss, exfoliation of dead skin, and excretion via the urine. For the sake of simplicity, not all organs or pathways of Fe transport are shown, including those that mediate heme Fe absorption.

References

    1. Coffey R, Ganz T. Iron homeostasis: an anthropocentric perspective. J Biol Chem. 2017;292(31):12727–12734. - PMC - PubMed
    1. Dev S, Babitt JL. Overview of iron metabolism in health and disease. Hemodial Int Int Symp Home Hemodial. 2017;21 (Suppl 1) S6–S20. - PMC - PubMed
    1. Muckenthaler MU, Rivella S, Hentze MW, Galy B. A red carpet for iron metabolism. Cell. 2017;168(3):344–361. - PMC - PubMed
    1. Papanikolaou G, Pantopoulos K. Systemic iron homeostasis and erythropoiesis. IUBMB Life. 2017;69(6):399–413. - PubMed
    1. Wallace DF. The regulation of iron absorption and homeostasis. Clin Biochem Rev. 2016;37(2):51–62. - PMC - PubMed

Publication types