

Emergence of phytoplankton patchiness at small scales in mild turbulence
- PMID: 30409800
- PMCID: PMC6275516
- DOI: 10.1073/pnas.1808711115
Emergence of phytoplankton patchiness at small scales in mild turbulence
Abstract
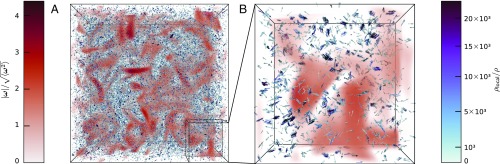
Phytoplankton often encounter turbulence in their habitat. As most toxic phytoplankton species are motile, resolving the interplay of motility and turbulence has fundamental repercussions on our understanding of their own ecology and of the entire ecosystems they inhabit. The spatial distribution of motile phytoplankton cells exhibits patchiness at distances of decimeter to millimeter scales for numerous species with different motility strategies. The explanation of this general phenomenon remains challenging. Furthermore, hydrodynamic cell-cell interactions, which grow more relevant as the density in the patches increases, have been so far ignored. Here, we combine particle simulations and continuum theory to study the emergence of patchiness in motile microorganisms in three dimensions. By addressing the combined effects of motility, cell-cell interaction, and turbulent flow conditions, we uncover a general mechanism: The coupling of cell-cell interactions to the turbulent dynamics favors the formation of dense patches. Identification of the important length and time scales, independent from the motility mode, allows us to elucidate a general physical mechanism underpinning the emergence of patchiness. Our results shed light on the dynamical characteristics necessary for the formation of patchiness and complement current efforts to unravel planktonic ecological interactions.
Keywords: patchiness; phytoplankton; turbulence.
Conflict of interest statement
The authors declare no conflict of interest.
Figures

References
-
- Lewis DM, Pedley TJ. Planktonic contact rates in homogeneous isotropic turbulence: Theoretical predictions and kinematic simulations. J Theor Biol. 2000;205:377–408. - PubMed
-
- Prairie JC, Sutherland KR, Nickols KJ, Kaltenberg AM. Biophysical interactions in the plankton: A cross-scale review. Limnol Oceanogr Fluids Environ. 2012;2:121–145.
-
- Smayda TJ. Harmful algal blooms: Their ecophysiology and general relevance to phytoplankton blooms in the sea. Limnol Oceanogr. 1997;42:1137–1153.
-
- Bainbridge R. The size, shape and density of marine phytoplankton concentrations. Biol Rev. 1957;32:91–115.
-
- Martin AP. Phytoplankton patchiness: The role of lateral stirring and mixing. Prog Oceanogr. 2003;57:125–174.
Publication types
MeSH terms
LinkOut - more resources
Full Text Sources
Research Materials
