. 2018 Dec 12;11(12):dmm035097.
doi: 10.1242/dmm.035097.

Establishment of a murine culture system for modeling the temporal progression of cranial and trunk neural crest cell differentiation

Affiliations

Establishment of a murine culture system for modeling the temporal progression of cranial and trunk neural crest cell differentiation

Maria R Replogle et al. Dis Model Mech. .

Abstract

The neural crest (NC) is a transient population of embryonic progenitors that are implicated in a diverse range of congenital birth defects and pediatric syndromes. The broad spectrum of NC-related disorders can be attributed to the wide variety of differentiated cell types arising from the NC. In vitro models of NC development provide a powerful platform for testing the relative contributions of intrinsic and extrinsic factors mediating NC differentiation under normal and pathogenic conditions. Although differentiation is a dynamic process that unfolds over time, currently, there is no well-defined chronology that characterizes the in vitro progression of NC differentiation towards specific cell fates. In this study, we have optimized culture conditions for expansion of primary murine NC cells that give rise to both ectodermal and mesoectodermal derivatives, even after multiple passages. Significantly, we have delineated highly reproducible timelines that include distinct intermediate stages for lineage-specific NC differentiation in vitro In addition, isolating both cranial and trunk NC cells from the same embryos enabled us to make direct comparisons between the two cell populations over the course of differentiation. Our results define characteristic changes in cell morphology and behavior that track the temporal progression of NC cells as they differentiate along the neuronal, glial and chondrogenic lineages in vitro These benchmarks constitute a chronological baseline for assessing how genetic or environmental disruptions may facilitate or impede NC differentiation. Introducing a temporal dimension substantially increases the power of this platform for screening drugs or chemicals for developmental toxicity or therapeutic potential. This article has an associated First Person interview with the first author of the paper.

Keywords: Chondrogenic differentiation; Differentiation timeline; Glial differentiation; In vitro model of neural crest differentiation; Neuronal differentiation; Sox9.


Conflict of interest statement

Competing interestsM.R.R., V.S.S., M.D.L., K.R.S. and A.J.U. have no conflicts of interest to disclose. V.M.L. is currently an employee of STEMCELL Technologies, which provided the Complete MesenCult™ Adipogenic Medium used in this study.

Figures
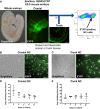
Fig. 1.
Fig. 1.
Isolation and growth profile for primary cranial and trunk NC cells in culture. (A) Workflow for isolating primary NC cells via FACS. Cranial or trunk tissues were dissected (dotted lines) from Sox9cre; R26R-EYFP mouse embryos at E9.5. Tissues were dissociated into single cells and sorted via FACS. Sorted EYFP-positive NC cells were cultured in basal medium and passaged every 4 days. (B) Cranial NC cells. (C) Trunk NC cells. (D,E) Doubling times for cultured cranial (D) and trunk (E) NC cells were calculated over five passages. Average doubling time was 44 h and 39 h for cranial and trunk NC, respectively. Neither cell population showed a statistically significant difference in doubling time across the five passages (repeated measures one-way ANOVA). All cells are derived from Sox9cre; R26R-EYFP mice and express EYFP (green). Values represent mean±s.e.m. (n=3). Scale bars: (A) 200 µm; (B,C) 100 µm.
Fig. 2.
Fig. 2.
Maintenance of gene expression associated with NC cell identity and self-renewal. (A) Workflow for RT-qPCR analysis. RNA was extracted from a sample of cells at each passage. Expression of NC cell markers (AP2α, Snail1, Sox9, Sox10), and that of stem cell-like marker (Nes), were assessed every 4 days as cells were passaged over 20 days in culture. The cultured NC cells displayed a mesenchymal morphology at each time point across three independent cell isolates. (B,C) Neither the cranial (B) nor the trunk (C) NC cells showed a statistically significant change in the relative expression of these genes across five passages (two-way ANOVA). All cells are derived from Sox9cre; R26R-EYFP mice and express EYFP (green). Values represent mean±s.e.m. (n=6; three independent cell isolates carried out in duplicate). Scale bar: 50 µm.
Fig. 3.
Fig. 3.
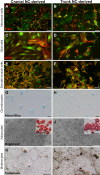
Differentiation potential of cultured primary cranial and trunk NC cells. Both cranial and trunk NC cells gave rise to known NC derivatives when grown under conditions reported to induce lineage-specific differentiation. (A–L) Representative images of differentiated cells: neuronal cells (A,B; TUJ1, red; 4 days in differentiation medium containing NT3 and NGF), glial cells (C,D; GFAP, red; 8 days in differentiation medium containing BMP2 and LIF), smooth muscle cells (E,F; αSMA, orange; 7 days in differentiation medium containing FCS), chondrocytes (G,H; Alcian Blue staining; 6 days (G) and 14 days (H) in differentiation medium containing TGF-β3), adipocytes [I,J; brightfield (insets, Oil Red O staining); 14 days in Adipogenic Medium from STEMCELL Technologies] and melanocytes (K,L; tyrosinase, brown; 10 days in differentiation medium containing ET3). All cells are derived from Sox9cre; R26R-EYFP mice and express EYFP (green). Cells were expanded for three passages (12 days in culture) prior to differentiation. Differentiation into each of the derivatives was consistent across replicates (n=6; duplicate cultures from each of three independent cell isolates). Scale bars: (A–D) 50 µm; (E–L) 100 µm.
Fig. 4.
Fig. 4.
Temporal progression of neuronal differentiation in cultured cranial and trunk NC cells. (A–H) Neuronal differentiation was assessed at various time points via immunostaining for TUJ1, a neuron-specific class III β-tubulin. Robust expression of TUJ1 was observed at Day 2 (A,B). Higher magnification views of the boxed regions show an observable decrease in soma size when comparing TUJ1-negative cells displaying a mesenchymal morphology (A′,B′; white lines) and cells positive for TUJ1 that display a neuronal-like morphology (A″,B″; cyan lines). Neuritic outgrowth continued through Day 4 in both cell populations (C,D). In addition, in trunk NC-derived cells, TUJ1-positive cells formed discrete aggregates (D; arrowhead); however, similar aggregation was not observed in cells derived from the cranial NC at this time point. By Day 6, the difference in aggregation between the cell populations became more apparent (E,F). Whereas TUJ1-positive aggregates derived from the trunk NC were tightly compacted (F), TUJ1-positive aggregates derived from the cranial NC were loosely formed (E; arrowheads). At Day 8, TUJ1-positive cells derived from the cranial NC maintained a similar phenotype as seen in Day 6 (G). In contrast, TUJ1-positive cells derived from the trunk NC displayed enhanced aggregation, coupled with extensive neuritic outgrowth (H). Phenotypic characteristics of the cells at each time point were consistently observed (n=6; duplicate cultures from each of three independent cell isolates). All cells are derived from Sox9cre; R26R-EYFP mice and express EYFP (green). Red staining=TUJ1. Scale bars: 50 µm.
Fig. 5.
Fig. 5.
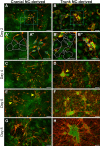
Cultured cranial and trunk NC cells exhibit differential HuC/D localization during neuronal differentiation. Neuronal differentiation was assessed at various time points via immunostaining for HuC/D, a pan-neuronal marker recognizing neuron-specific RNA-binding proteins. Robust HuC/D expression was observed after 2 days in differentiation medium (A,B). By Day 4, a difference in HuC/D localization in neuritic processes between the cell populations was observed (C,D; arrowheads). Higher magnification views of the boxed regions show HuC/D localized to the soma and neuritic process of cells derived from the cranial NC (C′,C″; arrowheads); however, HuC/D expression was only observed in the soma of cells derived from the trunk NC and was absent from the neuritic processes (D′,D″; arrowheads). Differences in HuC/D localization between the cell populations persisted through Day 8 (E–H). Phenotypic characteristics of the cells at each time point were consistently observed (n=6; duplicate cultures from each of three independent cell isolates). All cells are derived from Sox9cre; R26R-EYFP mice and express EYFP (green). Red staining=HuC/D. Scale bars: (A–D,E–H) 50 µm; (C′,C″,D′,D″) 25 µm.
Fig. 6.
Fig. 6.
Primary cranial and trunk NC cells display distinct morphological transitions during the temporal progression of glial differentiation in vitro. Glial differentiation was assessed via immunostaining for GFAP after 4, 10 or 14 days in differentiation medium. GFAP-positive cells were observed in both cranial and trunk NC cell populations at Day 4 (A,B). By Day 10, some of the GFAP-positive cells extended flattened, sheet-like processes (C,D; asterisks) while the other GFAP-positive cells displayed an elongated, spindle-like morphology (C,D; arrowheads). After 14 days, most GFAP-positive cells in both populations exhibited an elongated, bipolar morphology and cells extending flattened, sheet-like processes were only occasionally observed (E,F). Phenotypic characteristics of the cells at each time point were consistently observed (n=6; duplicate cultures from each of three independent cell isolates). All cells are derived from Sox9cre; R26R-EYFP mice and express EYFP (green). Red staining=GFAP. Scale bars: 100 µm.
Fig. 7.
Fig. 7.
Cranial NC-derived chondrocytes form distinct nodules and produce cartilage matrix in vitro over time. (A–J) Cell morphology and cartilage matrix production were analyzed at various time points via immunostaining for Type II collagen (Col2a1) (A–D), and Alcian Blue staining (E–J). After 4 days in differentiation medium, Col2a1-positive cells displayed a cuboidal morphology (A). Higher magnification views of the boxed regions highlight the difference between Col2a1-negative cells, which display a mesenchymal morphology (A′; white lines), and Col2a1-positive cells, which display a cuboidal morphology (A″; cyan lines). At this same time point, parallel cultures showed faint Alcian Blue staining (E). By Day 6, Col2a1-positive cells began to form chondrogenic nodules that stained positive for Alcian Blue (B,F; arrowheads). At later stages of chondrogenic differentiation, chains of chondrocytes producing cartilage matrix could be seen emanating from the nodules (C,D,G,H; arrows). Higher magnification views of the boxed regions show chondrocytes that appear aligned, forming chains of cells that emanate from the nodules at Day 8 and Day 14 (C′,D′; cyan lines). In addition, the number of chondrogenic nodules increased over time. (I,J) In order to obtain a representative field of view of the entire culturing surface, four images from overlapping fields of view were aligned and stitched using the open source Hugin software (http://www.hugin.sourceforge.net). Nodules were first observed in distinct regions of the well at Day 6 (I), but by Day 14 had spread throughout the well (J). Boxed regions in I and J correspond to the higher magnification images in F and H, respectively. (K,L) Quantification of chondrogenic nodule number (K) and cartilage matrix accumulation (L) further demonstrates the increase in nodule formation over time. Experiments were repeated from three independent cell isolates, each in duplicate. Each dot represents one technical replicate, grouped by biological isolate. Black horizontal lines indicate the grand mean across replicates. *P<0.05, ****P<0.0001 vs undifferentiated cells (two-way ANOVA). All cells are derived from Sox9cre; R26R-EYFP mice and express EYFP (green). Magenta staining=Col2a1. Scale bars: (A–H) 100 µm; (I,J) 1 mm.

Similar articles

Cited by

References

    1. Akamatsu W., Okano H. J., Osumi N., Inoue T., Nakamura S., Sakakibara S.-I., Miura M., Matsuo N., Darnell R. B. and Okano H. (1999). Mammalian ELAV-like neuronal RNA-binding proteins HuB and HuC promote neuronal development in both the central and the peripheral nervous systems. Proc. Natl. Acad. Sci. USA 96, 9885-9890. 10.1073/pnas.96.17.9885 - DOI - PMC - PubMed
    1. Akiyama H., Kim J.-E., Nakashima K., Balmes G., Iwai N., Deng J. M., Zhang Z., Martin J. F., Behringer R. R., Nakamura T. et al. (2005). Osteo-chondroprogenitor cells are derived from Sox9 expressing precursors. Proc. Natl. Acad. Sci. USA 102, 14665-14670. 10.1073/pnas.0504750102 - DOI - PMC - PubMed
    1. Anderson K. D., Morin M. A., Beckel-Mitchener A., Mobarak C. D., Neve R. L., Furneaux H. M., Burry R. and Perrone-Bizzozero N. I. (2000). Overexpression of HuD, but not of its truncated form HuD I+II, promotes GAP-43 gene expression and neurite outgrowth in PC12 cells in the absence of nerve growth factor. J. Neurochem. 75, 1103-1114. 10.1046/j.1471-4159.2000.0751103.x - DOI - PubMed
    1. Anderson K. D., Sengupta J., Morin M., Neve R. L., Valenzuela C. F. and Perrone-Bizzozero N. I. (2001). Overexpression of HuD accelerates neurite outgrowth and increases GAP-43 mRNA expression in cortical neurons and retinoic acid-induced embryonic stem cells in vitro. Exp. Neurol. 168, 250-258. 10.1006/exnr.2000.7599 - DOI - PubMed
    1. Baggiolini A., Varum S., Mateos J. M., Bettosini D., John N., Bonalli M., Ziegler U., Dimou L., Clevers H., Furrer R. et al. (2015). Premigratory and migratory neural crest cells are multipotent in vivo. Cell Stem Cell 16, 314-322. 10.1016/j.stem.2015.02.017 - DOI - PubMed

Publication types