. 2019 Feb 1;25(3):1000-1011.
doi: 10.1158/1078-0432.CCR-18-0963. Epub 2018 Nov 8.

IND-Enabling Studies for a Clinical Trial to Genetically Program a Persistent Cancer-Targeted Immune System

Affiliations

IND-Enabling Studies for a Clinical Trial to Genetically Program a Persistent Cancer-Targeted Immune System

Cristina Puig-Saus et al. Clin Cancer Res. .

Abstract

Purpose: To improve persistence of adoptively transferred T-cell receptor (TCR)-engineered T cells and durable clinical responses, we designed a clinical trial to transplant genetically-modified hematopoietic stem cells (HSCs) together with adoptive cell transfer of T cells both engineered to express an NY-ESO-1 TCR. Here, we report the preclinical studies performed to enable an investigational new drug (IND) application.

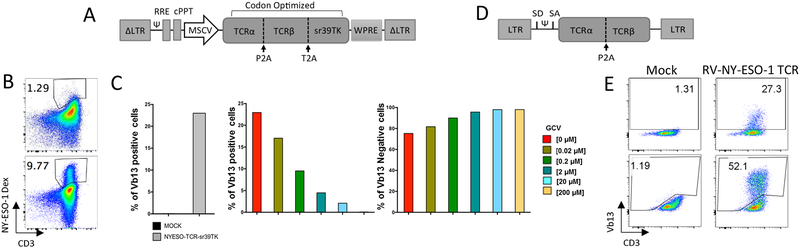
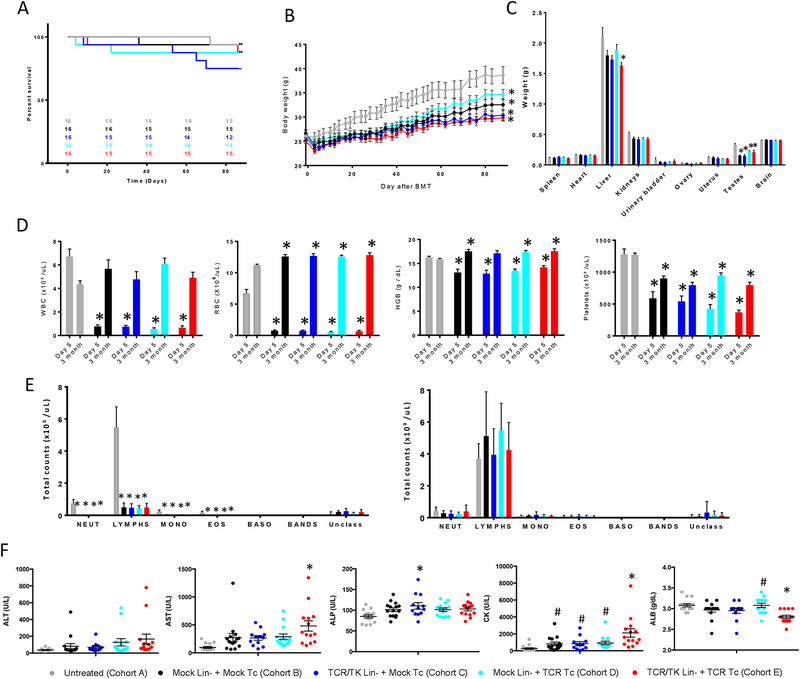
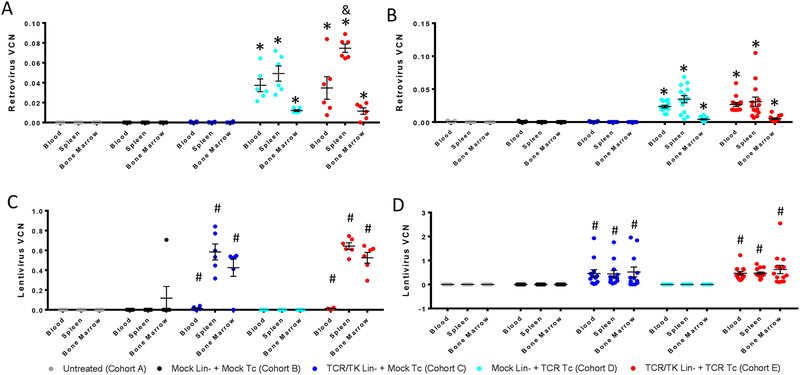
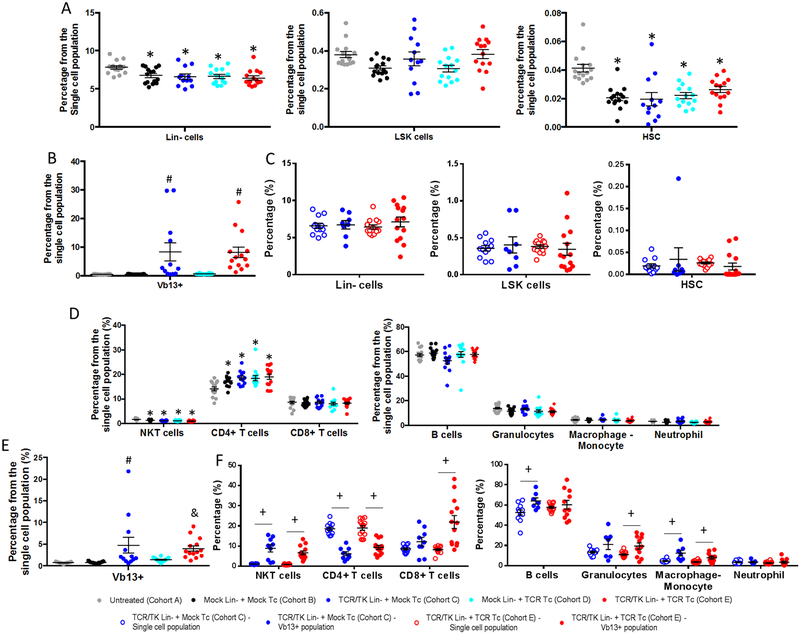
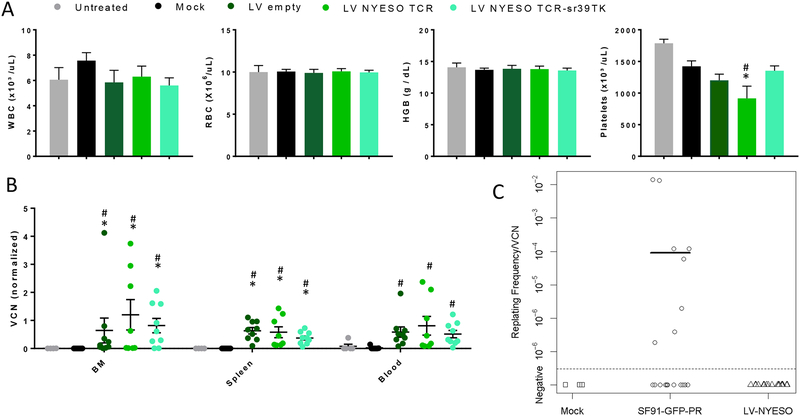
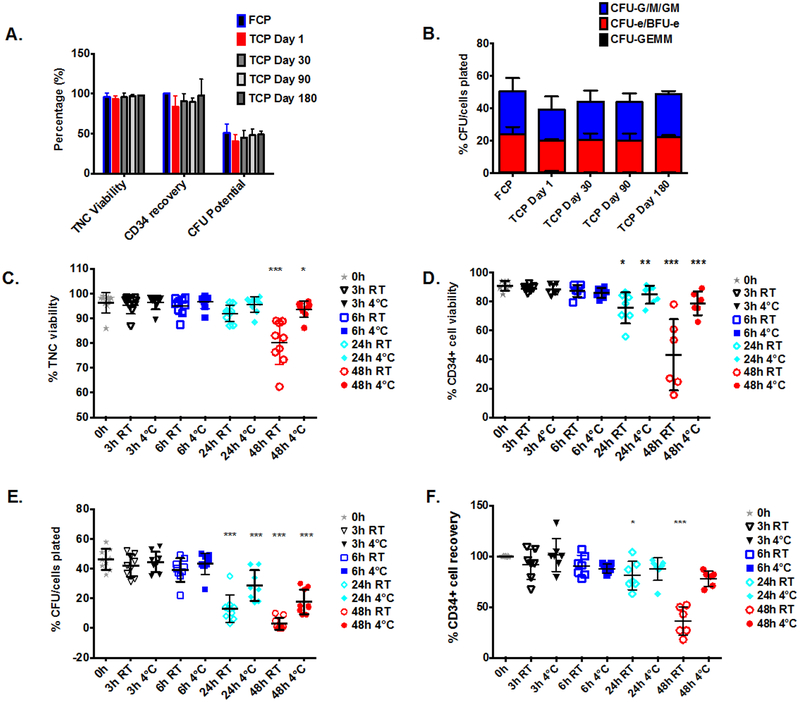
Experimental design: HSCs transduced with a lentiviral vector expressing NY-ESO-1 TCR and the PET reporter/suicide gene HSV1-sr39TK and T cells transduced with a retroviral vector expressing NY-ESO-1 TCR were coadministered to myelodepleted HLA-A2/Kb mice within a formal Good Laboratory Practice (GLP)-compliant study to demonstrate safety, persistence, and HSC differentiation into all blood lineages. Non-GLP experiments included assessment of transgene immunogenicity and in vitro viral insertion safety studies. Furthermore, Good Manufacturing Practice (GMP)-compliant cell production qualification runs were performed to establish the manufacturing protocols for clinical use.

Results: TCR genetically modified and ex vivo-cultured HSCs differentiated into all blood subsets in vivo after HSC transplantation, and coadministration of TCR-transduced T cells did not result in increased toxicity. The expression of NY-ESO-1 TCR and sr39TK transgenes did not have a detrimental effect on gene-modified HSC's differentiation to all blood cell lineages. There was no evidence of genotoxicity induced by the lentiviral vector. GMP batches of clinical-grade transgenic cells produced during qualification runs had adequate stability and functionality.

Conclusions: Coadministration of HSCs and T cells expressing an NY-ESO-1 TCR is safe in preclinical models. The results presented in this article led to the FDA approval of IND 17471.


Conflict of interest statement

The authors have no conflict of interests on this work

Figures

Figure 1.
Figure 1.. Lentiviral and retroviral vector characterization.
A. LV-NY-ESO-1 TCR/sr39TK (RRL-MSCV-optNYESO-optsr39TK-WPRE) self-inactivating third-generation lentiviral vector scheme. B. NY-ESO-1 TCR expression in human PBMCs three days after transduction. Percentage of NY-ESO-1 TCR and CD3 expression were measured by flow cytometry with NYESO-1(157–162) dextramer and anti-CD3 antibody in mock-transduced (top panel) and transduced (bottom panel) PBMCs. C. In vitro sr39TK functionality in hCD34+. Mock-transduced or LV-NY-ESO-1 TCR/sr39TK-transduced human CD34+ cells were treated with 0, 0.02, 0.2, 2, 20 or 200μM ganciclovir (GCV) for 48 days. Left, TCR expression (measured by Vβ13 staining) in cells not treated with GCV. Percentage of Vβ13+ (center) and Vβ13- cells (right) in the transduced CD34+ cells after GCV treatment at the indicated concentrations. Vβ13 expression was measure by flow cytometry D. RV-NY-ESO-1 TCR (MSGV1-A2aB-1G4A-LY3H10) gamma-retroviral vector scheme. E. NY-ESO-1 TCR expression in murine T cells from HLA-A2/Kb mice two days after transduction. Surface (top panels) and total (surface + intracellular, bottom panels) TCR expression was measured by Vβ13 TCR beta chain and surface CD3 staining detected by flow cytometry. Abbreviations: Ψ, packaging signal; cPPT, central polypurine tract; LTR, long terminal repeat; MSCV, murine stem cell virus promoter; RRE, Rev response element; SA, splicing acceptor; SD, splicing donor; WPRE, woodchuck hepatitis virus posttranslational response element.
Figure 2.
Figure 2.. Co-administration of Lin- cells and T cells expressing NY-ESO-1 TCR does not have a negative impact on survival, body and organ weights, blood cell reconstitution and serum chemistry parameters three months after BMT.
TCR engineered Lin- cells and T cells were co-administered to myelodepleted 8- to 12-week-old HLA-A2/Kb mice by intravenous injection. Mice from each cohort were euthanized at day 5 (n=6) or 3 months (n=12–15) after BMT. A. Kaplan-Meier survival curve (Log-rank test p = 0.48). Numbers in the graph indicate survivor count at each time point. B. Total body weight. * p<0.05 vs untreated controls (cohort A), pair-wise comparisons of least-squares means in a linear model framework with Tukey-Kramer adjustment within each time point; considered significant only if 5 or more consecutive measurements were significantly different. C. Organ weights at 3 months after BMT. D. Hematology at day 5 and 3 months after BMT. WBC, White Blood Cells; RBC, Red Blood Cells; HGB, Hemoglobin. E. White Blood Cell differential count at day 5 (left) and 3 months (right) after BMT. Neut, neutrophils; Lymphs, lymphocytes; Mono, monocytes; Eos, eosinophils; Baso, basophils; Bands, Band cells; Unclass, Unclassified cells. F. Serum chemistry at 3 months after BMT. ALT, alanine aminotransferase; AST, aspartate aminotransferase; ALP, alkaline phosphatase, serum; CK, creatine kinase; ALB, Albumin. Mean ±SEM is plotted. * p<0.05 vs cohort A, # p<0.05 compared to cohort E (receiving transduced Lin- and transduced T cells), pair-wise comparisons of least-squares means in a linear model framework with Tukey-Kramer adjustment within each time point.
Figure 3.
Figure 3.. Co-administration of Lin- cells and T cells expressing an NY-ESO-1 TCR does not have a negative impact on stem cell and T cell engraftment and progeny persistence.
Retrovirus vector copy number (VCN) in the blood, spleen and bone marrow at 5 days (n=6) (A) and 3 months (n=12–15) (B) after BMT. Lentivirus VCN in the blood, spleen and bone marrow at 5 days (n=6) (C) and 3 months (n=12–15) (D) after BMT. Individual values and mean ±SEM are plotted. * p<0.05 vs cohorts A, B and C; # p<0.05 vs Cohorts A, B and D; & p<0.05 vs Cohorts D; pair-wise comparisons of least-squares means in a linear model framework with Tukey-Kramer adjustment.
Figure 4.
Figure 4.. The expression of NY-ESO-1 TCR in Lin- cells and their co-administration with T cells expressing an NY-ESO-1 TCR does not have a negative impact on hematopoietic lineage differentiation.
Bone marrow cells and splenocyte phenotype characterization 3 months after BMT. TCR and cell surface markers were assessed by flow cytometry. A. Percentage of Lin- (left panel), LSK (Lin- ScaI+ cKit+, middle panel) and HSC (LSK CD150+ CD48-, right panel) cells in bone marrow. B. Percentage of NY-ESO-1 TCR-expressing cells in the bone marrow, detected by intracellular Vβ13 staining. C. Comparison of the frequency of Lin- (right), LSK (middle) and HSC (left) cells in the total bone marrow population (open circles) and the Vβ13+ population (closed circles). D. Percentages of NKT cells, CD4+ T cells, CD8+ T cells (left panel), B cells, granulocytes, macrophages and neutrophils (right panel) in the total splenocyte population, E. Percentage of NY-ESO-1 TCR-expressing cells in the splenocytes, detected by intracellular Vβ13 staining. F. Comparison of the frequency of NKT cells, CD4+T cells, CD8+ T cells (left panel), B cells, granulocytes, macrophages and neutrophils (right panel) in the total splenocyte population (open circles) and the Vβ13+ population (closed circles). Individual values and mean ±SEM are plotted (n=12–15). * p<0.05 vs cohort A; # p<0.05 vs Cohort A, B and D; & p<0.05 vs Cohort A and B; + p<0.05; pair-wise comparisons of least-squares means in a linear model framework with Tukey-Kramer adjustment.
Figure 5.
Figure 5.. Lack of immunogenicity and genotoxicity of the LV-NY-ESO-1 TCR/sr39TK vector.
Lin- cells transduced with either a LV-NY-ESO-1 TCR/sr39TK, LV-NY-ESO-1 TCR or LV-empty vector were transplanted into myelodepleted HLA-A2/Kb mice. Mice were euthanized at three months after BMT. A. Hematology at 3 months after BMT (n=5–9). WBC, White Blood Cells; RBC, Red Blood Cells; HGB, Hemoglobin. * p<0.05 vs untreated and # p<0.05 vs Mock-transduced. Pair-wise Comparison with Tukey-Kramer. B. Lentivirus VCN in the bone marrow, spleen and blood at three months after BMT. The VCN is normalized with the VCN value of the transplanted cells. Mean ±SEM are plotted (n=6–9). *p<0.05 vs untreated and # p<0.05 vs Mock-transduced. Pair-wise multiple comparison analysis using the Dwass, Steel, Critchlow-Fligner method. C. In vitro immortalization assay. Replating frequency/VCN ratio for mock transduced Lin- cells (n=3), Lin- cells transduced with SF91-eGFP-RRE (n=20) and Lin- cells transduced with the LV-NY-ESO-1 TCR/sr39TK (n=17). Fisher’s exact test (two-sided), p-value = 0.004, and Wilcoxon rank-sum test (two sided), p-value = 0.004, between the SF91-eGFP-RRE transduced group and the LV-NYESO-1 TCR/sr39TK group.
Figure 6.
Figure 6.. PBSC product stability.
An aliquot of cryopreserved PBSC product was recovered at different time points post-cryopreservation: Thawed Cell Product (TCP Day 1, n=2), 30 days (TCP Day 30, n=5), 90 days (TCP Day 90, n=3) and 180 days (TCP Day 180, n=2) after cryopreservation (panels A and B). The stability parameters of the recovered PBSC product stored at RT or 4–8°C were analyzed after 3, 6, 24 and 48h post-thaw and compared to those at 0h, (n=9), (Panels C – F). A. Total nucleated cells (TNC) viability (by trypan blue exclusion), CD34 recovery (by ISCHAGE method) and the percentage of TNCs that grew into hematopoietic colonies when cultured in MethoCult complete medium for 14 days (CFU potential) was assessed at different time points after the cryopreservation. There was no significant difference between the examined time points and fresh cell product (FCP) (p=0.17, p=0.31 and p=0.45 for TNC viability, CD34 recovery and CFU potential, respectively). Data are presented as mean±SD. B. The percentages of CFU-G/M/GM (colony-forming unit-granulocyte/-macrophage/-granulocyte and macrophage), CFU-e/BFU-e (colony-forming unit-erythroid/Burst-forming unit erythroid) and CFU-GEMM (colony-forming unit granulocyte, erythrocyte, monocyte, megakaryocyte) colonies after 14 days culture in MethoCult complete medium. Colonies were scored with the aid of a Zeiss Vert.A1 inverted microscope. Results are expressed as the percentage of CFU subtype per total cells plated. There were no statistically significant differences in the percentage of CFU-G/M/GM (p=0.24), CFU-e/BFU-e (p=0.68) and CFU-GEMM (p=0.52) between different time points and fresh CP. C. Percentage of viable TNC in the PBSC product at 0, 3, 6, 24 and 48h post thaw established by trypan blue exclusion essay. D. Percentage of viable CD34+ at 0, 3, 6, 24 and 48h post-thaw assessed by flow cytometry (ISCHAGE method). E. Percentage of CD34 recovery at the different time points post thawing calculated by dividing “the number of CD34+ cells/ml at 0h” by the “number of CD34+ cells/ml at 3, 6, 24 and 48h time points” and multiplying by 100%. F. Clonogenic potential of the PBSC product 0, 3, 6, 24 and 48h post thaw measured by the percentage of TNCs that grew into hematopoietic colonies. The horizontal bars show averaged values (*p<0.05, **p<0.01 and ***p<0.001 when compared to the 0h time point, by Tukey-Kramer test).

Similar articles

Cited by

References

    1. Morgan RA, Dudley ME, Wunderlich JR, Hughes MS, Yang JC, Sherry RM, et al. Cancer regression in patients after transfer of genetically engineered lymphocytes. Science. 2006;314:126–9. - PMC - PubMed
    1. Johnson LA, Morgan RA, Dudley ME, Cassard L, Yang JC, Hughes MS, et al. Gene therapy with human and mouse T-cell receptors mediates cancer regression and targets normal tissues expressing cognate antigen. Blood. 2009;114:535–46. - PMC - PubMed
    1. Robbins PF, Morgan RA, Feldman SA, Yang JC, Sherry RM, Dudley ME, et al. Tumor regression in patients with metastatic synovial cell sarcoma and melanoma using genetically engineered lymphocytes reactive with NY-ESO-1. J Clin Oncol. 2011;29:917–24. - PMC - PubMed
    1. Chodon T, Comin-Anduix B, Chmielowski B, Koya RC, Wu Z, Auerbach M, et al. Adoptive transfer of MART-1 T-cell receptor transgenic lymphocytes and dendritic cell vaccination in patients with metastatic melanoma. Clin Cancer Res. 2014;20:2457–65. - PMC - PubMed
    1. Rapoport AP, Stadtmauer EA, Binder-Scholl GK, Goloubeva O, Vogl DT, Lacey SF, et al. NY-ESO-1-specific TCR-engineered T cells mediate sustained antigen-specific antitumor effects in myeloma. Nat Med. 2015;21:914–21. - PMC - PubMed

Publication types

MeSH terms