. 2019 Jan;60(1):135-148.
doi: 10.1194/jlr.M089755. Epub 2018 Nov 8.

Chiral lipidomics of monoepoxy and monohydroxy metabolites derived from long-chain polyunsaturated fatty acids

Affiliations

Chiral lipidomics of monoepoxy and monohydroxy metabolites derived from long-chain polyunsaturated fatty acids

Maximilian Blum et al. J Lipid Res. 2019 Jan.

Abstract

A chiral lipidomics approach was established for comprehensive profiling of regio- and stereoisomeric monoepoxy and monohydroxy metabolites of long-chain PUFAs as generated enzymatically by cytochromes P450 (CYPs), lipoxygenases (LOXs), and cyclooxygenases (COXs) and, in part, also unspecific oxidations. The method relies on reversed-phase chiral-LC coupled with ESI/MS/MS. Applications revealed partially opposing enantioselectivities of soluble and microsomal epoxide hydrolases (mEHs). Ablation of the soluble epoxide hydrolase (sEH) gene resulted in specific alterations in the enantiomeric composition of endogenous monoepoxy metabolites. For example, the (R,S)/(S,R)-ratio of circulating 14,15-EET changed from 2.1:1 in WT to 9.7:1 in the sEH-KO mice. Studies with liver microsomes suggested that CYP/mEH interactions play a primary role in determining the enantiomeric composition of monoepoxy metabolites during their generation and release from the ER. Analysis of human plasma showed significant enantiomeric excess with several monoepoxy metabolites. Monohydroxy metabolites were generally present as racemates; however, Ca2+-ionophore stimulation of whole blood samples resulted in enantioselective increases of LOX-derived metabolites (12S-HETE and 17S-hydroxydocosahexaenoic acid) and COX-derived metabolites (11R-HETE). Our chiral approach may provide novel opportunities for investigating the role of bioactive lipid mediators that generally exert their physiological functions in a highly regio- and stereospecific manner.

Keywords: chiral high-performance liquid chromatography; cytochrome P450; eicosanoids; lipoxygenase; microsomal epoxide hydrolase; oxylipins; soluble epoxide hydrolase; stereoisomers; tandem mass spectrometry.


Figures

Fig. 1.
Fig. 1.
Analytical approach for the determination of oxylipin enantiomers in biological and clinical samples. Metabolites extracted from tissue or in vitro experiments are chromatographed on two different chiral columns. Each of them is coupled upstream with a short achiral column to preseparate regioisomeric monoepoxides and monohydroxides. Chiral-1 and chiral-2 allow the resolution of distinct subsets of enantiomeric metabolites, comprising most of the targeted monoepoxides on Cellulose-3 and all monohydroxides as well as several mid-chain monoepoxides on Amylose-1. The achiral method uses a RP-C18 column and is included to obtain reference data on the total levels of all targeted metabolites, independent of their enantiomeric composition. All three types of LC are performed under reversed-phase conditions and are coupled with ESI-MS/MS detection and quantification.
Fig. 2.
Fig. 2.
Representative chiral-LC-ESI-MS/MS chromatograms. Shown are examples for the enantiomeric resolution of monoepoxy and monohydroxy metabolites extracted from WT murine liver and plasma samples. Analysis was performed using the chiral-1 or chiral-2 method as appropriate for the different analytes (see Tables 1, 2). Labeled are the (R)/(R,S)-enantiomer (I) and the (S)/(S,R)-enantiomer (II).
Fig. 3.
Fig. 3.
Time course of murine sEH-catalyzed enantioselective hydrolysis of racemic 14,15-EET, 17,18-EEQ, and 19,20-EDP. An equimolar mixture (10 μM each) of all three racemic monoepoxides was incubated with different amounts of the liver cytosolic fraction prepared from WT mice. The time course is shown for incubations containing 16 μg/ml of the cytosolic fraction to follow the rapid metabolism of 14,15-EET (A) or 112 μg/ml to access the comparatively slow hydrolysis rates of 17,18-EEQ (B) and 19,20-EDP (C). Samples of the reaction mixtures were taken at the indicated time points and analyzed by the chiral-1 method. The lower panels show representative chiral-LC-ESI-MS/MS chromatograms before and 10 min after starting the reaction by adding the murine cytosolic sEH. Metabolite (%) represents the amount of unutilized compound. Data are shown as mean ± SD from three independent incubations. Statistically significant enantioselectivities were observed as indicated: *P < 0.05. Nonenzymatic hydrolysis in buffer controls was below 5% (not shown).
Fig. 4.
Fig. 4.
Enantioselective hydrolysis of monoepoxy metabolites by murine sEH and mEH. The time course of hydrolysis was followed in separate incubations using either 11,12-EET, 14,15-EET, or 17,18-EEQ as racemic substrates (10 μM). Each reaction was started with suitable amounts of sEH as contained in the liver cytosol from WT mice or mEH as contained in the liver microsomes prepared from sEH-KO mice. A: Hydrolysis of 11,12-EET, 14,15-EET, and 17,18-EEQ by murine sEH. The 11,12-EET was incubated with 7 μg/ml, 14,15-EET with 1 μg/ml, and 17,18-EEQ with 10 μg/ml liver cytosolic protein from WT mice. B: Hydrolysis of 11,12-EET, 14,15-EET, and 17,18-EEQ by murine mEH. The 11,12-EET was incubated with 800 μg/ml, 14,15-EET with 1,600 μg/ml, and 17,18-EEQ with 1,600 μg/ml liver microsomal protein from sEH-KO mice. Metabolite (%) represents the amount of unutilized compound. Data are shown as mean ± SD from three independent incubations. Statistically significant enantioselectivities were observed as indicated: *P < 0.05. See also supplemental Fig. S2 for additional data regarding the enantioselective hydrolysis of or 8,9-EET and 19,20-EDP.
Fig. 5.
Fig. 5.
Enantioselective hydrolysis of monoepoxy metabolites by human sEH and mEH. The time course of hydrolysis was followed in separate incubations using either 11,12-EET, 14,15-EET, or 17,18-EEQ as racemic substrates (10 μM). Each reaction was started with suitable amounts of recombinant human sEH or mEH as contained in human liver microsomes. A: Hydrolysis of 11,12-EET, 14,15-EET, and 17,18-EEQ by human sEH. The 11,12-EET was incubated with 0.4 μg/ml, 14,15-EET with 0.03 μg/ml, and 17,18-EEQ with 0.2 μg/ml of recombinant human sEH. B: Hydrolysis of 11,12-EET, 14,15-EET, and 17,18-EEQ by human mEH. The 11,12-EET was incubated with 200 μg/ml, 14,15-EET with 400 μg/ml, and 17,18-EEQ with 200 μg/ml protein of human liver microsomes, in the presence of the sEH inhibitor, TPPU (2 μM). Data are shown as mean ±SD from three independent incubations. Statistically significant enantioselectivities were observed as indicated: *P < 0.05. See also supplemental Fig. S2 for additional data regarding the enantioselective hydrolysis of 8,9-EET and 19,20-EDP.
Fig. 6.
Fig. 6.
Role of mEH in the stereoselective formation of EETs by murine and human liver microsomes. NADPH-dependent metabolism of AA (10 μM) was studied using murine liver microsomes from sEH-KO mice (A) or human liver microsomes (B) in the presence of the sEH inhibitor, TPPU (2 μM). The incubations contained 0.8 mg/ml microsomal protein and were performed in the absence (vehicle control) or presence of the mEH inhibitor, CHO. The metabolites formed after a reaction time of 10 min were extracted and analyzed for their enantiomeric composition using the chiral-1 and chiral-2 methods. Data are shown as mean ± SD from three independent incubations per group. Statistically significant differences were observed as indicated: *P < 0.05 versus corresponding (R,S)/(R)-enantiomer and #P < 0.05 versus vehicle.
Fig. 7.
Fig. 7.
Role of sEH in determining the enantiomeric composition of endogenous monoepoxy metabolites in mice. Liver (A) and plasma samples (B) were prepared from WT and sEH-KO mice after the animals received a diet supplemented with EPA and DHA for 3 weeks. The enantiomeric composition of the targeted metabolites was determined using chiral-LC-ESI-MS/MS. Data are shown as mean ± SEM (n = 5–6) and represent the total levels of the metabolites (free + esterified) as accessible after alkaline hydrolysis of the samples. Statistically significant differences were observed as indicated: *P < 0.05 versus corresponding (R,S)-enantiomer and #P < 0.05 versus WT. See also supplemental Tables S5 and S6 for the enantiomeric composition of further oxylipins in liver and plasma of WT and sEH-KO mice.
Fig. 8.
Fig. 8.
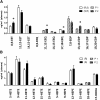
Profile of enantiomeric oxylipins in human plasma. Plasma samples were prepared from healthy volunteers 8 weeks after dietary EPA/DHA supplementation. The enantiomeric composition of the targeted metabolites was determined using chiral-LC-ESI-MS/MS. A: Levels of enantiomeric monoepoxy metabolites. B: Levels of enantiomeric monohydroxy metabolites. Data are shown as mean ± SEM (n = 6, three male and three female) and represent the total levels of the metabolites (free + esterified) as accessible after alkaline hydrolysis of the samples. Statistically significant excess of individual enantiomers was observed as indicated: *P < 0.05 versus corresponding (R,S)/(R)/(P1)-enantiomer.
Fig. 9.
Fig. 9.
Ca2+-ionophore-stimulated stereospecific formation of monohydroxy metabolites in human whole blood samples. Blood samples obtained from healthy volunteers 8 weeks after dietary EPA/DHA supplementation and treatment with A23187 or vehicle for 30 min. The enantiomeric composition of the targeted metabolites was determined using chiral-LC-ESI-MS/MS. Data are shown as mean ± SEM (n = 6, three male and three female) per treatment group and represent the total levels of the metabolites (free + esterified) as accessible after alkaline hydrolysis of the samples. Statistically significant excess of individual enantiomers was observed as indicated: *P < 0.05 versus corresponding (R)/(P1)-enantiomer.

Similar articles

Cited by

References

    1. Smilowitz J. T., Zivkovic A. M., Wan Y. J., Watkins S. M., Nording M. L., Hammock B. D., and German J. B.. 2013. Nutritional lipidomics: molecular metabolism, analytics, and diagnostics. Mol. Nutr. Food Res. 57: 1319–1335. - PMC - PubMed
    1. Gabbs M., Leng S., Devassy J. G., Monirujjaman M., and Aukema H. M.. 2015. Advances in our understanding of oxylipins derived from dietary PUFAs. Adv. Nutr. 6: 513–540. - PMC - PubMed
    1. Willenberg I., Ostermann A. I., and Schebb N. H.. 2015. Targeted metabolomics of the arachidonic acid cascade: current state and challenges of LC-MS analysis of oxylipins. Anal. Bioanal. Chem. 407: 2675–2683. - PubMed
    1. Schunck W. H., Konkel A., Fischer R., and Weylandt K. H.. 2018. Therapeutic potential of omega-3 fatty acid-derived epoxyeicosanoids in cardiovascular and inflammatory diseases. Pharmacol. Ther. 183: 177–204. - PubMed
    1. Astarita G., Kendall A. C., Dennis E. A., and Nicolaou A.. 2015. Targeted lipidomic strategies for oxygenated metabolites of polyunsaturated fatty acids. Biochim. Biophys. Acta. 1851: 456–468. - PMC - PubMed

Publication types

MeSH terms