. 2018 Dec;39(12):2205-2210.
doi: 10.3174/ajnr.A5872. Epub 2018 Nov 8.

Differentiation of Hemorrhage from Iodine Using Spectral Detector CT: A Phantom Study

Affiliations

Differentiation of Hemorrhage from Iodine Using Spectral Detector CT: A Phantom Study

S Van Hedent et al. AJNR Am J Neuroradiol. 2018 Dec.

Abstract

Background and purpose: Conventional CT often cannot distinguish hemorrhage from iodine extravasation following reperfusion therapy for acute ischemic stroke. We investigated the potential of spectral detector CT in differentiating these lesions.

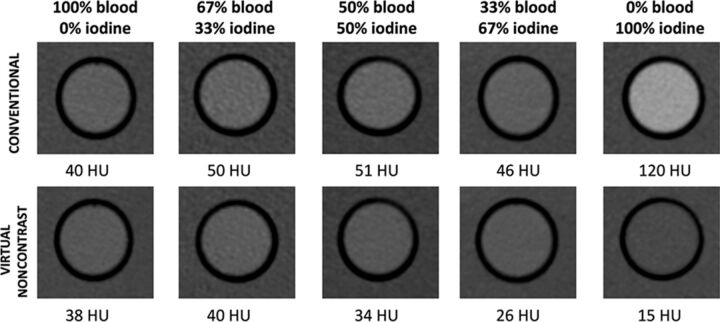
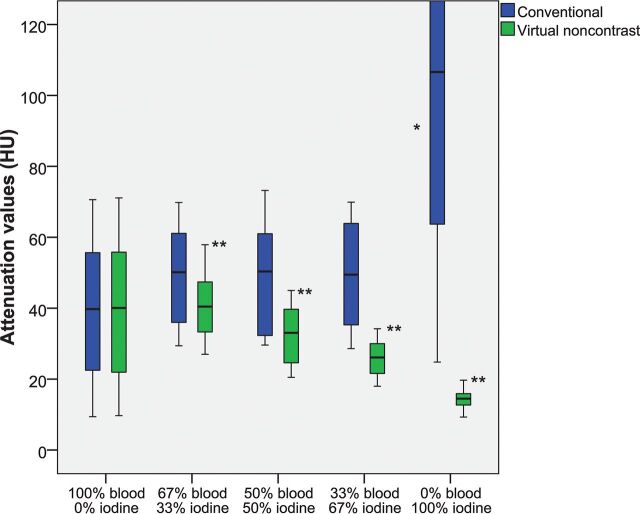
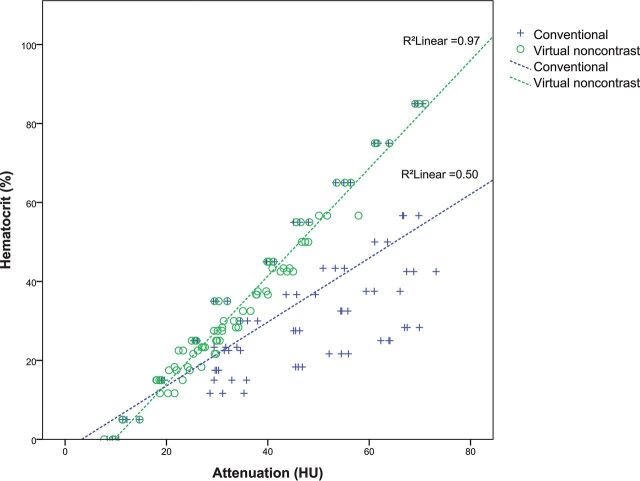
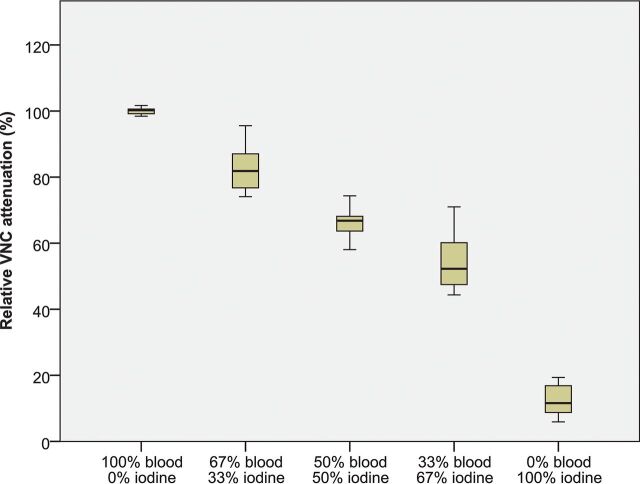
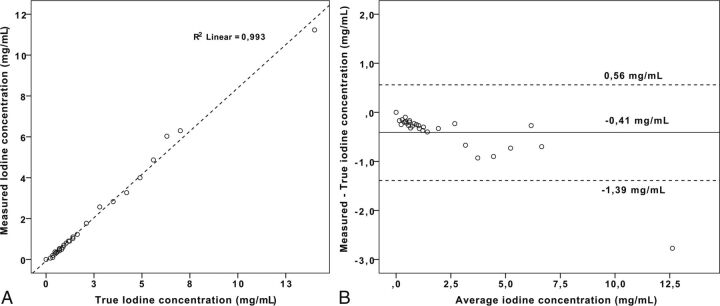
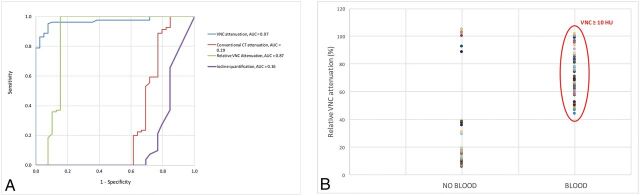
Materials and methods: Centrifuged blood with increasing hematocrit (5%-85%) was used to model hemorrhage. Pure blood, blood-iodine mixtures (75/25, 50/50, and 25/75 ratios), and iodine solutions (0-14 mg I/mL) were scanned in a phantom with attenuation ranging from 12 to 75 HU on conventional imaging. Conventional and virtual noncontrast attenuation was compared and investigated for correlation with calculation of relative virtual noncontrast attenuation. Values for all investigated categories were compared using the Mann-Whitney U test. Sensitivity and specificity of virtual noncontrast, relative virtual noncontrast, conventional CT attenuation, and iodine quantification for hemorrhage detection were determined with receiver operating characteristic analysis.

Results: Conventional image attenuation was not significantly different among all samples containing blood (P > .05), while virtual noncontrast attenuation showed a significant decrease with a decreasing blood component (P < .01) in all blood-iodine mixtures. Relative virtual noncontrast values were significantly different among all investigated categories (P < .01), with correct hemorrhagic component size estimation for all categories within a 95% confidence interval. Areas under the curve for hemorrhage detection were 0.97, 0.87, 0.29, and 0.16 for virtual noncontrast, relative virtual noncontrast, conventional CT attenuation, and iodine quantification, respectively. A ≥10-HU virtual noncontrast, ≥20-HU virtual noncontrast, ≥40% relative virtual noncontrast, and combined ≥10-HU virtual noncontrast and ≥40% relative virtual noncontrast attenuation threshold had a sensitivity/specificity for detecting hemorrhage of 100%/23%, 89%/95%, 100%/82%, and 100%/100%, respectively.

Conclusions: Spectral detector CT can accurately differentiate blood from iodinated contrast in a phantom setting.


Figures

Fig 1.
Fig 1.
Comparison of the attenuation of diluted blood, iodine, and blood-iodine mixtures on conventional and virtual noncontrast images. There is an incremental decrease of VNC attenuation values with decreasing blood content, compared with conventional CT attenuation values.
Fig 2.
Fig 2.
Attenuation values (HU) of diluted blood, blood-iodine mixtures, and diluted iodine on spectral detector CT conventional and virtual noncontrast images. There is a significant incremental decrease of VNC attenuation values with decreasing blood content. The asterisk indicates a significant difference of conventional CT attenuation compared with other compositions (P < .01); double asterisks, significant differences of VNC attenuation among these compositions (P < .01).
Fig 3.
Fig 3.
Correlation between the hematocrit in our dilutions and the attenuation in the conventional and VNC images.
Fig 4.
Fig 4.
Relative VNC attenuation (%), by comparing VNC attenuation with the attenuation on conventional CT for all investigated categories (diluted blood, blood-iodine mixtures, and diluted iodine). R-VNC values among all compositions were significantly different (P < .01).
Fig 5.
Fig 5.
Results of the iodine quantification measurements by comparison of measured-to-true iodine concentrations (A) and errors in iodine quantification measurements by a Bland-Altman plot (B). A, Correlation between measured and true iodine concentrations is excellent (R2 > 0.99, P < .01). B, Mean iodine quantification error (± 95% CI) was −0.41 ± 0.31–0.50 mg/mL).
Fig 6.
Fig 6.
Performance of conventional CT attenuation, virtual noncontrast attenuation, and relative VNC attenuation for the detection of blood. A, Receiver operating characteristic curve analysis shows the highest area under the curve for VNC (0.97 ± 0.94–0.99), followed by R-VNC attenuation (0.87 ± 0.77–0.97) and attenuation in the conventional CT images (0.29 ± 0.16–0.41), and the area under the curve was lowest for iodine quantification (0.16 ± 0.06–0.25). B, When we combined a ≥40% R-VNC (dashed line) and ≥10 HU VNC cutoff, there is 100% differentiation between blood-containing (diluted blood and blood-iodine mixtures) and diluted iodine samples.

Similar articles

Cited by

References

    1. National Institute of Neurological Disorders and Stroke rt-PA Stroke Study Group. Tissue plasminogen activator for acute ischemic stroke. N Engl J Med 1995;333:1581–87 10.1056/NEJM199512143332401 - DOI - PubMed
    1. Mokin M, Kan P, Kass-Hout T, et al. . Intracerebral hemorrhage secondary to intravenous and endovascular intraarterial revascularization therapies in acute ischemic stroke: an update on risk factors, predictors, and management. Neurosurg Focus 2012;32:E2 10.3171/2012.1.FOCUS11352 - DOI - PubMed
    1. Fiorelli M, Bastianello S, von Kummer R, et al. . Hemorrhagic transformation within 36 hours of a cerebral infarct: relationships with early clinical deterioration and 3-month outcome in the European Cooperative Acute Stroke Study I (ECASS I) cohort. Stroke 1999;30:2280–84 10.1161/01.STR.30.11.2280 - DOI - PubMed
    1. Nakano S, Iseda T, Kawano H, et al. . Parenchymal hyperdensity on computed tomography after intra-arterial reperfusion therapy for acute middle cerebral artery occlusion: incidence and clinical significance. Stroke 2001;32:2042–48 10.1161/hs0901.095602 - DOI - PubMed
    1. Yoon W, Seo JJ, Kim JK, et al. . Contrast enhancement and contrast extravasation on computed tomography after intra-arterial thrombolysis in patients with acute ischemic stroke. Stroke 2004;35:876–81 10.1161/01.STR.0000120726.69501.74 - DOI - PubMed

Publication types

MeSH terms