

Synthesizing a Contrast-Enhancement Map in Patients with High-Grade Gliomas Based on a Postcontrast MR Imaging Quantification Only
- PMID: 30409854
- PMCID: PMC7655388
- DOI: 10.3174/ajnr.A5870
Synthesizing a Contrast-Enhancement Map in Patients with High-Grade Gliomas Based on a Postcontrast MR Imaging Quantification Only
Abstract
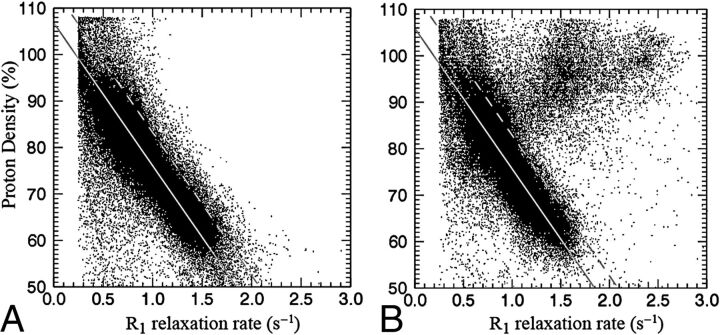
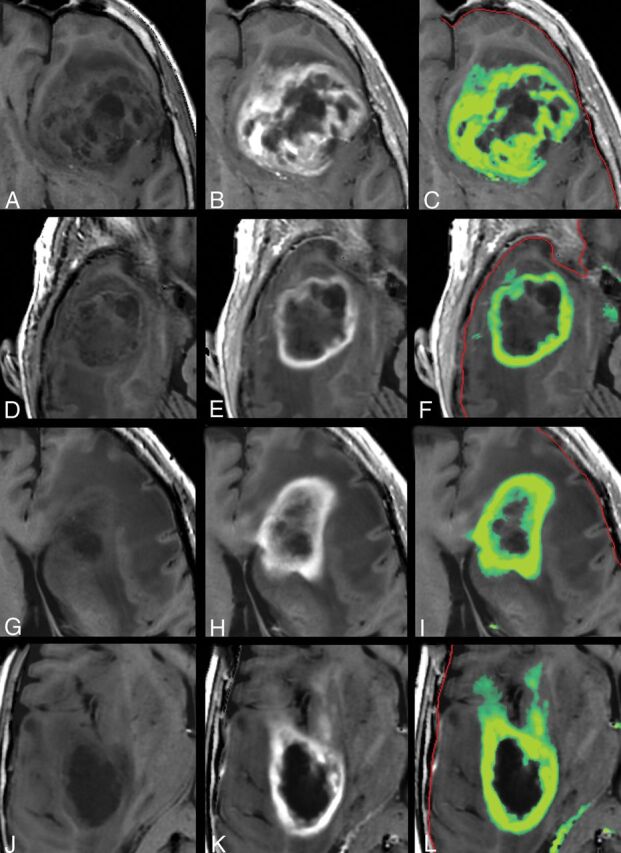
Background and purpose: Administration of a gadolinium-based contrast agent is an important diagnostic biomarker for blood-brain barrier damage. In clinical use, detection is based on subjective comparison of native and postgadolinium-based contrast agent T1-weighted images. Quantitative MR imaging studies have suggested a relation between the longitudinal relaxation rate and proton-density in the brain parenchyma, which is disturbed by gadolinium-based contrast agents. This discrepancy can be used to synthesize a contrast-enhancement map based solely on the postgadolinium-based contrast agent acquisition. The aim of this study was to compare synthetic enhancement maps with subtraction maps of native and postgadolinium-based contrast agent images.
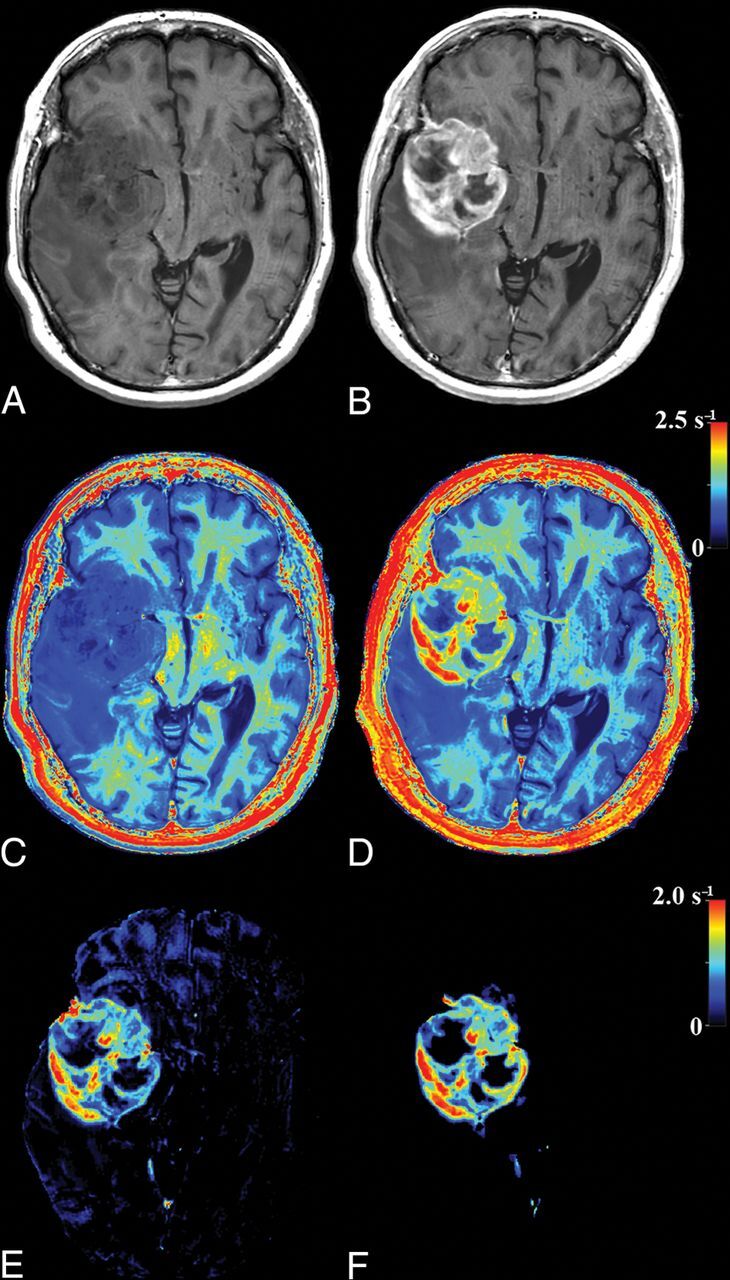
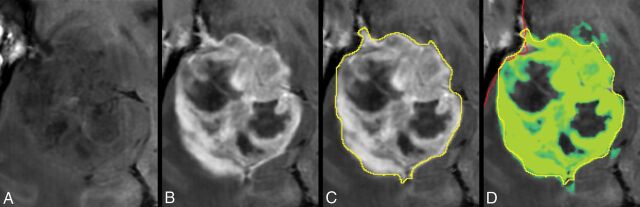
Materials and methods: For 14 patients with high-grade gliomas, quantitative MR imaging was performed before and after gadolinium-based contrast agent administration. The quantification sequence was multidynamic and multiecho, with a scan time of 6 minutes. The 2 image stacks were coregistered using in-plane transformation. The longitudinal relaxation maps were subtracted and correlated with the synthetic longitudinal relaxation enhancement maps on the basis of the postgadolinium-based contrast agent images only. ROIs were drawn for tumor delineation.
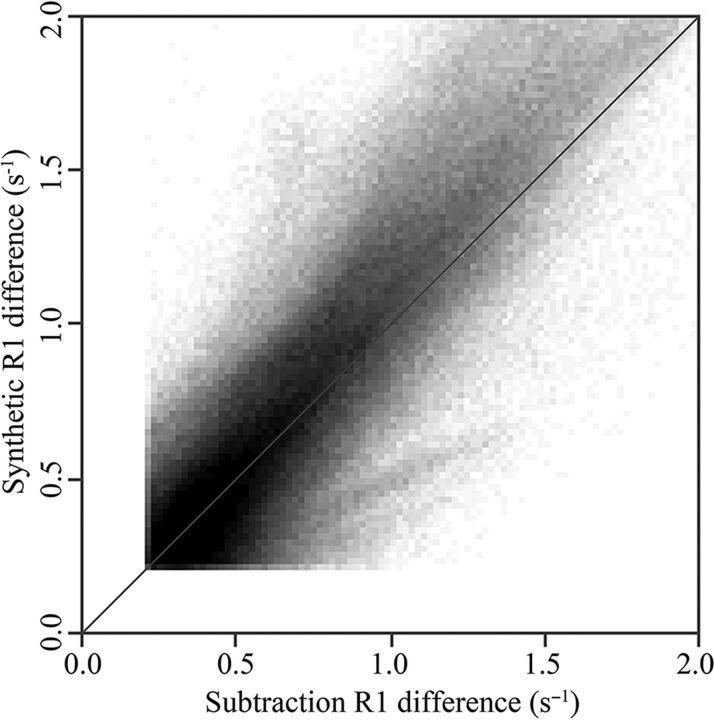
Results: Linear regression of the subtraction and synthetic longitudinal relaxation enhancement maps showed a slope of 1.02 ± 0.19 and an intercept of 0.05 ± 0.12. The Pearson correlation coefficient was 0.861 ± 0.059, and the coefficient of variation was 0.18 ± 0.04. On average, a volume of 1.71 ± 1.28 mL of low-intensity enhancement was detected in the synthetic enhancement maps outside the borders of the drawn ROI.
Conclusions: The study shows that there was a good correlation between subtraction longitudinal relaxation enhancement maps and synthetic longitudinal relaxation enhancement maps in patients with high-grade gliomas. The method may improve the sensitivity and objectivity for the detection of gadolinium-based contrast agent enhancement.
© 2018 by American Journal of Neuroradiology.
Figures
Similar articles
-
Magnetic resonance relaxometry in quantitative imaging of brain gliomas: A literature review.Neuroradiol J. 2024 Jun;37(3):267-275. doi: 10.1177/19714009231173100. Epub 2023 May 3. Neuroradiol J. 2024. PMID: 37133228 Free PMC article. Review.
-
Brain Tumor-Enhancement Visualization and Morphometric Assessment: A Comparison of MPRAGE, SPACE, and VIBE MRI Techniques.AJNR Am J Neuroradiol. 2019 Jul;40(7):1140-1148. doi: 10.3174/ajnr.A6096. Epub 2019 Jun 20. AJNR Am J Neuroradiol. 2019. PMID: 31221635 Free PMC article.
-
Quantitative MRI for analysis of peritumoral edema in malignant gliomas.PLoS One. 2017 May 23;12(5):e0177135. doi: 10.1371/journal.pone.0177135. eCollection 2017. PLoS One. 2017. PMID: 28542553 Free PMC article.
-
Three-dimensional amide proton transfer MR imaging of gliomas: Initial experience and comparison with gadolinium enhancement.J Magn Reson Imaging. 2013 Nov;38(5):1119-28. doi: 10.1002/jmri.24067. Epub 2013 Feb 25. J Magn Reson Imaging. 2013. PMID: 23440878 Free PMC article.
-
Gadolinium contrast agents for CNS imaging: current concepts and clinical evidence.AJNR Am J Neuroradiol. 2014 Dec;35(12):2215-26. doi: 10.3174/ajnr.A3917. Epub 2014 May 22. AJNR Am J Neuroradiol. 2014. PMID: 24852287 Free PMC article. Review.
Cited by
-
Brain tumor enhancement prediction from pre-contrast conventional weighted images using synthetic multiparametric mapping and generative artificial intelligence.Quant Imaging Med Surg. 2025 Jan 2;15(1):42-54. doi: 10.21037/qims-24-721. Epub 2024 Dec 23. Quant Imaging Med Surg. 2025. PMID: 39839033 Free PMC article.
-
Magnetic resonance relaxometry in quantitative imaging of brain gliomas: A literature review.Neuroradiol J. 2024 Jun;37(3):267-275. doi: 10.1177/19714009231173100. Epub 2023 May 3. Neuroradiol J. 2024. PMID: 37133228 Free PMC article. Review.
-
Metabolic and transcriptomic profiles of glioblastoma invasion revealed by comparisons between patients and corresponding orthotopic xenografts in mice.Acta Neuropathol Commun. 2021 Aug 4;9(1):133. doi: 10.1186/s40478-021-01232-4. Acta Neuropathol Commun. 2021. PMID: 34348785 Free PMC article.
-
Toward deep learning replacement of gadolinium in neuro-oncology: A review of contrast-enhanced synthetic MRI.Front Neuroimaging. 2023 Jan 23;2:1055463. doi: 10.3389/fnimg.2023.1055463. eCollection 2023. Front Neuroimaging. 2023. PMID: 37554645 Free PMC article. Review.
-
Quantitative MRI using relaxometry in malignant gliomas detects contrast enhancement in peritumoral oedema.Sci Rep. 2020 Oct 22;10(1):17986. doi: 10.1038/s41598-020-75105-6. Sci Rep. 2020. PMID: 33093605 Free PMC article.
References
MeSH terms
Substances
LinkOut - more resources
Full Text Sources
Medical