. 2018 Nov 9;362(6415):eaao0666.
doi: 10.1126/science.aao0666.

Perivascular dendritic cells elicit anaphylaxis by relaying allergens to mast cells via microvesicles

Affiliations

Perivascular dendritic cells elicit anaphylaxis by relaying allergens to mast cells via microvesicles

Hae Woong Choi et al. Science. .

Abstract

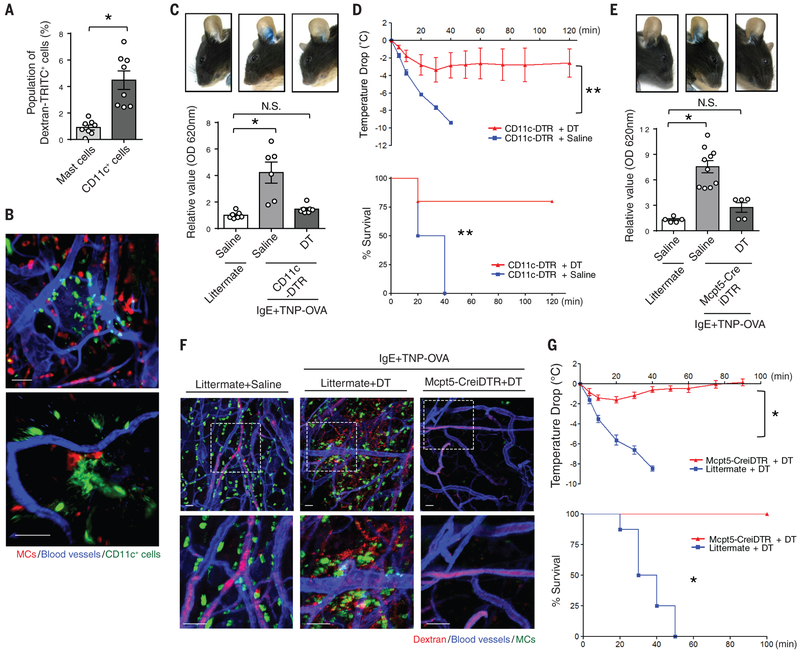
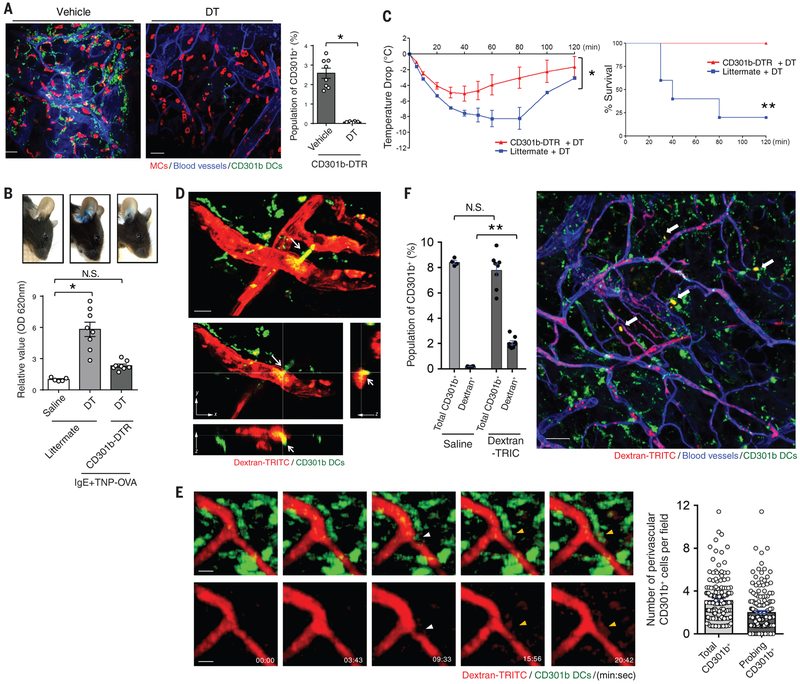
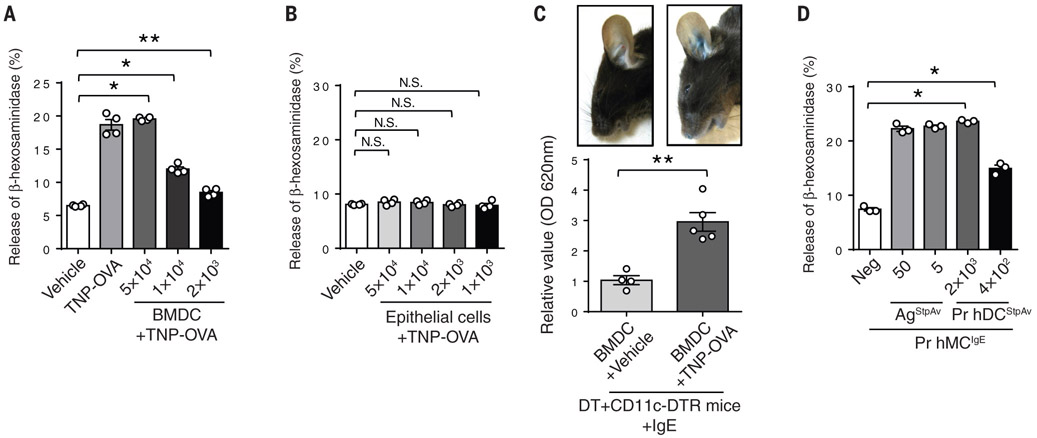
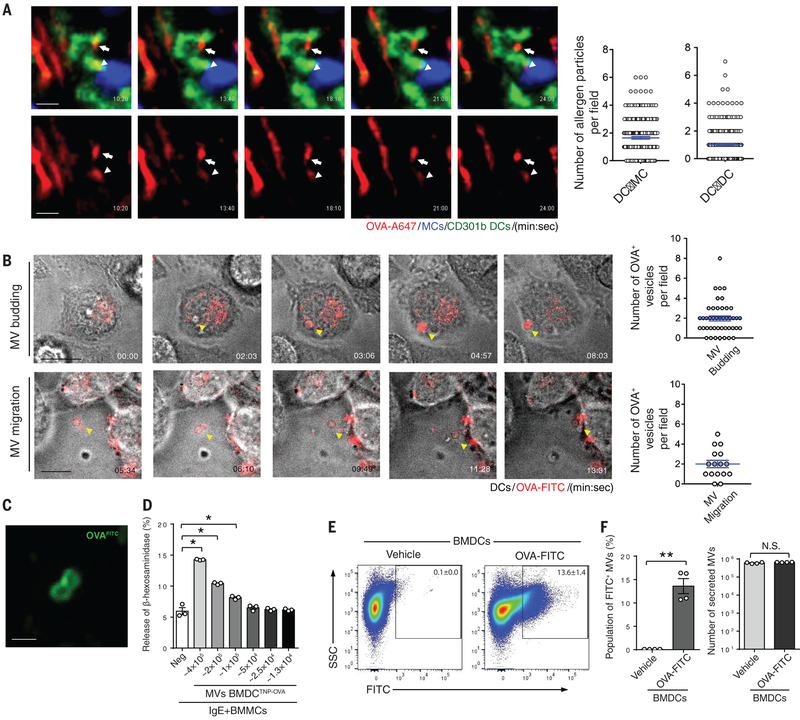
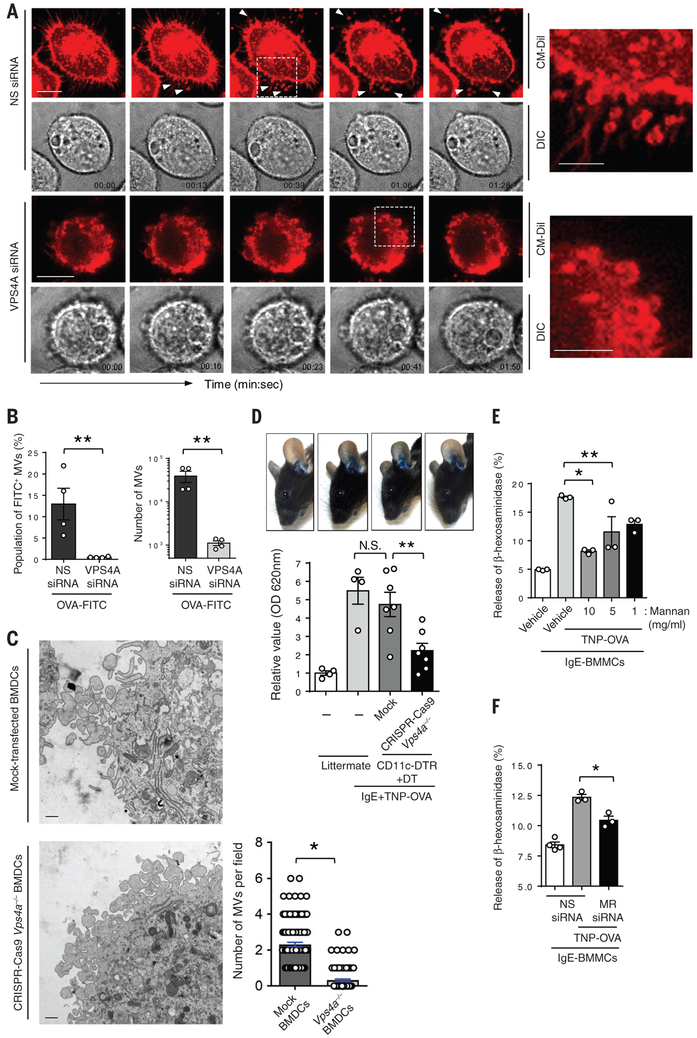
Anaphylactic reactions are triggered when allergens enter the blood circulation and activate immunoglobulin E (IgE)-sensitized mast cells (MCs), causing systemic discharge of prestored proinflammatory mediators. As MCs are extravascular, how they perceive circulating allergens remains a conundrum. Here, we describe the existence of a CD301b+ perivascular dendritic cell (DC) subset that continuously samples blood and relays antigens to neighboring MCs, which vigorously degranulate and trigger anaphylaxis. DC antigen transfer involves the active discharge of surface-associated antigens on 0.5- to 1.0-micrometer microvesicles (MVs) generated by vacuolar protein sorting 4 (VPS4). Antigen sharing by DCs is not limited to MCs, as neighboring DCs also acquire antigen-bearing MVs. This capacity of DCs to distribute antigen-bearing MVs to various immune cells in the perivascular space potentiates inflammatory and immune responses to blood-borne antigens.


Figures

Fig. 1.
Fig. 1.. PCA and PSA mediated by MCs and CD11c+ cells.
(A) Efficient antigen uptake by CD11c+ cells. CD11c-GFP mice were i.v. injected with TRITC-conjugated dextran (Dextran-TRITC). After 30 min, mice were sacrificed and their ears were dissected to generate a single-cell suspension. The dextran+ populations among CD45+FcεRI+cKit+ MCs and CD45+CD11c+ cells were compared. N=8 mice per group. Data are represented as the mean ± SEM. *P<0.001, unpaired Student's t-test. (B) CD11c+ cells lie in close proximity to blood vessels. The ears of CD11c-GFP (green) mice were dissected. A whole mount was then prepared and stained for MCs (avidin, red) and blood vessels (CD31, blue). Scale bars: 50 μm (left panel) and 15 μm (right panel). (C) CD11c+ cells mediate vascular leakage. CD11c-DTR or littermate mice were i.p. and i.v. injected with DT or vehicle every other day twice to deplete the population of CD11c+ cells. The day before antigen challenge, the ears of CD11c-DTR or WT mice were sensitized with TNP-specific IgE. TNP-conjugated ovalbumin (TNP-OVA) was i.v. injected along with Evans Blue dye into both groups. One hour post-injection, mouse ears were imaged, and dissected to extract dye for OD measurements. N=6-7 mice per group. Data are represented as the mean ± SEM. *P<0.001, one-way analysis of variance (ANOVA), Tukey's multiple comparisons test. (D) CD11c+ cells mediate anaphylaxis. After CD11c+ cells were depleted, IgE-sensitized CD11c-DTR mice were i.v. injected with TNP-OVA. Temperature changes were then monitored (upper panel). Survival during PSA was recorded and mice with temperature changes greater than 10 °C were sacrificed (lower panel). N=4-5 mice per group. Data are represented as the mean ± SEM. **P<0.05, two-way ANOVA (upper panel), Survival during PSA was recorded and analyzed by log-rank test (lower panel). (E, F) MC activation cause vascular leakage and anaphylaxis. Both Mcpt5-CreiDTR and littermate mice were i.v. injected with DT to deplete the population of MCs. The day before antigen challenge, the ears of each mouse were sensitized with TNP-specific IgE. TNP-OVA was i.v. injected to both group of mice along with (E) Evans Blue dye or (F) TRITC-conjugated dextran. One hour post-injection, (E) mouse ears were imaged and dissected to extract dye for OD measurements. Data are represented as the mean ± SEM. *P<0.001, one-way ANOVA, Tukey's multiple comparisons test. (F) Mouse ears were dissected and fixed for whole-mount imaging. Confocal microscopy was utilized to observe ears stained for MCs (avidin, green), blood vessels (CD31 antibody, blue), and dextran (red). The dotted squares in upper panels are magnified in the corresponding lower panels. Scale bar: 50 μm. (G) MC activation triggers a sharp drop in body temperature. After MCs were depleted, littermate or Mcpt5-CreiDTR mice were injected i.p. with TNP-specific IgE to sensitize them. The following day, mice were i.v. injected with TNP-OVA and temperature changes were monitored (upper panel). N=5-8 mice per group. Data are represented as the mean ± SEM. *P<0.001, two-way ANOVA. Survival during PSA was recorded and analyzed by log-rank test (lower panel). Two to three separate experiments were performed for each individual figure.
Fig. 2.
Fig. 2.. CD301b+ DCs mediate anaphylaxis after uptake of blood-borne antigen
(A) Treatment of CD301b-DTR-GFP mice with DT results in the depletion of CD301b+ cells. CD301b-DTR-GFP mice were injected i.p. once with DT or vehicle to deplete CD301b+ cells. Depletion of CD301b+ cells were quantified by flow cytometry. The ears of CD301b-DTR-GFP mice were then dissected and a whole mount was prepared and examined by confocal microscopy: MCs (avidin, red), blood vessels (CD31, blue), and CD301b (green). N=8 mice per group, data are represented as the mean ± SEM. *P<0.001, unpaired Student's t-test. (B, C) CD301b+ cells mediate PCA and PSA. After CD301b+ cell depletion, the ears of CD301b-DTR mice or littermate controls were sensitized with TNP-specific IgE. TNP-OVA was injected i.v. along with Evans Blue dye. After 1 h, mouse ears were imaged and then dissected to extract dye for OD measurements. N=5-8 mice per group, data are represented as the mean ± SEM. *P<0.001, one-way ANOVA, Tukey's multiple comparisons test. (C) After CD301b+ cells were depleted, CD301b-DTR or littermate mice were i.p. injected with TNP-OVA and then temperature changes were monitored (left panel). Mice with changes in temperature greater than 10 °C were sacrificed. The survival rate is shown (right panel). N=5 mice per group. Data are represented as the mean ± SEM. *P<0.001, two-way ANOVA (left panel), **P<0.01, Survival during PSA was recorded and analyzed by log-rank test (right panel). (D, E) 3D visualization of CD301b+ DCs probing the vasculature. CD301b-GFP mice were i.v. injected with Dextran-TRITC. (D) After 30 min, mice ears were dissected. Whole mounts were prepared and imaged using two-photon microscopy. Arrows indicate lamellipodia-like structure protruding into the vasculature from CD301b+ cDC2. The upper panel is an xy-plane projection from a Z-stack view, whereas the lower panels are cross-sectional views of selected xy-, yz-, and xz-planes. Scale bars: 10 μm. (E) Immediately after injection, intravital two-photon microscopy of mouse ears was performed. Time-series events were captured and displayed. White arrowheads point to a dendrite protrusion into the vasculature from CD301b+ cDC2. Yellow arrowheads point to CD301b+ cDC2 taking up blood-borne dextran-TRITC. The probing activity of perivascular CD301b+ cDC2 was quantified from multiple images taken over a 20-minute time period (right panel). Scale bars: 10 μm. (F) A significant population of CD301b+ cDC2 takes up blood-borne antigens. CD301b-GFP mice were i.v. injected with Dextran-TRITC. After 30 min, the mice ears were dissected and processed as single cell suspension for flow cytometry where the Dextran-TRITC+ population was identified (left panel) or processed as whole mounts for microcopy where antigen-sampling cells were readily detectable (arrows, right panel). N=4-8 mice per group, data are represented as the mean ± SEM. **P<0.01, unpaired Student's t-test. Scale bar: 50 μm. Two to three separate experiments were performed for each individual figure.
Fig. 3.
Fig. 3.. Antigen-primed DCs induce MC degranulation in vitro and in vivo.
(A) Antigen-primed BMDCs induce MC degranulation in a dose-dependent manner. BMDCs were primed with TNP-OVA for 15 min, rinsed three times and co-incubated with the TNP-specific-IgE-sensitized RBL-2H3 cells for 1 h, followed by measurement of β-hexosaminidase release. Data are represented as the mean ± SEM. *P<0.001, **P<0.05, one-way ANOVA, Tukey's multiple comparisons test. (B) Antigen-primed epithelial cells fail to induce MC degranulation. The same procedure as (A) was followed except that we replaced BMDCs with human bladder epithelial 5637 cells. Data are represented as the mean ± SEM. N.S. not significant, one-way ANOVA, Tukey's multiple comparisons test. (C) Antigen-primed BMDCs induce vascular leakage in vivo. CD11c+ cells were depleted in CD11c-DTR mice with i.p. and i.v. injections of DT 2 days before challenge with antigen-primed BMDCs. Ears of these mice were sensitized with TNP-specific IgE 1 day before challenge. For the challenge, BMDCs were primed with TNP-OVA or vehicle for 20 min, then washed before they were injected intradermally into the ears of the IgE-sensitized mice. Evans Blue dye was injected simultaneously i.v. into the same mice. After 1 h, the mouse ears were imaged and dissected to extract dye for OD measurements. N=4-5 mice per group, data are represented as the mean ± SEM. **P<0.05, unpaired Student's t-test. (D) Antigen-primed primary human skin DCs induce degranulation of primary human MCs. Primary human MCs cultured from peripheral blood were sensitized with biotinylated human IgE overnight. Primary human skin DCs were isolated from skin tissue as described in the methods section and primed with streptavidin for 20 min and rinsed three times. Both MCs and DCs were co-incubated for 1.5 h. β-hexosaminidase released into the extracellular medium was then measured. No β-hexosaminidase release was detected in control cultures containing only DCs. Data are represented as the mean ± SEM. *P<0.001, one-way ANOVA, Tukey's multiple comparisons test. Two to three separate experiments were performed for each individual figure.
Fig. 4.
Fig. 4.. Release of microvesicles (MVs) by DCs triggers degranulation in neighboring MCs.
(A) Time-lapse release of antigen-loaded vesicles from perivascular CD301b+ cDC2 to neighboring MCs and DCs in vivo. CD301b-GFP/Mcpt5-CretdTomato mice were injected i.v. with OVA-A647. The ears of live mice were then imaged using intravital confocal microscopy. MCs (blue), CD301b cDC2 (green), and A647-OVA (red). The arrowhead points to transfer of antigen-bearing vesicle from a CD301b+ DC (green) to a MC (blue). The arrow depicts transfer of antigen-bearing vesicles from a CD301b+ DC to another CD301b+ DC. Quantification of fluorescent particles was achieved by viewing multiple images and fields. Movement of particles from DCs to MCs (DC→MC) and from DCs to other DCs (DC→DC) for a 25-minute time period was quantitated (right panels). Scale bars: 10 μm (B) MV formation and secretion from a DC line (JAWSII). After the DC line was primed with antigen OVA-A647 (red), the cells were imaged using differential interference contrast (DIC). Yellow arrowheads point to the formation and release of antigen-loaded MVs. The budding MVs or their migration over a 20-minute time period were quantified from viewing multiple images and fields (right panels). Scale bars: 10 μm. (C) Fluorescent antigens are enriched on the membrane of recently formed MVs. After the DC line was primed with OVA-FITC (green), MVs released from these cells were collected through differential centrifuge and subjected to confocal microscopy. Scale bar: 1 μm. (D) TNP-OVA-loaded MVs induce MC degranulation. After the BMDCs were treated with TNP-OVA for 15 min, the MVs were collected and MVs numbers were calculated as described in materials and methods. Collected MVs were applied to IgE sensitized BMMCs in a dose-dependent manner (two-fold dilution) for 1 hr, followed by a β-hexosaminidase-release assay. Data are represented as the mean ± SEM. *P<0.001, one-way ANOVA, Tukey's multiple comparisons test. (E) Flow cytometric analysis of OVA-FITC loaded MVs. BMDCs were primed with OVA-FITC for 15 min, and after thorough washing to remove unbound OVA-FITC, fresh media was added and the cells incubated for 2 hr to release MVs. These particles were collected by differential centrifugation and analyzed by flow cytometry. Gating on 0.5-1.0-μm size MVs was performed as described in Fig. S14. Pseudo-colored dot plots of OVA-FITC treated or vehicle treated MVs were displayed as x: FITC and y: SSC. (F) Quantification of FITC+ population (left panel) or total MVs (right panel) of OVA-FITC treated or vehicle treated MVs was demonstrated as bar graph. Data are represented as the mean ± SEM. **P<0.05, N.S. not significant, unpaired Student's t test. Two to three separate experiments were performed for each individual figure.
Fig. 5.
Fig. 5.. MVs shedding by DCs is VPS4-dependent and antigens borne by MVs are bound by the mannose receptor (MR)
(A) VPS4 mediates MV shedding. MV shedding by DC lines transfected with VPS4A siRNA (lower panels) or non-specific (NS) siRNA (upper panels). After 48 hrs after transfection, the DCs were stained with CM-Dil dye (red) that stains membranes and then exposed to antigen (OVA) followed by time lapse microscopy. The upper panels depict fluorescence images and the lower panels is the corresponding DIC image. The arrowheads indicate sites of MV shedding. Representative enlarged images from individual set of images (dotted region) demonstrate the shedding of MVs (upper right panel) and inhibition of shedding of formed vesicles (lower right panel). Scale Bars: 10 μm (time lapse images) and 5 μm (magnified images). (B) MV shedding requires VPS4A subunit. Quantitation of MVs produced by control and VPS4A knocked down DC lines using flow cytometry. Data are represented as the mean ± SEM. **P<0.05, unpaired Student's t test. (C) Ultrastructure of MV formation by BMDCs. CRISPR-Cas9-generated Vps4a−/− BMDCs or mock-transfected BMDCs were pre-treated with ovalbumin for 15 min and immediately fixed with 4% PFA and processed for transmission electron microscopy (TEM). MVs shed by mock transfected BMDCs or CRISPR-Cas9 Vps4a−/− BMDCs were quantified from viewing multiple images and fields (right panel). Scale bar = 500 nm, Data are represented as the mean ± SEM. *P<0.01, unpaired Student's t test. (D) MC-dependent anaphylaxis requires the secretion of MVs from nearby DCs. CRISPR-Cas9 generated Vps4a−/− BMDCs or mock-transfected BMDCs were generated. Confirmation of the specificity of Vps4a−/− is shown in Fig. S16 and S17. CD11c depleted mice (CD11c-DTR) were reconstituted with Vps4a−/− BMDCs or mock transfected BMDCs. The successful reconstitution of BMDCs is shown in Fig. S19. MCs in the reconstituted mice or littermate control mice were sensitized with i.d. injection of TNP-specific IgE antibody. On the following day, mice were i.v. challenged with TNP-OVA along with Evans Blue dye. After 30 min, the ears of mice were imaged (upper panels) and dissected for dye extraction and quantitation as shown in bar graph (lower panel). N= 4-7 mice per group, data are represented as the mean ± SEM. **P<0.05, N.S. not significant, one-way ANOVA, Tukey's multiple comparisons test. (E) The MR mediates OVA antigen acquisition by DCs. The DC line was pre-incubated with various concentrations of mannan (1, 5, and 10 mg/ml) or and then primed with TNP-OVA (0.1 μg/ml). This cell line was then added to IgE-sensitized BMMCs and MC degranulation was assessed. Data are represented as the mean ± SEM. *P<0.01, **P<0.05, one-way ANOVA, Tukey's multiple comparisons test. (F) The MR on DCs is responsible for binding OVA antigen. A DC line transfected with MR siRNA or NS siRNA was primed with TNP-OVA (0.1 μg/ml) and exposed to IgE sensitized BMMCs. The MC degranulation response was then evaluated. Data are represented as the mean ± SEM. *P<0.01, one-way ANOVA, Tukey's multiple comparisons test. Two to three separate experiments were performed for each individual figure.

Comment in

  • Dangerous liaisons in anaphylaxis.
    Levi-Schaffer F, Scheffel J. Levi-Schaffer F, et al. Science. 2018 Nov 9;362(6415):640-641. doi: 10.1126/science.aav4505. Science. 2018. PMID: 30409871 No abstract available.
  • A Shocking Type of Communication.
    Sallis BF, Fiebiger E. Sallis BF, et al. Immunity. 2018 Dec 18;49(6):999-1001. doi: 10.1016/j.immuni.2018.12.004. Immunity. 2018. PMID: 30566890

Similar articles

Cited by

References

    1. Tejedor-Alonso MA, Moro-Moro M, Mugica-Garcia MV, Epidemiology of Anaphylaxis: Contributions From the Last 10 Years. J Investig Allergol Clin Immunol 25, 163–175; quiz follow 174–165 (2015). - PubMed
    1. Boden SR, Wesley Burks A, Anaphylaxis: a history with emphasis on food allergy. Immunol Rev 242, 247–257 (2011). - PMC - PubMed
    1. Simons FE, O. World Allergy, World Allergy Organization survey on global availability of essentials for the assessment and management of anaphylaxis by allergy-immunology specialists in health care settings. Ann Allergy Asthma Immunol 104, 405–412 (2010). - PubMed
    1. Sampson HA et al., Symposium on the definition and management of anaphylaxis: summary report. J Allergy Clin Immunol 115, 584–591 (2005). - PubMed
    1. Cheng LE, Hartmann K, Roers A, Krummel MF, Locksley RM, Perivascular mast cells dynamically probe cutaneous blood vessels to capture immunoglobulin E. Immunity 38, 166–175 (2013). - PMC - PubMed

Publication types

Substances