. 2018 Nov 9;362(6415):686-690.
doi: 10.1126/science.aar7981.

Heterogeneity in efflux pump expression predisposes antibiotic-resistant cells to mutation

Affiliations

Heterogeneity in efflux pump expression predisposes antibiotic-resistant cells to mutation

Imane El Meouche et al. Science. .

Abstract

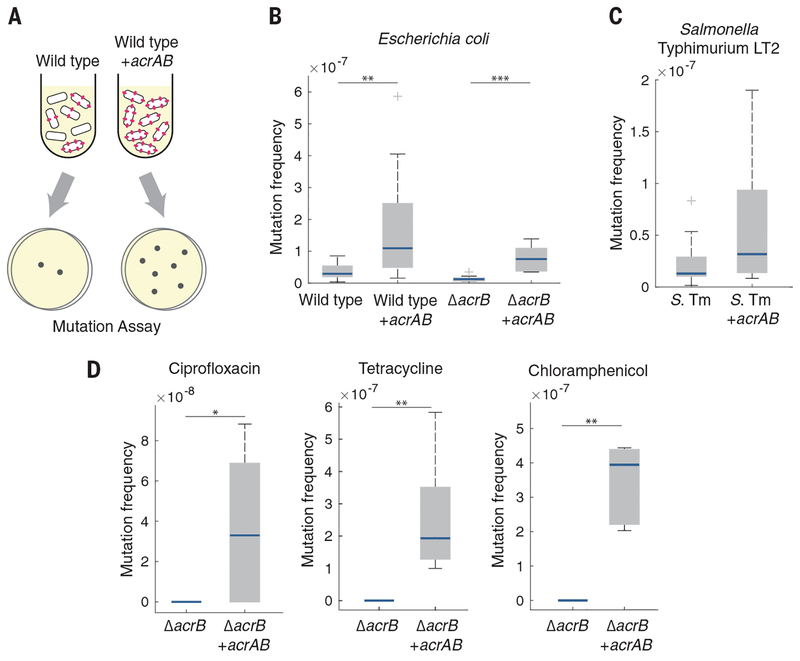
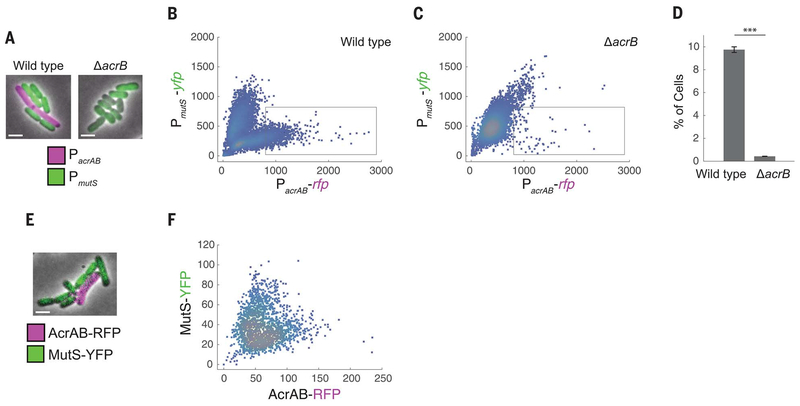
Antibiotic resistance is often the result of mutations that block drug activity; however, bacteria also evade antibiotics by transiently expressing genes such as multidrug efflux pumps. A crucial question is whether transient resistance can promote permanent genetic changes. Previous studies have established that antibiotic treatment can select tolerant cells that then mutate to achieve permanent resistance. Whether these mutations result from antibiotic stress or preexist within the population is unclear. To address this question, we focused on the multidrug pump AcrAB-TolC. Using time-lapse microscopy, we found that cells with higher acrAB expression have lower expression of the DNA mismatch repair gene mutS, lower growth rates, and higher mutation frequencies. Thus, transient antibiotic resistance from elevated acrAB expression can promote spontaneous mutations within single cells.


Conflict of interest statement

Competing interests: The authors declare no competing interests.

Figures

Fig. 1.
Fig. 1.. Overexpression of AcrAB increases the spontaneous mutation frequency.
(A) Schematic showing an increase in spontaneous mutations in cells with higher efflux pump expression. (B) Rifampicin mutation frequency in E. coli wild-type and ΔacrB strains with and without acrAB overexpression. n ≥ 8 biological replicates. (C) Rifampicin mutation frequency in S. Typhimurium (S. Tm) LT2. n ≥ 12 biological replicates. (D) Ciprofloxacin, tetracycline, and chloramphenicol mutation frequencies in E. coli ΔacrB. n ≥ 5 biological replicates. The ΔacrB strain in (D) did not produce any mutants in the presence of any of the antibiotics; mutants were observed for all antibiotics in the acrAB overexpression strain. For (B) to (D), blue bars show the median values, gray boxes indicate the interquartile range, and whiskers show the maximum and minimum values. Box plot raw data are shown in fig. S9A. Strains without acrAB overexpression contained an equivalent plasmid expressing cfp in place of acrAB. *P < 0.05; **P < 0.01;***P < 0.001, Mann-Whitney rank sum test.
Fig. 2.
Fig. 2.. Inverse relationship between acrAB expression and mutS expression in single cells.
(A) Fluorescence microscopy images of E. coli wild-type and ΔacrB strains containing the double-color reporter PacrAB-rfp + PmutS-yfp. Scale bars, 2 μm. (B and C) RFP fluorescence reflecting acrAB promoter activity versus YFP fluorescence reflecting mutS promoter activity in (B) wild-type and (C) ΔacrB strains. Each dot corresponds to one cell. The gray box indicates the region of interest used for (D). (D) Percentages of the cell populations that fall within the region-of-interest box. Error bars, ± SEM. ***P < 0.001, two-sample t test. (E) Wild-type E. coli containing translational fusion PacrAB-acrAB-rfp + PmutS-mutS-yfp. (F) AcrAB-RFP versus MutS-YFP. All fluorescence data were obtained after background subtraction to remove autofluorescence. Values in (B), (C), and (F) are expressed in arbitrary units.
Fig. 3.
Fig. 3.. Reduced growth rate in single cells with high PacrAB and low PmutS expression.
(A) Time-lapse microscopy images of wild-type cells expressing PacrAB-rfp + PmutS-yfp. Scale bar, 2 μm. (B) PacrAB-rfp expression versus PmutS-yfp expression in the wild-type strain. The purple dots correspond to cells whose growth rate falls in the bottom 10% of those measured. (C) PacrAB-rfp expression and (D) PmutS-yfp expression versus the growth rate in the wild-type strain. (E) ΔacrB cells expressing PacrAB-rfp and PmutS-yfp. (F) PacrAB-rfp expression versus PmutS-yfp expression in ΔacrB cells. (G) PacrAB-rfp expression and (H) PmutS-yfp expression versus the growth rate in the ΔacrB strain. Red lines in (C), (D), (G), and (H) plot the mean fluorescence of cells binned across growth rate in increments of 0.004 min−1, where each bin has a minimum of 15 cells. Error bars, ± SEM. Negative growth rates arise when the automated cell identification process identifies a cell in a subsequent frame as having a smaller number of pixels; however, this is an infrequent event (~2% of cells). Values in (B) to (D) and (F) to (H) are expressed in arbitrary units.

Comment in

  • Reduce your speed.
    York A. York A. Nat Rev Microbiol. 2019 Jan;17(1):1. doi: 10.1038/s41579-018-0127-8. Nat Rev Microbiol. 2019. PMID: 30470813 No abstract available.

References

    1. Alekshun MN, Levy SB, Cell 128, 1037–1050 (2007). - PubMed
    1. Levin BR, Rozen DE, Nat. Rev. Microbiol 4, 556–562 (2006). - PubMed
    1. Mulcahy LR, Burns JL, Lory S, Lewis K, J. Bacteriol 192, 6191–6199 (2010). - PMC - PubMed
    1. Balaban NQ, Merrin J, Chait R, Kowalik L, Leibler S, Science 305, 1622–1625 (2004). - PubMed
    1. El Meouche I, Siu Y, Dunlop MJ, Sci. Rep 6, 19538 (2016). - PMC - PubMed

Publication types

MeSH terms

Substances