. 2018 Nov 9;362(6415):694-699.
doi: 10.1126/science.aat5030.

WDFY4 is required for cross-presentation in response to viral and tumor antigens

Affiliations

WDFY4 is required for cross-presentation in response to viral and tumor antigens

Derek J Theisen et al. Science. .

Abstract

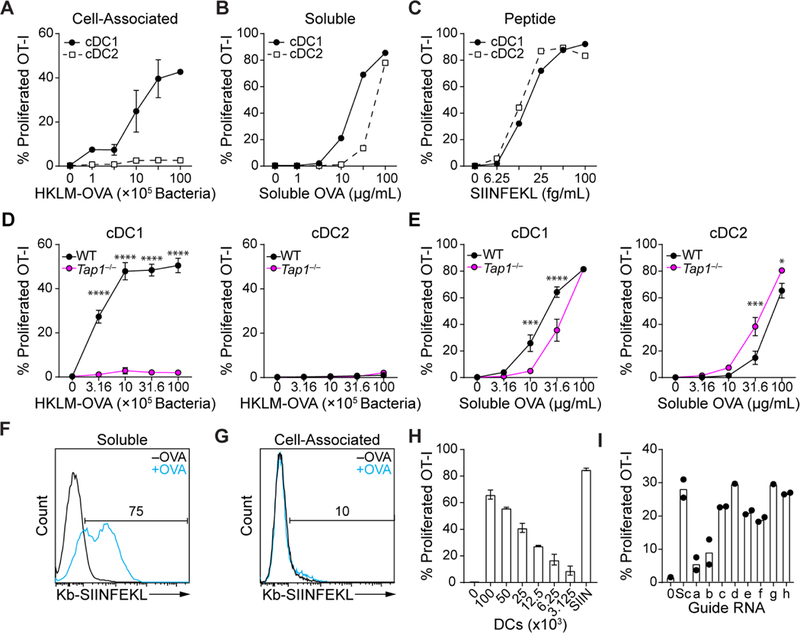
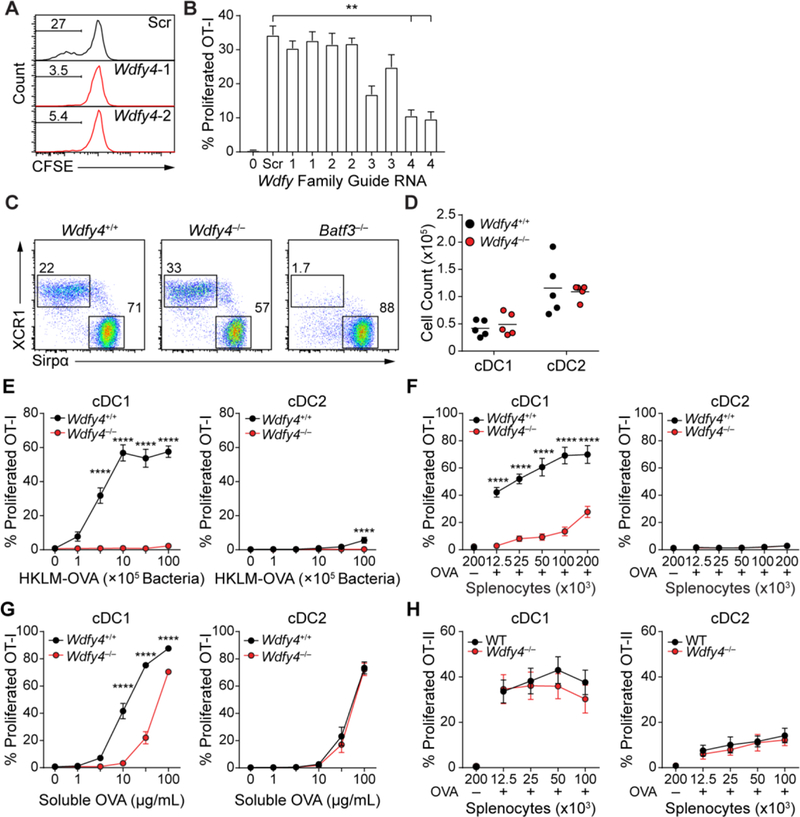
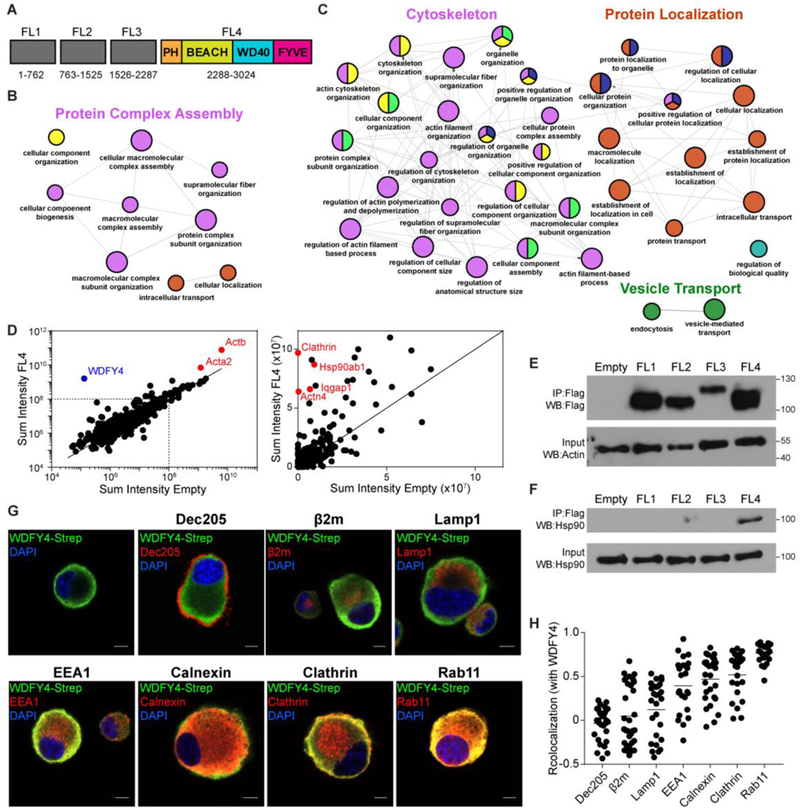
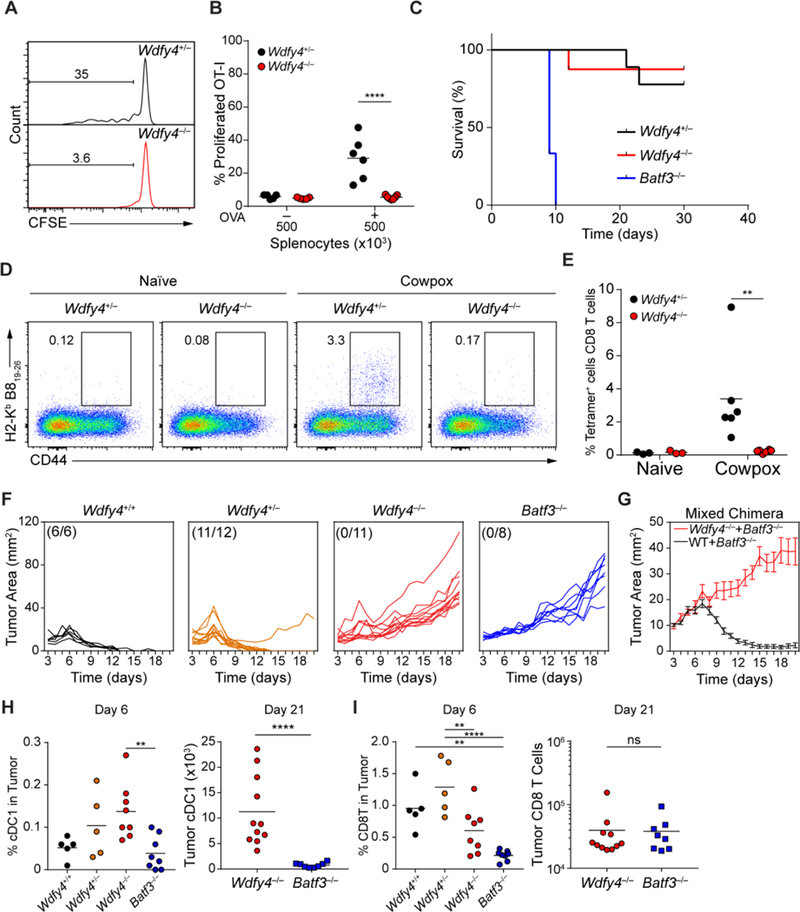
During the process of cross-presentation, viral or tumor-derived antigens are presented to CD8+ T cells by Batf3-dependent CD8α+/XCR1+ classical dendritic cells (cDC1s). We designed a functional CRISPR screen for previously unknown regulators of cross-presentation, and identified the BEACH domain-containing protein WDFY4 as essential for cross-presentation of cell-associated antigens by cDC1s in mice. However, WDFY4 was not required for major histocompatibility complex class II presentation, nor for cross-presentation by monocyte-derived dendritic cells. In contrast to Batf3 -/- mice, Wdfy4 -/- mice displayed normal lymphoid and nonlymphoid cDC1 populations that produce interleukin-12 and protect against Toxoplasma gondii infection. However, similar to Batf3 -/- mice, Wdfy4 -/- mice failed to prime virus-specific CD8+ T cells in vivo or induce tumor rejection, revealing a critical role for cross-presentation in antiviral and antitumor immunity.


Figures

Fig. 1.
Fig. 1.. Establishment of a CRISPR/Cas9 screen for cross-presentation of cell-associated antigens.
(A-C) Increasing concentrations of HKLM-OVA (A), soluble ovalbumin (B) or SIINFEKL peptide were cultured with sort-purified cDCland cDC2 for three days with CFSE-labeled OT-I T cells and assayed for proliferation (CFSECD44+). (D, E) WT or Tap1−/− sort-purified cDCl and cDC2 were cultured for three days with varying concentrations of HKLM-OVA (D) or soluble OVA (E) and CFSE-labeled OT-I T cells and assayed for proliferation (CFSECD44+). (F-G) Sorted cDCl were cultured with 100 μg/mL soluble ovalbumin (F) or 106 splenocytes osmotically loaded with OVA (G), cultured for 48 hours and stained with 25-D1.16 and analyzed by flow cytometry. (H) CFSE-labeled OT-I cells were cultured with the indicated number of whole Flt3L-generated DCs and 107 HKLM-OVA or 25 fg/mL SIINFEKL peptide (SIIN) and proliferation measured as in (A). (I) c-Kithi bone marrow progenitors from Cas9 transgenic mice were infected with retroviruses expressing various sgRNAs (Supplementary Table 2), cultured with Flt3L for seven days, and infected cDCs tested for cross-presentation to CFSE-labeled OT-I T cells as in (H), Sc=Scramble. Activated T cells gated as CFSECD44+. For all figures data indicate mean ±SEM. For all figures, statistical analysis was performed using 2-way ANOVA with Tukey’s multiple comparisons test. *P<0.05; ***P<0.001; ****P<0.0001
Fig. 2.
Fig. 2.. Wdfy4 is selectively required for cross-presentation of cell-associated antigens by cDC1.
(A) Cross-presentation was measured for Cas9-transgenic cDCl expressing two sgRNA (1 and 2; middle and bottom) for Wdfy4 or a scramble control (top) that were generated as described in (Fig. 1I). T cell proliferation shown by percentages of CFSE OT-I cells. (B) Cross-presentation by cDCl expressing sgRNAs for Wdfy1, Wdfy2, Wdfy3 and Wdfy4 was measured as described in (Fig. 1I). Scr=Scramble. Activated T cells gated as CFSECD44+. Data indicate mean ± SEM of 3 independent experiments (C) cDC1 and cDC2 development was assessed by flow cytometry in WT, Wdfy4−/− and Batf3−/− mice, plots were pre-gated as B220CD11c+MHCII+ and then gated as cDC1 (XCR1+Sirpα) or cDC2 (XCR1Sirpα+). (D) absolute cell numbers of cDC1 and cDC2 in WT and Wdfy4−/− mice. Each dot indicates one mouse, bar indicates mean. (E) FACS sorted cDC1 and cDC2 from spleens of WT and Wdfy4−/− mice were assayed for presentation to OT-I (CFSECD44+) in response to the indicated concentrations of HKLM-OVA. (F) FACS sorted cDC1 and cDC2 from spleens of bone marrow chimeric mice with WT or Wdfy4−/− bone marrow were assayed for presentation to OT-I (CFSECD44+) in response to indicated concentrations of OVA-loaded irradiated splenocytes from MHCI TKO mice. A negative control of splenocytes osmotically pulsed in the absence of OVA, OVA-, was included (G) FACS sorted cDC1 and cDC2 from spleens of WT and Wdfy4−/− mice were assayed for presentation to OT-I (CFSECD44+) in response to indicated concentrations of soluble OVA. (H) FACS sorted cDC1 and cDC2 from spleens of WT and Wdfy4−/− mice were assayed for presentation to OT-II (CFSECD44+) in response to indicated concentrations of OVA-loaded irradiated splenocytes from MHCII KO mice. A negative control of splenocytes osmotically pulsed in the absence of OVA, OVA-, was included. For all figures, data indicate mean ±SEM for three independent experiments, *P<0.05; **P<0.01; ****P<0.0001 using 2-way ANOVA with Tukey’s multiple comparisons test.
Fig. 3.
Fig. 3.. WDFY4 acts near the plasma membrane and associates with proteins involved in localization and vesicular transport.
(A) Diagram of truncated fragments of WDFY4 protein, showing predicted domains within FL4 fragment. Numbers indicate amino-acid locations of fragments. (B) ClueGO visualization of gene ontology terms enriched after immunoprecipitation of fragments from (A) in the mouse DC line JAWSII, expressing either FL1 or FL2 fragments. Small circles P<.001, large circles P<.0001. Colors indicate Gene Ontology (GO) term groups. (C) ClueGO visualization of gene ontology terms enriched after immunoprecipitation of fragments from (A) in the mouse DC line JAWSII expressing either FL3 or FL4 fragments. Small circles P<3×10⁻⁵, large circles P<3×10⁻⁶. Colors indicate GO term groups. (D) Scatterplot of representative data for sum intensity of proteins found after mass spectrometry between FL4 expressing and empty-vector expressing JAWSII cells. (E) Western blot of Flag immunoprecipitates from HEK293 cells transfected with empty-vector or Flag-tagged WDFY4 fragments 1 to 4 (top), and input control for β-actin (bottom) (F) Western blot for endogenous Hsp90 in Flag immunoprecipitates from HEK293 transfected with empty-vector or Flag-tagged WDFY4 fragments 1 to 4 (top) and input control for endogenous Hsp90 (bottom) (G) Confocal microscopy of JAWSII cells overexpressing full length Twin-Strep-tagged WDFY4, stained for anti-Strep (green), various cellular markers (red), and DAPI (blue). Scale bars indicate 5μm. (H) Quantification of co-localization between WDFY4 and intracellular markers from images in (G), each dot represents one cell, bar indicates the mean.
Fig. 4.
Fig. 4.. Wdfy4−/− mice are unable to cross-present in vivo
(A-B) Representative flow cytometry analysis of in vivo cross-presentation to 500K irradiated splenocytes loaded with OVA injected i.v. into mice of the indicated genotypes one day after injection of 500K CFSE-labeled OT-I cells. Mice were harvested three days after antigen injection, quantified in (B). Data pre-gated on OT-I cells and shown as percentage of CFSE cells (A) or CFSECD44+ cells (B). Data are pooled from three independent experiments; each point represents one mouse. (C) Survival of mice of the indicated genotypes to injection of 200 Pru.luc T. gondii tachyzoites over 30 days. WDFY4+/− n=9, WDFY4−/− n=8, Batf3−/− n=3. (D-E) Representative flow cytometry plots of CD8 T cells (pre-gate CD4CD3+CD8+) in lungs of naïve or cowpox infected mice, quantified in (E). Each dot represents one mouse, bar indicates mean. (F) Mice of the indicated genotypes were injected with 1×10⁶ fibrosarcoma cells s.c. and tumors were measured daily starting at day three after injection. (G) Mixed bone marrow chimeras with bone marrow of indicated genotypes were injected into lethally irradiated CD45.1+ WT B6 mice. Eight weeks later, mice were injected with 1×10⁶ fibrosarcoma cells s.c. and tumors were measured daily starting at day three after injection. Data show mean ± SEM of 9 mice per group. (H) Quantification of cDC1 in tumors at either day 6 or day 21 after injection taken from mice of indicated genotypes. Gated as B220CD11c+MHCII+CD103+CD11b. Each dot indicates one mouse, bar indicates mean. (I) Quantification of CD8 T cells in tumors at either day 6 or day 21 after injection taken from mice of indicated genotypes. Gated as CD45+TCRβ+CD8α+CD4. Each dot indicates one mouse, bar indicates mean. For all figures, ** P<.01; **** P<0.0001 using 2-way ANOVA with Tukey’s multiple comparisons test.

Comment in

References

    1. Blum JS, Wearsch PA, Cresswell P, Pathways of antigen processing Annu.Rev Immunol 31, 443–473 (2013). - PMC - PubMed
    1. Murphy TL, Grajales-Reyes GE, Wu X, Tussiwand R, Briseno CG, Iwata A, Kretzer NM, Durai V, Murphy KM, Transcriptional Control of Dendritic Cell Development Annu.Rev Immunol 34, 93–119 (2016). - PMC - PubMed
    1. Durai V, Murphy KM, Functions of Murine Dendritic Cells Immunity 45, 719–736 (2016). - PMC - PubMed
    1. Guilliams M, Ginhoux F, Jakubzick C, Naik SH, Onai N, Schraml BU, Segura E, Tussiwand R, Yona S, Dendritic cells, monocytes and macrophages: a unified nomenclature based on ontogeny Nat.Rev.Immunol. 14, 571–578 (2014). - PMC - PubMed
    1. Crozat K, Tamoutounour S, Vu Manh TP, Fossum E, Luche H, Ardouin L, Guilliams M, Azukizawa H, Bogen B, Malissen B, Henri S, Dalod M, Cutting edge: expression of XCR1 defines mouse lymphoid-tissue resident and migratory dendritic cells of the CD8alpha+ type J.Immunol. 187, 4411–4415 (2011). - PubMed

Publication types

MeSH terms

Substances