. 2019 Jan 4;294(1):269-280.
doi: 10.1074/jbc.RA118.004591. Epub 2018 Nov 8.

Functional consequences of the CAPOS mutation E818K of Na+,K+-ATPase

Affiliations

Functional consequences of the CAPOS mutation E818K of Na+,K+-ATPase

Christian P Roenn et al. J Biol Chem. .

Abstract

The cerebellar ataxia, areflexia, pes cavus, optic atrophy, and sensorineural hearing loss (CAPOS) syndrome is caused by the single mutation E818K of the α3-isoform of Na+,K+-ATPase. Here, using biochemical and electrophysiological approaches, we examined the functional characteristics of E818K, as well as of E818Q and E818A mutants. We found that these amino acid substitutions reduce the apparent Na+ affinity at the cytoplasmic-facing sites of the pump protein and that this effect is more pronounced for the lysine and glutamine substitutions (3-4-fold) than for the alanine substitution. The electrophysiological measurements indicated a more conspicuous, ∼30-fold reduction of apparent Na+ affinity for the extracellular-facing sites in the CAPOS mutant, which was related to an accelerated transition between the phosphoenzyme intermediates E1P and E2P. The apparent affinity for K+ activation of the ATPase activity was unaffected by these substitutions, suggesting that primarily the Na+-specific site III is affected. Furthermore, the apparent affinities for ATP and vanadate were WT-like in E818K, indicating a normal E1-E2 equilibrium of the dephosphoenzyme. Proton-leak currents were not increased in E818K. However, the CAPOS mutation caused a weaker voltage dependence of the pumping rate and a stronger inhibition by cytoplasmic K+ than the WT enzyme, which together with the reduced Na+ affinity of the cytoplasmic-facing sites precluded proper pump activation under physiological conditions. The functional deficiencies could be traced to the participation of Glu-818 in an intricate hydrogen-bonding/salt-bridge network, connecting it to key residues involved in Na+ interaction at site III.

Keywords: ATP1A3; Na+ site; Na+,K+-pump; Na+/K+-ATPase; P-type ATPase; electrophysiology; enzyme mechanism; membrane enzyme; membrane transport; mutant; neurological disease; potassium transport; site-directed mutagenesis; sodium transport.


Conflict of interest statement

The authors declare that they have no conflicts of interest with the contents of this article

Figures
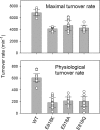
Figure 1.
Figure 1.
Maximal and physiological turnover rates for ATPase activity of the α3 WT and the E818K, E818A, and E818Q mutants. ATPase activity was measured on isolated, leaky plasma membranes from transfected COS cells at 37 °C in the presence of 30 mm histidine (pH 7.4), 3 mm Mg2+, 1 mm EGTA, 3 mm ATP, 10 μm ouabain, and (for maximal turnover rate) 130 mm Na+ and 20 mm K+ or (for physiological turnover rate) 15 mm Na+ and 130 mm K+. The turnover rate was calculated by relating the ATPase activity to the active site concentration determined as the maximal capacity for phosphorylation (see “Experimental procedures”). The data points from individual determinations are shown superimposed on bar graphs showing mean values with error bars indicating S.D.
Scheme 1.
Scheme 1.
Na+,K+-ATPase reaction cycle. E1 and E2 represent the main conformational states of the enzyme. Occluded Na+ and K+ ions are shown in brackets, and free ions are labeled c and e for cytoplasmic and extracellular, respectively. P indicates phosphorylation. Boxed ATP indicates ATP bound in a nonphosphorylating mode, enhancing the rate of K+ deocclusion and the accompanying E2–E1 conformational change.
Figure 2.
Figure 2.
Na+ dependence of Na+,K+-ATPase activity of the α3 WT and the E818K, E818A, and E818Q mutants. ATPase activity was measured on isolated, leaky plasma membranes from transfected COS cells at 37 °C in the presence of 30 mm histidine (pH 7.4), 20 mm K+, 3 mm Mg2+, 1 mm EGTA, 3 mm ATP, 10 μm ouabain, and the indicated concentrations of Na+. Multiple sets (n = 4) of experiments, each covering the whole concentration range, were carried out, and each data point shown represents the mean with error bars corresponding to S.D. The K0.5 was determined for each set of experiments by fitting a Hill function (Equation 1 under “Experimental procedures”), and the mean values are indicated ± S.D. Each line represents the best fit of Equation 1 to all data points. For direct comparison, the dotted line reproduces the data for α3 WT from the upper left panel.
Figure 3.
Figure 3.
Na+ dependence of phosphorylation from ATP of the α3 WT and the E818K, E818A, and E818Q mutants. Phosphorylation was carried out on isolated, leaky plasma membranes from transfected COS cells for 10 s at 0 °C in the presence of 20 mm Tris (pH 7.4), 3 mm Mg2+, 1 mm EGTA, 2 μm [γ-32P]ATP, 20 μg/ml oligomycin to block dephosphorylation, 10 μm ouabain to inhibit the endogenous COS cell enzyme, and the indicated concentrations of Na+ with various concentrations of N-methyl-d-glucamine added to maintain a constant ionic strength. Multiple sets (n = 4–7) of experiments, each covering the whole concentration range, were carried out, and each data point shown represents the mean with error bars corresponding to S.D. The K0.5 was determined for each set of experiments by fitting a Hill function (Equation 1 under “Experimental procedures”), and the mean values are indicated ± S.D. Each line represents the best fit of Equation 1 to all data points. For direct comparison, the dotted line reproduces the data for α3 WT from the upper left panel.
Figure 4.
Figure 4.
K+ dependence of Na+,K+-ATPase activity of the α3 WT and the E818K, E818A, and E818Q mutants. ATPase activity was measured on isolated, leaky plasma membranes from transfected COS cells at 37 °C in the presence of 30 mm histidine (pH 7.4), 40 mm Na+, 3 mm Mg2+, 1 mm EGTA, 3 mm ATP, 10 μm ouabain, and the indicated concentrations of K+. Multiple sets (n = 4–7) of experiments, each covering the whole concentration range, were carried out, and each data point shown represents the mean with error bars corresponding to S.D. The K0.5 for the K+ activation phase was determined for each set of experiments, and the mean values are indicated ± S.D. For direct comparison, the dotted line reproduces the data for α3 WT from the upper left panel.
Figure 5.
Figure 5.
ATP dependence of Na+,K+-ATPase activity of the α3 WT and the E818K, E818A, and E818Q mutants. ATPase activity was measured on isolated, leaky plasma membranes from transfected COS cells at 37 °C in the presence of 30 mm histidine (pH 7.4), 130 mm Na+, 20 mm K+, 3 mm Mg2+, 1 mm EGTA, 10 μm ouabain, and the indicated concentrations of ATP. Multiple sets (n = 4–7) of experiments, each covering the whole concentration range, were carried out, and each data point shown represents the mean with error bars corresponding to S.D. The K0.5 was determined for each set of experiments by fitting a Hill function (Equation 1 under “Experimental procedures”), and the mean values are indicated ± S.D. Each line represents the best fit of Equation 1 to all data points. For direct comparison, the dotted line reproduces the data for α3 WT from the upper left panel.
Figure 6.
Figure 6.
Vanadate dependence of Na+,K+-ATPase activity of the α3 WT and the E818K, E818A, and E818Q mutants. ATPase activity was measured on isolated, leaky plasma membranes from transfected COS cells at 37 °C in the presence of 30 mm histidine (pH 7.4), 130 mm Na+, 20 mm K+, 3 mm Mg2+, 1 mm EGTA, 3 mm ATP, 10 μm ouabain, and the indicated concentrations of vanadate. Multiple sets (n = 3–5) of experiments, each covering the whole concentration range, were carried out, and each data point shown represents the mean with error bars corresponding to S.D. The K0.5 was determined for each set of experiments by fitting a Hill equation for inhibition (Equation 2 under “Experimental procedures”), and the mean values are indicated ± S.D. Each line represents the best fit of Equation 2 to all data points. For direct comparison, the dotted line reproduces the data for α3 WT from the upper left panel.
Figure 7.
Figure 7.
Pre–steady-state relaxations in the absence of external K+ induced by voltage steps for the α3 WT and the CAPOS mutant E818K. A, recordings of the ouabain-sensitive current (in absence of external K+) in response to the voltage step protocol shown, as obtained from representative oocytes expressing either the α3 WT or the E818K mutant. The records were baseline-corrected. B, main relaxation time constant obtained by fitting the ON relaxations to a single exponential function commencing ∼5 ms after the step onset. The time constant at −40 mV was estimated from the mean of τOFF. C, normalized Q–V relations for the same cells as in B. Continuous lines are fits using the Boltzmann function (see Equation 4 in “Experimental procedures”). For each cell, the Q–V data were first fit to obtain Qmax and Qhyp. The individual oocyte data sets were offset by Qhyp and normalized to Qmax before pooling. The data points in B and C are shown as mean values ± S.D.
Figure 8.
Figure 8.
Pump and proton current voltage dependence for the α3 WT and the CAPOS mutant E818K. A, pump current in the presence of 15 mm external K+ for a representative oocyte expressing α3 WT (left panel) and E818K (right panel) induced by voltage steps shown. The gray line indicates zero current. The traces were blanked 1.95 ms at the leading and trailing edge of each voltage step to remove a nonspecific artifact from the subtraction procedure. B, voltage dependence of normalized forward cycle pump currents in the presence of 15 mm external K+ (Ipump) pooled by normalizing the I–V for each oocyte to Ipump at 0 mV. C, turnover rates for forward cycle pump currents. For each oocyte, the number of active pumps was estimated from Qmax/ze, obtained from the Boltzmann fits. The pump turnover is then given by: Ipump·ze/Qmax. D, comparison of proton currents (Iprot) observed in the absence of external Na+ and K+. Each data point was scaled by the estimated number of pumps for that oocyte and the data pooled. E, voltage dependence of Iprot. For each oocyte Iprot was normalized to the value at −120 mV, and the data was pooled. The data points in B–E are shown as mean values ± S.D.
Figure 9.
Figure 9.
E1P–E2P distribution of the phosphoenzyme of the α3 WT and the CAPOS mutant E818K. Phosphorylation was carried out for 10 s at 0 °C in 20 mm Tris (pH 7.5), 20 mm NaCl, 3 mm MgCl2, 1 mm EGTA, 2 μm [γ-32P]ATP, and 10 μm ouabain. Dephosphorylation was followed at 0 °C upon the addition of 2.5 mm ADP and 1 mm ATP. Multiple sets (n = 5) of experiments, each covering the whole time range, were carried out, and each data point shown represents the mean with error bars corresponding to S.D. A biexponential function (Equation 3 under “Experimental procedures”) was fitted to each data set. The extent of the slow component corresponding to the fraction of phosphoenzyme, which is ADP-insensitive E2P, was extracted, and the mean values are indicated ± S.D. Each line represents the best fit of Equation 3 to all data points.
Figure 10.
Figure 10.
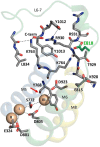
Structural relations of the CAPOS residue Glu-818. Shown is the part of the Na+-bound E1 crystal structure of the α1 Na+,K+-ATPase (Protein Data Bank code 3WGV, chain A) (24) encompassing transmembrane helices M5, M6, and M8, with the cytoplasmic loop L6–7 connecting M6 with M7, the N-terminal part of the L8–9 loop connecting M8 and M9 (Lys-928, Thr-929, Arg-930, and Arg-931), and two C-terminal tyrosines (Tyr-1012 and Tyr-1013). Selected residues are indicated by stick representation and numbered according to α3 (all these residues are conserved between α1 and α3). The three bound Na+ are shown as golden spheres labeled I, II, and III. The dotted lines indicate important hydrogen bonds and coordination bonds to the ions. Carbon atoms are gray, oxygen atoms are red, and nitrogen atoms are blue, except for the CAPOS residue (Glu-818), in which carbon atoms are green. The CAPOS residue forms three hydrogen bonds, to M5 (Lys-764) and to L8–9 (Arg-930 and Arg-931 backbone nitrogens), stabilizing the interactions of key residues in M5 and M8 (Ser-772, Tyr-768, and Asp-923) with the Na+ ion III. A change of the inclination of M5 by 10° is expected to allow the larger K+ ion to bind at site III in competition with Na+, because of movement of the main-chain carbonyl group of Tyr-768 (red arrow), reducing the Na+ selectivity of site III.

References

    1. Skou J. C. (1957) The influence of some cations on an adenosine triphosphatase from peripheral nerve. Biochim. Biophys. Acta 23, 394–401 10.1016/0006-3002(57)90343-8 - DOI - PubMed
    1. Kaplan J. H. (2002) Biochemistry of Na,K-ATPase. Annu. Rev. Biochem. 71, 511–535 10.1146/annurev.biochem.71.102201.141218 - DOI - PubMed
    1. Shull G. E., Greeb J., and Lingrel J. B. (1986) Molecular cloning of three distinct forms of the Na+,K+-ATPase α-subunit from rat brain. Biochemistry 25, 8125–8132 10.1021/bi00373a001 - DOI - PubMed
    1. Blanco G., and Mercer R. W. (1998) Isozymes of the Na-K-ATPase: heterogeneity in structure, diversity in function. Am. J. Physiol. 275, F633–F650 - PubMed
    1. De Fusco M., Marconi R., Silvestri L., Atorino L., Rampoldi L., Morgante L., Ballabio A., Aridon P., and Casari G. (2003) Haploinsufficiency of ATP1A2 encoding the Na+/K+ pump α2 subunit associated with familial hemiplegic migraine type 2. Nat. Genet. 33, 192–196 10.1038/ng1081 - DOI - PubMed

Publication types

MeSH terms

Substances

Supplementary concepts

Associated data

LinkOut - more resources