. 2019 Jan 11;294(2):576-592.
doi: 10.1074/jbc.RA118.003844. Epub 2018 Nov 8.

Dynamic acetylation of the kinetochore-associated protein HEC1 ensures accurate microtubule-kinetochore attachment

Affiliations

Dynamic acetylation of the kinetochore-associated protein HEC1 ensures accurate microtubule-kinetochore attachment

Gangyin Zhao et al. J Biol Chem. .

Abstract

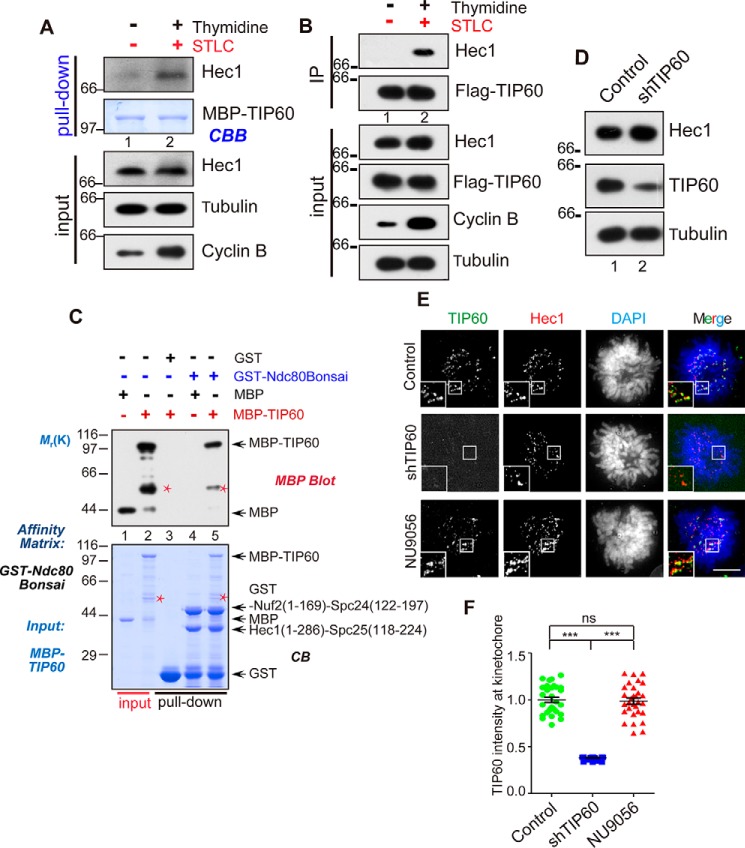
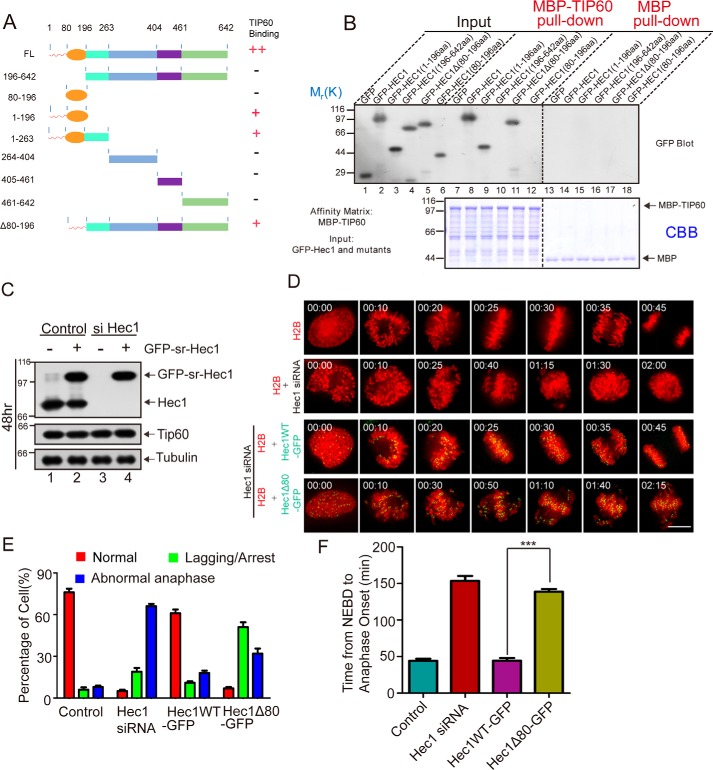
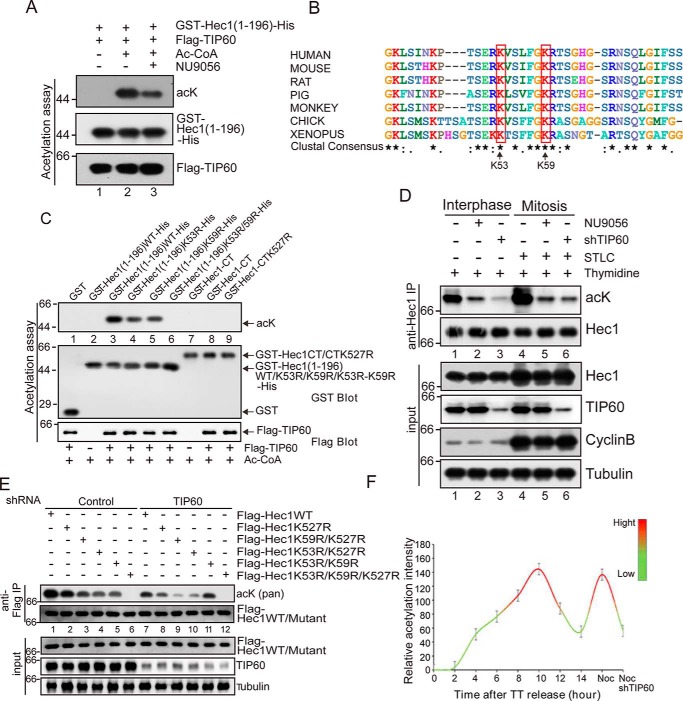
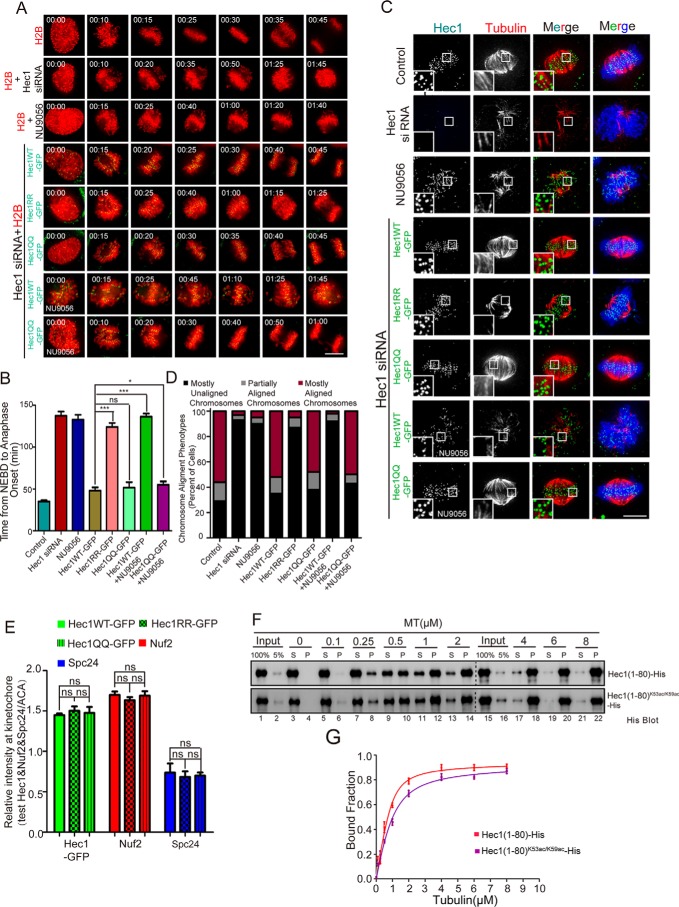
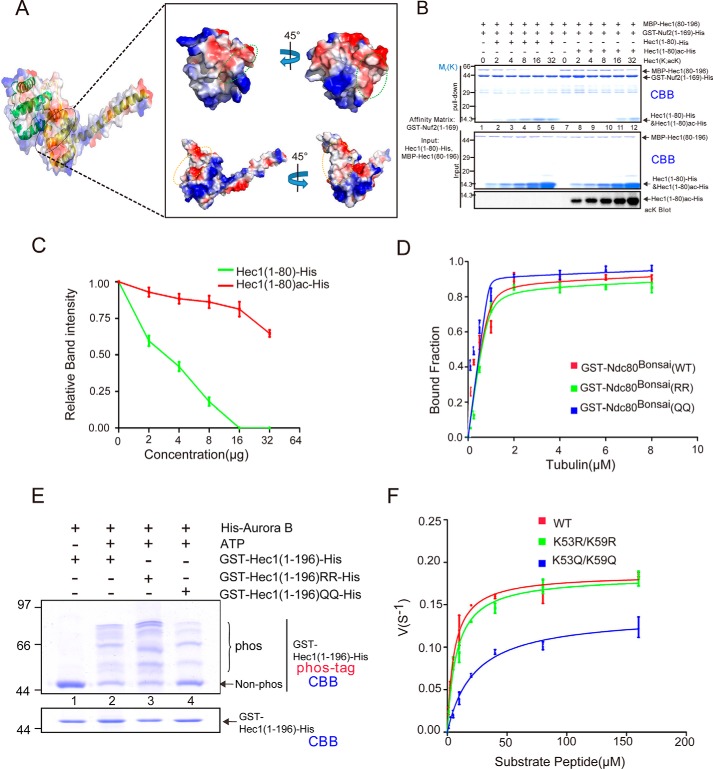
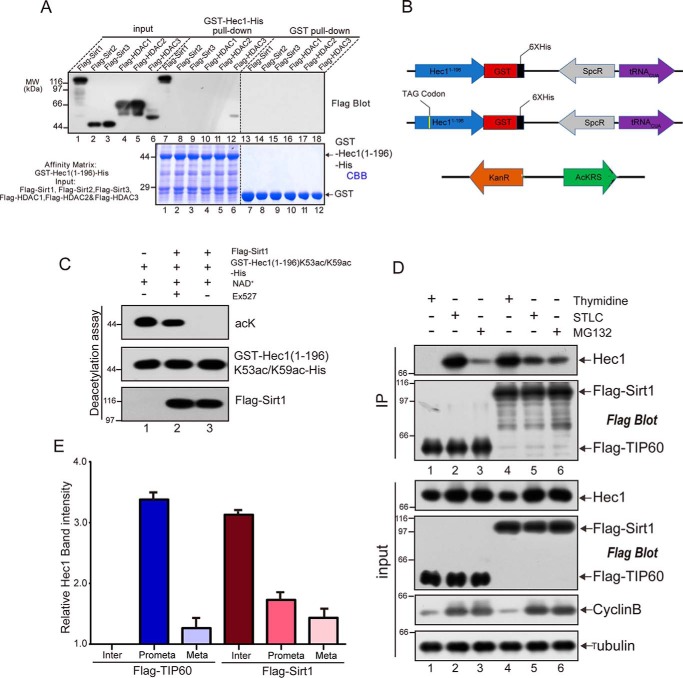
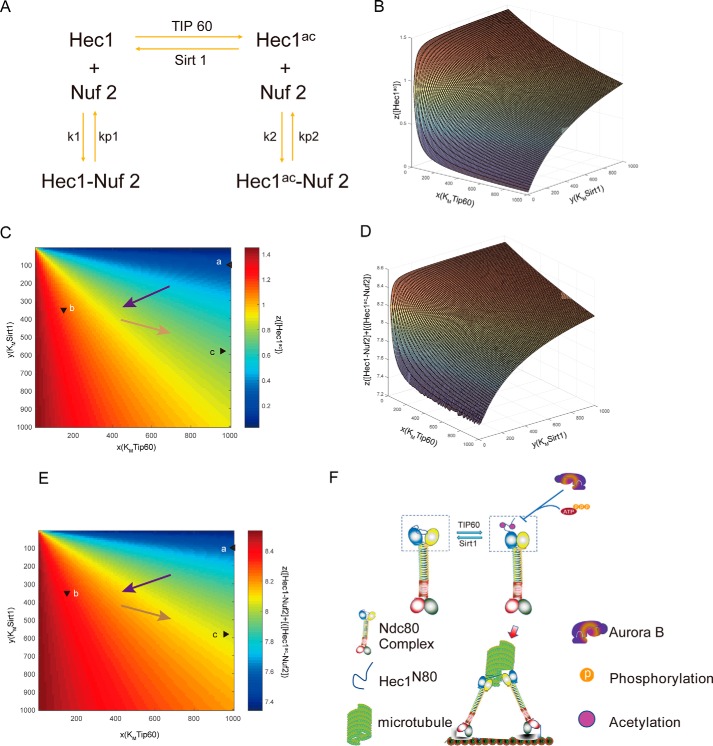
Faithful chromosome segregation during mitosis is critical for maintaining genome integrity in cell progeny and relies on accurate and robust kinetochore-microtubule attachments. The NDC80 complex, a tetramer comprising kinetochore protein HEC1 (HEC1), NDC80 kinetochore complex component NUF2 (NUF2), NDC80 kinetochore complex component SPC24 (SPC24), and SPC25, plays a critical role in kinetochore-microtubule attachment. Mounting evidence indicates that phosphorylation of HEC1 is important for regulating the binding of the NDC80 complex to microtubules. However, it remains unclear whether other post-translational modifications, such as acetylation, regulate NDC80-microtubule attachment during mitosis. Here, using pulldown assays with HeLa cell lysates and site-directed mutagenesis, we show that HEC1 is a bona fide substrate of the lysine acetyltransferase Tat-interacting protein, 60 kDa (TIP60) and that TIP60-mediated acetylation of HEC1 is essential for accurate chromosome segregation in mitosis. We demonstrate that TIP60 regulates the dynamic interactions between NDC80 and spindle microtubules during mitosis and observed that TIP60 acetylates HEC1 at two evolutionarily conserved residues, Lys-53 and Lys-59. Importantly, this acetylation weakened the phosphorylation of the N-terminal HEC1(1-80) region at Ser-55 and Ser-62, which is governed by Aurora B and regulates NDC80-microtubule dynamics, indicating functional cross-talk between these two post-translation modifications of HEC1. Moreover, the TIP60-mediated acetylation was specifically reversed by sirtuin 1 (SIRT1). Taken together, our results define a conserved signaling hierarchy, involving HEC1, TIP60, Aurora B, and SIRT1, that integrates dynamic HEC1 acetylation and phosphorylation for accurate kinetochore-microtubule attachment in the maintenance of genomic stability during mitosis.

Keywords: HEC1; NDC80 complex; NUF2; TIP60; chromosomal segregation; kinetochore; microtubule; mitosis; mitotic spindle; protein acylation; spindle assembly.


Conflict of interest statement

The authors declare that they have no conflicts of interest with the contents of this article

Figures

Figure 1.
Figure 1.
TIP60 interacts and co-localizes with HEC1 at kinetochore during mitosis. A, MBP-TIP60–bound agarose beads were used as affinity matrices to absorb HEC1 proteins from HeLa cell lysate, and bound proteins were then analyzed by Western blotting. Cells were synchronized in G1 with thymidine for 17 h and released into mitosis (4 h after thymidine release and treatment with STLC for an additional 4 h). Note that HEC1 from mitotic cells was retained on TIP60 affinity matrix. B, HeLa cells were transfected with FLAG-TIP60 for 12 h; in lane 2, cells were blocked with thymidine and STLC as in A. Cell lysate were clarified by centrifugation and subjected to immunoprecipitation with anti-FLAG antibody. Immunoprecipitate, after extensive washes, was fractionated by SDS-PAGE and subsequently analyzed by Western blot analyses. C, GST-NDC80Bonsai–bound agarose beads were used as affinity matrices to absorb MBP and MBP-TIP60 proteins. Proteins retained on affinity matrix, after extensive washes, were analyzed by SDS-PAGE followed by CBB staining (bottom) and Western blot analysis with an anti-MBP antibody (top). Red asterisk, nonspecific binding protein. D, HeLa cells were transfected with shTIP60 for 48 h followed by Western blot analyses to evaluate the efficiency of shTIP60. A tubulin blot served as loading control. E, HeLa cells were treated with shTIP60 and NU9056. After 24 h of transfection, cells were synchronized with thymidine for 17 h. After they were released from thymidine for 8 h, cells were fixed and co-stained for TIP60 (green), HEC1 (red), and DNA (blue). Scale bars, 10 μm. F, scatter plots of the TIP60 intensity at kinetochore in the cells treated as in E (30 kinetochores). Data represent mean ± S.E. (error bars). p values were determined by Student's test. ***, p < 0.001; ns, not significant.
Figure 2.
Figure 2.
Characterization of HEC1 interaction with TIP60 in mitosis. A, schematic representation of different HEC1 deletion mutants generated to pinpoint the TIP60-binding activity. B, 293T cells were transfected with GFP, GFP-HEC1, and GFP-tagged HEC1 deletion mutants (aa 1–196, aa 196–642, aa Δ80–196, and aa 80–196), respectively. The proteins retained on MBP and MBP-TIP60 affinity matrix were analyzed by SDS-PAGE and probed by GFP blotting (top), and the inputs of MBP and MBP-TIP60 protein were visualized by CBB staining (bottom). C, HeLa cells were co-transfected with GFP-HEC1 (siRNA-resistant) and control or HEC1 siRNA for 48 h and analyzed by Western blotting. D, HEC1-depleted cells were co-transfected with HEC1 WT or Δ1–80 mutant along with mCherry-H2B. Representative real-time images of each group are shown. Scale bar, 10 μm. E, quantification of the phenotype of cells in D. At least 30 cells from three separate experiments per group were analyzed. F, quantification of time intervals from nuclear envelope breakdown to anaphase onset in cells of D. At least 30 cells from three separate experiments per group were analyzed. Statistical significance was examined by two-sided t test. ns, not significant. ***, p < 0.001. Error bars, S.E.
Figure 3.
Figure 3.
Lys-53 and Lys-59 on HEC1 are bona fide substrates of TIP60. A, FLAG-TIP60 was incubated with GST-HEC1(1–196)-His in the presence of Ac-CoA for the in vitro acetylation assay. TIP60 specific inhibitor was also added in lane 3. The acetylation levels of HEC1 were analyzed with an anti-acetyllysine antibody (acK). B, sequence alignment of HEC1 from human, mouse, rat, pig, monkey, chicken, and Xenopus. Lys-53 and Lys-59 of human HEC1 were highlighted. *, evolutionary conservation. C, FLAG-TIP60 purified from HEK293T cells was incubated with GST, GST-HEC1(1–196)-His, GST-HEC1(1–196)K53R-His, GST-HEC1(1–196)K59R-His, GST-HEC1(1–196)K53R/K59R-His, GST-HEC1-CT, or GST-HEC1-CTK527R, respectively, in the presence of Ac-CoA for an in vitro acetylation assay. The acetylation levels were analyzed by Western blot analyses using an anti-acetyllysine antibody. HEC1-CT contains aa 222–642. D, HEC1 was immunoprecipitated from HeLa cell lysate with an anti-HEC1 antibody and then analyzed with anti-acetyllysine antibody and HEC1 antibody. In the first three lanes, cells were synchronized in interphase by thymidine treatment for 17 h. In the other three lanes, cells were treated with thymidine for 17 h and released for 8 h and then synchronized in mitosis by STLC for 4 h. In lanes 2 and 5, cells were treated with NU9056. In lanes 3 and 6, cells were transfected with shTIP60 for 24 h before synchronization. E, HeLa cells were transfected with FLAG-tagged HEC1 or its mutants (K527R, K53R/K527R, K59R/K527R, K53R/K59R, and K53R/K59R/K527R), respectively. Cells were also co-transfected with control or TIP60 shRNA. After 24 h of transfection, anti-FLAG antibody were used to immunoprecipitate FLAG-tagged HEC1 from cell lysate and then analyzed with an anti-acetyllysine antibody and an anti-HEC1 antibody. F, characterization of HEC1 acetylation level during cell cycle. Quantitative analyses of band intensities are shown in Fig. S3E. Data represent mean ± S.E. (error bars) from three independent experiments.
Figure 4.
Figure 4.
HEC1 acetylation promotes robust kinetochore–microtubule attachment. A, real-time analyses of chromosome segregation in the absence of HEC1, TIP60, and acetylation-mimicking mutants of HEC1. HeLa cells were transfected to express mCherry-H2B and GFP-HEC1 (WT and mutants). B, quantitative analyses of time intervals from nuclear envelope breakdown to the beginning of anaphase in HeLa cells. 30 cells were analyzed for each group. Data represent mean ± S.E. (error bars) from three independent experiments. Statistical significance was tested by two-sided t test: *, p < 0.05; ***, p < 0.001; ns, not significant. C, immunofluorescence images of cells treated with siHEC1, NU9056, or exogenously expressing HEC1 mutants with a cold-induced microtubule depolymerization. Scale bar, 10 μm. D, quantification of chromosome alignment phenotypes in C. HeLa cells with mostly aligned chromosomes (purple) exhibited <5 chromosomes off of a well-formed metaphase plate, cells with partially aligned chromosomes (gray) exhibited 5–10 chromosomes off of a metaphase plate, and cells with mostly unaligned chromosomes (black) exhibited either no chromosome alignment or >10 chromosomes off of a metaphase plate. For each condition, at least 90 cells were scored. E, quantification of the immunofluorescence intensity of GFP-HEC1 (WT and mutants), NUF2, and SPC24 staining at kinetochores, normalized to the ACA signal, respectively. Data represent mean ± S.E. (error bars). from at least three independent experiments. Statistical significance was examined by two-sided t test. ns, not significant; ***, p < 0.001. F, HEC1(1–80)-His and HEC1(1–80)K53ac/K59ac-His were precipitated with increasing amounts of taxol-stabilized microtubules. The supernatant (S) and pellet (P) fractions of HEC1(1–80)-His were blotted with the His antibody. G, plot of quantifications of the microtubule co-sedimentation assay with HEC1(1–80)-His and HEC1(1–80)K53ac/K59ac-His. Fractions of MT-associated HEC1(1–80)-His proteins were plotted against MT concentrations. Data were fitted with the full quadratic binding equation in GraphPad Prism. Error bars, S.D. (n = 3 independent experiments).
Figure 5.
Figure 5.
Acetylation of HEC1N80 modulates the interaction of NUF2-HEC1 CH domain and weakens the phosphorylation of HEC1N80. A, surface views of HEC1(80–196) and NUF2(1–169), colored by electrostatic potential. B, GST-NUF2(1–169)-His–bound agarose beads were used as affinity matrices to pull down MBP-HEC1(80–196) in a competitive binding experiment with HEC1(1–80)-His or HEC1(1–80)ac-His in increased doses (0–32 μg). The results were visualized by CBB staining (top). C, quantification of binding intensity between GST-NUF2(1–169) and MBP-HEC1(80–196) in the presence of different concentrations of HEC1(1–80)-His (green curve) or HEC1(1–80)ac-His (red curve) from the experiment shown in B. D, plot of quantifications of the microtubule co-sedimentation assay with WT NDC80Bonsai complex and with the K53R/K59R and K53Q/K59Q NDC80Bonsai mutant in Fig. S5M. Fractions of MT-associated NDC80Bonsai proteins were plotted against MT concentrations. Data were fitted with the full quadratic binding equation in GraphPad Prism. Error bars, S.D. (n = 3 independent experiments). E, to examine the phosphorylation states of GST-HEC1(1–196)-His, GST-HEC1(1–196)K53R/59R-His, and GST- HEC1(1–196)K53Q/K59Q-His, 10% (w/v) SDS-PAGE in the absence (bottom) or presence (top) of the polyacrylamide-bound Mn2+-Phos-tagTM ligand (25 mm) was performed. F, determination of kinetic parameters of HEC1WT, HEC1K53R/K59R, and HEC1K53Q/K59Q. The velocities of the kinase assay toward the 15-mer substrate peptide at varying concentrations were measured by the AmpliteTM universal fluorimetric kinase assay kit. Data from three independent experiments were analyzed in GraphPad Prism and fitted with the Michaelis–Menten equation to extract the kinetic parameters. Bars, means ± S.D. (error bars).
Figure 6.
Figure 6.
Sirt1 binds and deacetylates HEC1. A, 293T cells were transfected to express FLAG-Sirt1, FLAG-Sirt2, FLAG-Sirt3, FLAG-HDAC1, FLAG-HDAC2, or FLAG-HDAC3 proteins, respectively. Clarified cell lysate was prepared 24 h after the transfection, followed by incubation with GST– or GST-HEC1(1–196)–bound agarose beads for 4 h. After extensive washes, the GST– and GST-HEC1(1–196)–bound agarose beads were boiled in 1× SDS-PAGE sample buffer followed by SDS-PAGE analyses stained with CBB staining and probed by anti-FLAG blotting (top). B, diagram of plasmid combinations used to produce WT or recombinant acetylated HEC1 protein (K53ac/K59ac-HEC1(1–196)) in E. coli. C, the recombinant acetylated GST-HEC1K53/59-His protein was incubated with NAD+ (lane 1), FLAG-Sirt1 + NAD+ + Ex527 (lane 2), or FLAG-Sirt1 + NAD+ (lane 3). After incubation at 30 °C for 2 h, the samples were analyzed with an anti-acetyllysine antibody (acK) and HEC1 antibody by Western blot analyses. D, 293T cells were transfected with FLAG-TIP60 (lanes 1–3) or FLAG-Sirt1 (lanes 4–6). In lanes 1 and 4, cells were blocked in interphase. In lanes 2 and 5, cells were blocked in prometaphase with STLC for 16 h. In lanes 3 and 6, cells were blocked in metaphase with MG132. Cell lysate was immunoprecipitated with anti-FLAG antibody, analyzed by SDS-PAGE, and probed by anti-HEC1 and anti-FLAG blotting. E, quantification of HEC1-binding intensity with TIP60 and Sirt1 shown in D. Data represent mean ± S.E. (error bars) from three independent experiments.
Figure 7.
Figure 7.
Mathematical modeling of HEC1 acetylation dynamics and regulation. A, diagram of chemical equilibrium model. B–E, acetylated HEC1 concentration (B and C) and total HEC1–NUF2 complex concentration (D and E) versus Km (TIP60) and Km (Sirt1). In C and E, the statuses in prophase, prometaphase, and metaphase are labeled a, b, and c, respectively. For the sake of simplification, we set [Ntotal] = [Htotal] = 10, [T] = [S], kT = kS, k1/kp1 = 1, k2/kp2 = 4. F, model for TIP60 and Sirt1 in regulating kinetochore–microtubule attachment. The model illustrates a novel cross-talk regulated by TIP60-mediated acetylation at Lys-53 and Lys-59 and Aurora B–governed phosphates at Ser-55 and Ser-62 of HEC1N80.

Similar articles

Cited by

References

    1. McKinley K. L., and Cheeseman I. M. (2016) The molecular basis for centromere identity and function. Nat. Rev. Mol. Cell Biol. 17, 16–29 10.1038/nrm.2015.5 - DOI - PMC - PubMed
    1. Black B. E., Jansen L. E., Foltz D. R., and Cleveland D. W. (2010) Centromere identity, function, and epigenetic propagation across cell divisions. Cold Spring Harb. Symp. Quant. Biol. 75, 403–418 10.1101/sqb.2010.75.038 - DOI - PMC - PubMed
    1. Cleveland D. W., Mao Y., and Sullivan K. F. (2003) Centromeres and kinetochores: from epigenetics to mitotic checkpoint signaling. Cell 112, 407–421 10.1016/S0092-8674(03)00115-6 - DOI - PubMed
    1. McCleland M. L., Kallio M. J., Barrett-Wilt G. A., Kestner C. A., Shabanowitz J., Hunt D. F., Gorbsky G. J., and Stukenberg P. T. (2004) The vertebrate NDC80 complex contains SPC24 and SPC25 homologs, which are required to establish and maintain kinetochore-microtubule attachment. Curr. Biol. 14, 131–137 10.1016/j.cub.2003.12.058 - DOI - PubMed
    1. McCleland M. L., Gardner R. D., Kallio M. J., Daum J. R., Gorbsky G. J., Burke D. J., and Stukenberg P. T. (2003) The highly conserved NDC80 complex is required for kinetochore assembly, chromosome congression, and spindle checkpoint activity. Genes Dev. 17, 101–114 10.1101/gad.1040903 - DOI - PMC - PubMed

Publication types