Review
. 2019 Jan;73(1):3-10.
doi: 10.1136/jech-2017-210371. Epub 2018 Nov 8.

Are inequalities in cancer diagnosis through emergency presentation narrowing, widening or remaining unchanged? Longitudinal analysis of English population-based data 2006-2013

Affiliations
Review

Are inequalities in cancer diagnosis through emergency presentation narrowing, widening or remaining unchanged? Longitudinal analysis of English population-based data 2006-2013

Annie Herbert et al. J Epidemiol Community Health. 2019 Jan.

Abstract

Background: Diagnosis of cancer through emergency presentation is associated with poorer prognosis. While reductions in emergency presentations have been described, whether known sociodemographic inequalities are changing is uncertain.

Methods: We analysed 'Routes to Diagnosis' data on patients aged ≥25 years diagnosed in England during 2006-2013 with any of 33 common or rarer cancers. Using binary logistic regression we determined time-trends in diagnosis through emergency presentation by age, deprivation and cancer site.

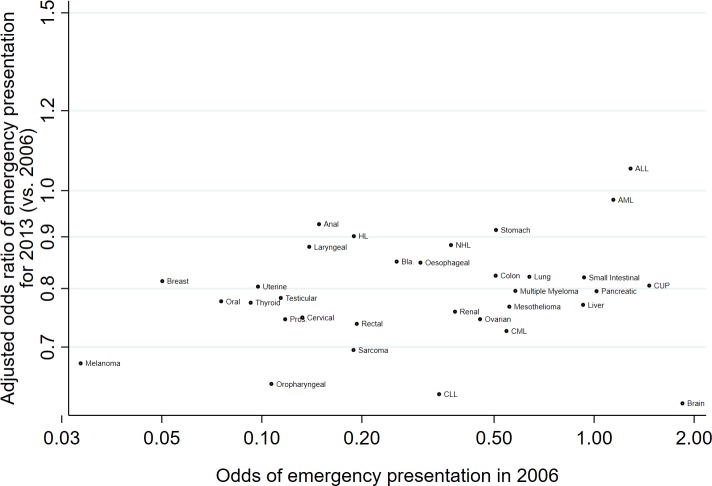
Results: Overall adjusted proportions of emergency presentations decreased during the study period (2006: 23%, 2013: 20%). Substantial baseline (2006) inequalities in emergency presentation risk by age and deprivation remained largely unchanged. There was evidence (p<0.05) of reductions in the risk of emergency presentations for most (28/33) cancer sites, without apparent associations between the size of reduction and baseline risk (p=0.26). If there had been modest reductions in age inequalities (ie, patients in each age group acquiring the same percentage of emergency presentations as the adjacent group with lower risk), in the last study year we could have expected around 11 000 fewer diagnoses through emergency presentation (ie, a nationwide percentage of 16% rather than the observed 20%). For similarly modest reductions in deprivation inequalities, we could have expected around 3000 fewer (ie, 19%).

Conclusion: The proportion of cancer diagnoses through emergency presentation is decreasing but age and deprivation inequalities prevail, indicating untapped opportunities for further improvements by reducing these inequalities. The observed reductions in proportions across nearly all cancer sites are likely to reflect both earlier help-seeking and improvements in diagnostic healthcare pathways, across both easier-to-suspect and harder-to-suspect cancers.

Keywords: ageing; cancer; deprivation; inequalities.


Conflict of interest statement

Competing interests: None declared.

Figures

Figure 1
Figure 1
Time-trends in adjusted proportions of emergency presentations*, by age group and by deprivation group. *Adjusted proportions derived from logistic regression model where outcome is emergency presentation and independent variables are sex, age group, deprivation, cancer site, year and interaction terms for sex*year, age group*year, deprivation group*year and cancer site*year (year entered as a continuous variable both in main and interaction terms). The adjusted proportion in a given year was the predicted proportion of emergency presentations, had the distribution of case-mix variables in that particular year been the same as that observed across all study years (2006–2013). Trends are plotted on the log-proportions scale, to allow for a fair representation of relative changes over time between age and deprivation groups with different baseline frequencies of emergency presentation.
Figure 2
Figure 2
Time-trends in adjusted proportions of emergency presentations*, by cancer (shown for 10 different cancer sites). *Adjusted proportions derived from logistic regression model where outcome is emergency presentation and independent variables are sex, age group, deprivation, cancer site, year and interaction terms for sex*year, age group*year, deprivation group*year and cancer site*year (year entered as a continuous variable both in main and interaction terms). The adjusted proportion in a given year was the predicted proportion of emergency presentations, had the distribution of case-mix variables in that particular year been the same as that observed across all study years (2006–2013). Trends are plotted on the log-proportions scale, to allow a fair representation of relative changes over time between cancer sites with different baseline frequencies of emergency presentation. HL, Hodgkin’s lymphoma.
Figure 3
Figure 3
Cancer-specific adjusted ORs of emergency presentation* for 2013 (vs 2006). *Adjusted ORs derived from logistic regression model where outcome is emergency presentation and independent variables are sex, age group, deprivation, cancer site, year and interaction terms for sex*year, age group*year, deprivation group*year and cancer site*year (year entered as a continuous variable both in main and interaction terms). Therefore, the presented adjusted OR values (2013 vs 2006) relate to the patient group defined by the reference category of each of the other main effect variables, ie, for each cancer site (eg, brain), they relate to patients with that cancer who are male, aged 60–69 years and living in the least deprived areas. ORs are plotted on the log-odds scale, to allow a fair representation of relative differences between ORs. Bars represent 95% CIs. ALL, acute lymphoblastic leukaemia; AML, acute myeloid leukaemia; CLL, chronic lymphocytic leukaemia; CML, chronic myeloid leukaemia; CUP, cancer of unknown primary; HL, Hodgkin’s Lymphoma; NHL, non-Hodgkin lymphoma.
Figure 4
Figure 4
Scatter plot of adjusted ORs of emergency presentation* for 2013 (vs 2006) against odds of emergency presentation in 2006, by cancer site. *Adjusted ORs derived from logistic regression model where outcome is emergency presentation and independent variables are sex, age group, deprivation, cancer site, year and interaction terms for sex*year, age group*year, deprivation group*year and cancer site*year (year entered as a continuous variable both in main and interaction terms). Therefore, the presented adjusted OR values (2013 vs 2006) relate to the patient group defined by the reference category of each of the other main effect variables, ie, for each cancer site (eg, brain), they relate to patients with that cancer who are male, aged 60–69 years and living in the least deprived areas. ORs are plotted on the log-odds scale, to allow a fair representation of relative differences between ORs. ALL, acute  lymphoblastic leukaemia; AML, acute myeloid leukaemia; CLL, chronic lymphocytic leukaemia; CML, chronic myeloid leukaemia; CUP, cancer of unknown primary; HL, Hodgkin’s Lymphoma; NHL, Non-Hodgkin’s Lymphoma; Pros., Prostate.

Similar articles

Cited by

References

    1. Zhou Y, Abel GA, Hamilton W, et al. . Diagnosis of cancer as an emergency: a critical review of current evidence. Nat Rev Clin Oncol 2017;14:45–56. 10.1038/nrclinonc.2016.155 - DOI - PubMed
    1. Elliss-Brookes L, McPhail S, Ives A, et al. . Routes to diagnosis for cancer - determining the patient journey using multiple routine data sets. Br J Cancer 2012;107:1220–6. 10.1038/bjc.2012.408 - DOI - PMC - PubMed
    1. McPhail S, Elliss-Brookes L, Shelton J, et al. . Emergency presentation of cancer and short-term mortality. Br J Cancer 2013;109:2027–34. 10.1038/bjc.2013.569 - DOI - PMC - PubMed
    1. Gunnarsson H, Ekholm A, Olsson LI. Emergency presentation and socioeconomic status in colon cancer. Eur J Surg Oncol 2013;39:831–6. 10.1016/j.ejso.2013.04.004 - DOI - PubMed
    1. Pruitt SL, Davidson NO, Gupta S, et al. . Missed opportunities: racial and neighborhood socioeconomic disparities in emergency colorectal cancer diagnosis and surgery. BMC Cancer 2014;14:927 10.1186/1471-2407-14-927 - DOI - PMC - PubMed

Publication types