. 2018 Nov 8;9(1):4681.
doi: 10.1038/s41467-018-07146-5.

Long term but not short term exposure to obesity related microbiota promotes host insulin resistance

Affiliations

Long term but not short term exposure to obesity related microbiota promotes host insulin resistance

Kevin P Foley et al. Nat Commun. .

Abstract

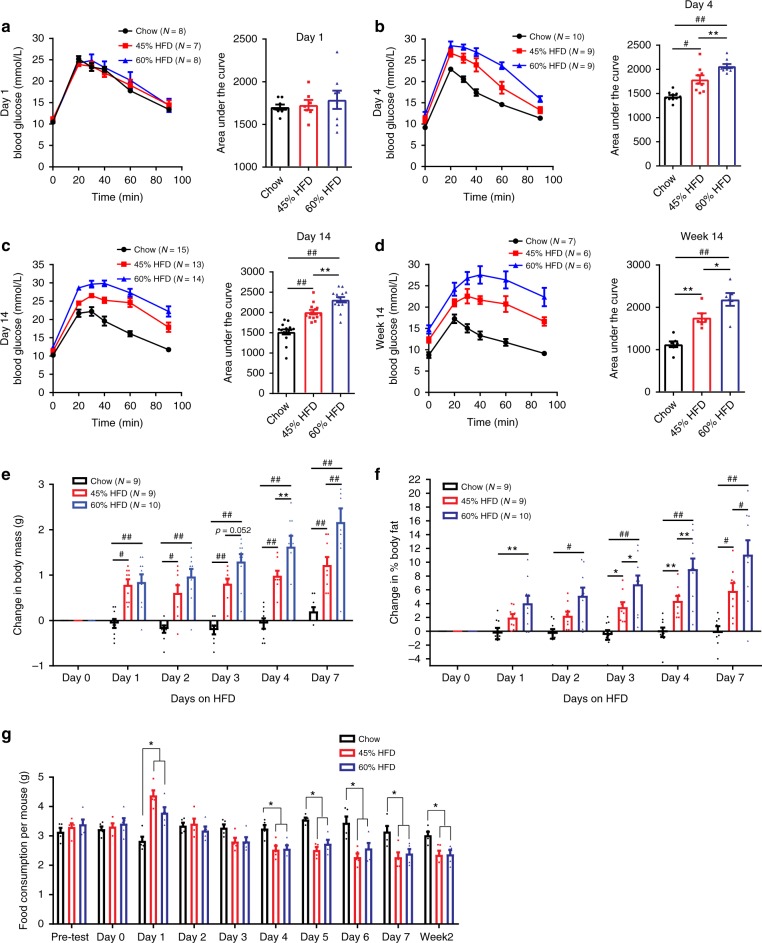
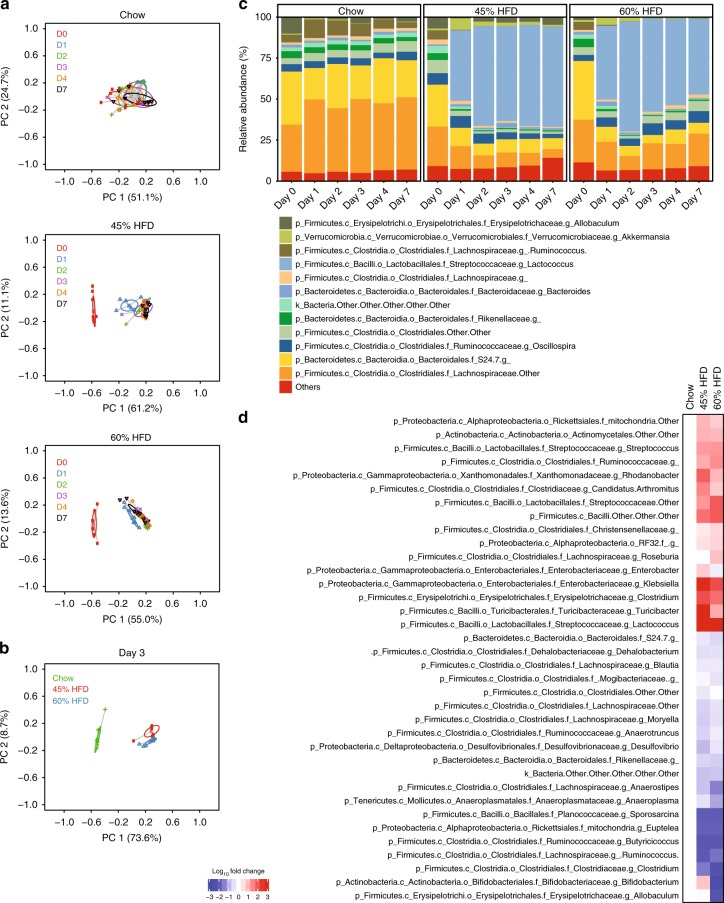
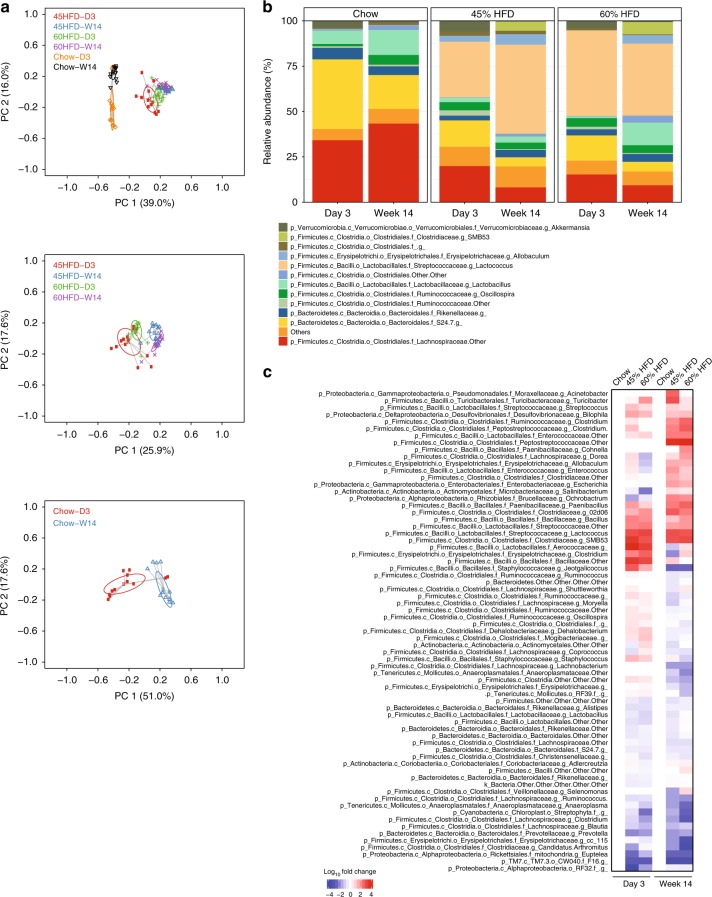
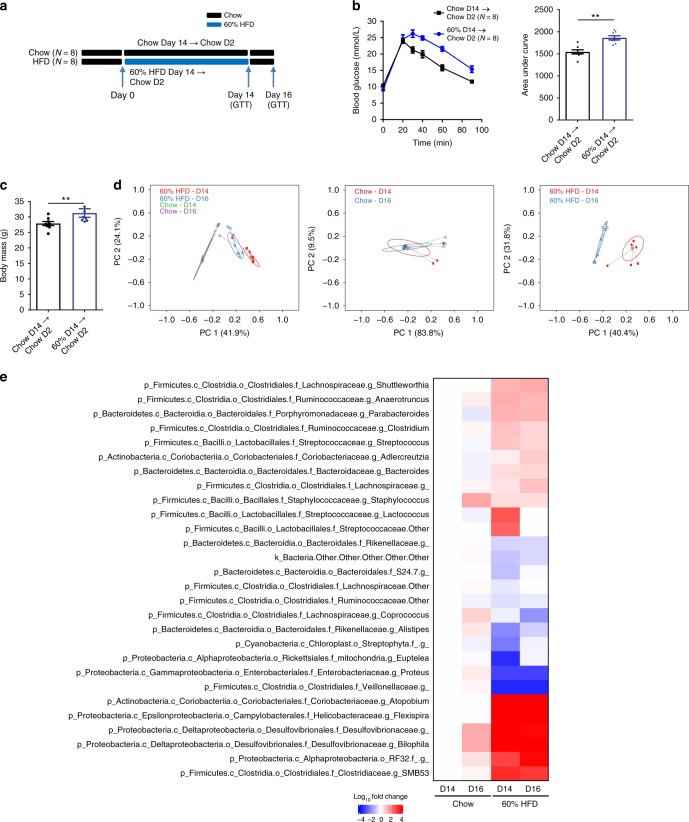
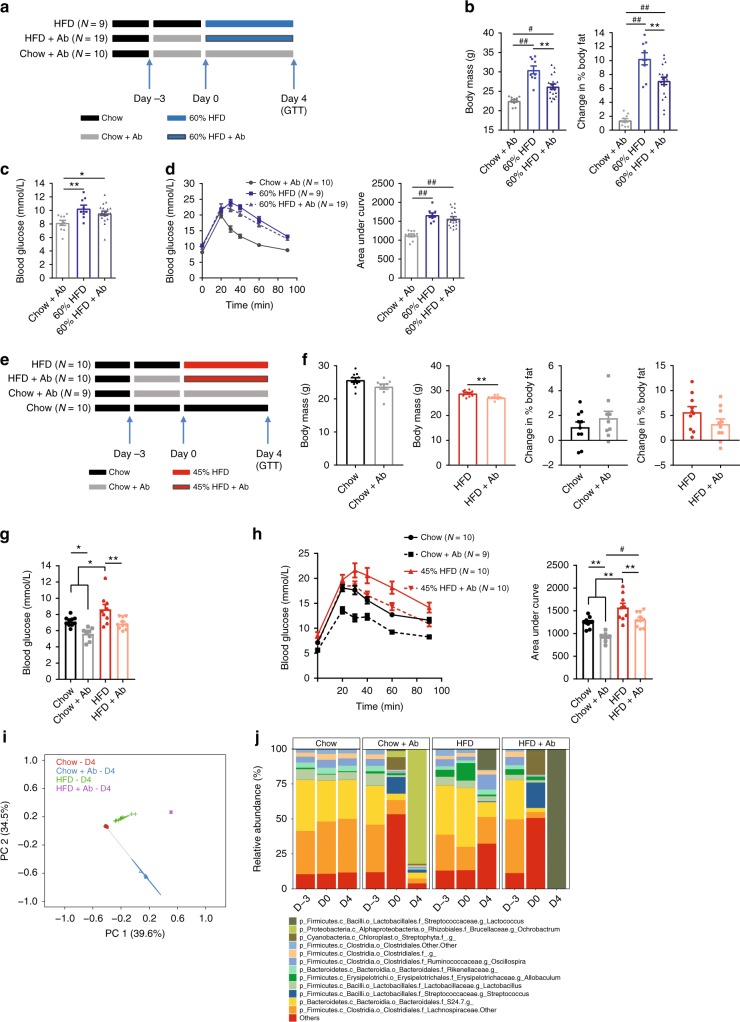
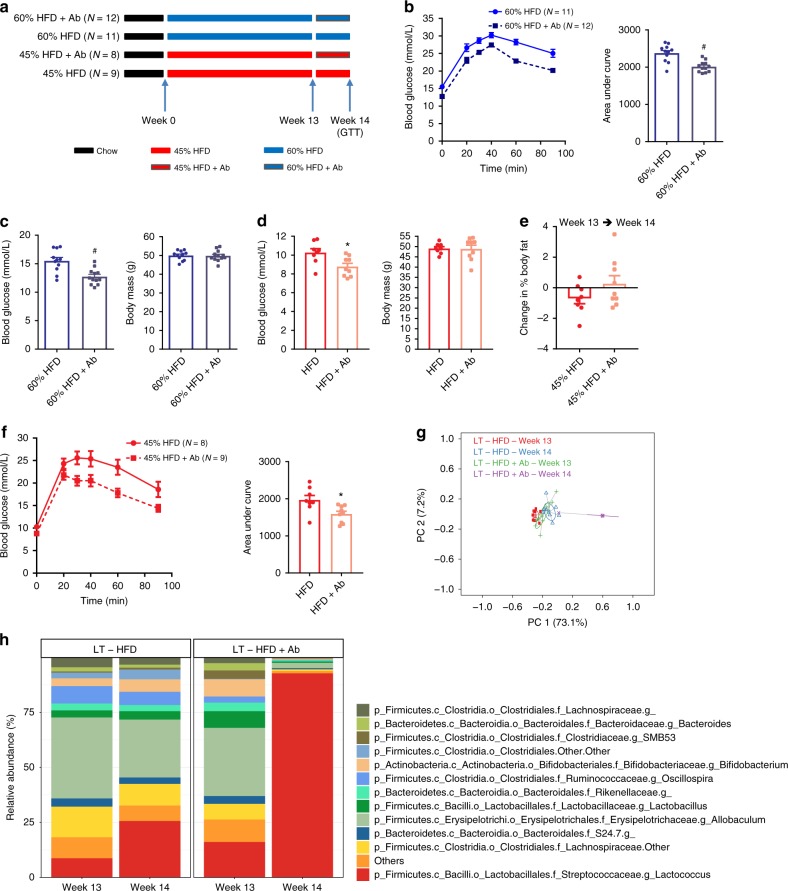
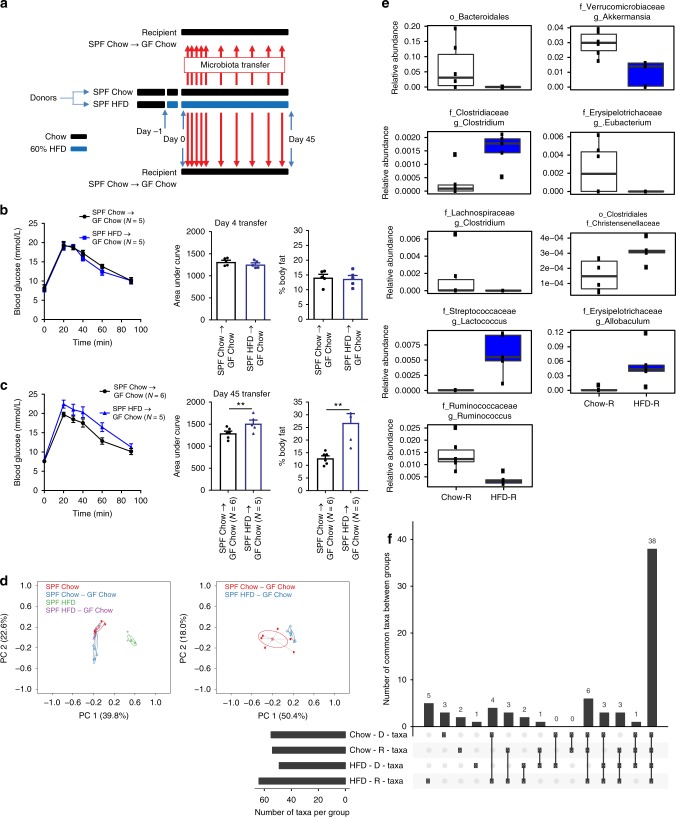
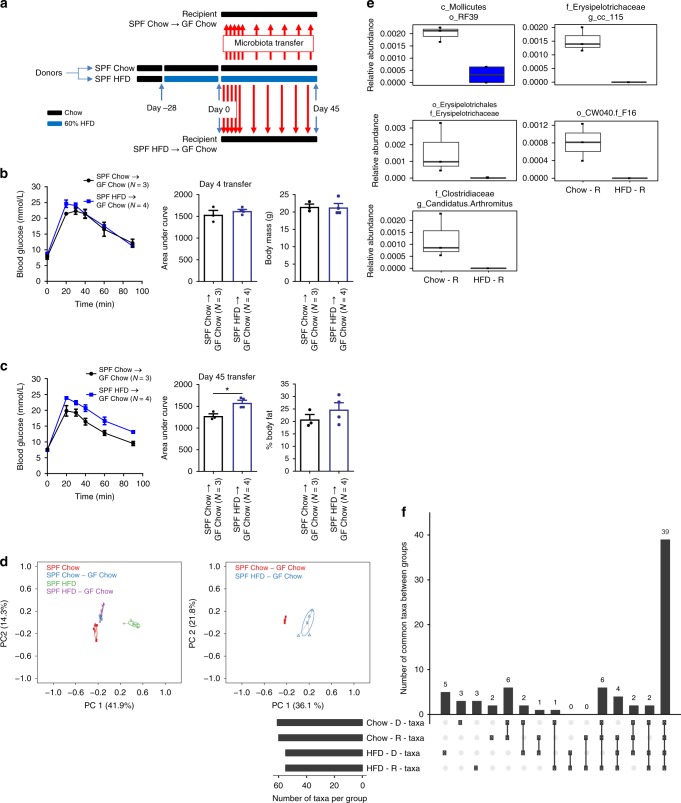
The intestinal microbiota and insulin sensitivity are rapidly altered after ingestion of obesogenic diets. We find that changes in the composition of the fecal microbiota precede changes in glucose tolerance when mice are fed obesogenic, low fiber, high fat diets (HFDs). Antibiotics alter glycemia during the first week of certain HFDs, but antibiotics show a more robust improvement in glycemic control in mice with protracted obesity caused by long-term feeding of multiple HFDs. Microbiota transmissible dysglycemia and glucose intolerance only occur when germ-free mice are exposed to obesity-related microbes for more than 45 days. We find that sufficient host exposure time to microbiota derived from HFD-fed mice allows microbial factors to contribute to insulin resistance, independently from increased adiposity in mice. Our results are consistent with intestinal microbiota contributing to chronic insulin resistance and dysglycemia during prolonged obesity, despite rapid diet-induced changes in the taxonomic composition of the fecal microbiota.


Conflict of interest statement

The authors declare no competing interests.

Figures

Fig. 1
Fig. 1
Four days of an obesogenic diet is sufficient to induce glucose intolerance and increase adiposity in mice. ad Mice were fed a chow, 45% HFD, or 60% HFD for 1 day (a: N = 8, 7, 8), 4 days (b: N = 10, 9, 9), 14 days (c: N = 15, 13, 14), or 14 weeks (d: N = 7, 6, 6) then tested for glucose tolerance with a 2 g per kg (ac) or 0.9 g per kg (d) glucose dose by i.p. injection. Blood glucose measures were taken at indicated time points, which are shown in the glucose tolerance test (GTT) curve and used to calculate the area under the curve (AUC). Statistical significance was measured as p < 0.05 using one-way ANOVA. Post hoc analysis was performed using Tukey’s multiple comparisons test (*p < 0.05; **p < 0.01; #p < 0.001; ##p < .0001). Change in body weight (e) and change in % body fat (f) were calculated as the difference between Day 0 and subsequent days within each animal. Body weight and adiposity (% body fat) were measured in mice fed a chow, 45% HFD, or 60% HFD for 7 days (N = 9, 9, 10). Statistical significance was measured as p < 0.05 using two-way ANOVA with repeated measures (time). Post Hoc analysis was performed using Tukey’s multiple comparisons test (*p < 0.05; **p < 0.01; #p < 0.001; ##p < .0001). g Food consumption (N = 5 cages per group) was measured daily and expressed per mouse. Statistical significance was measured as p < 0.05 using one-way ANOVA for each time point. Post hoc analysis was performed using Tukey’s multiple comparisons test (*p < 0.05). All values are mean ± SEM
Fig. 2
Fig. 2
Obesogenic diet feeding changes the fecal microbiota, which precedes glucose intolerance in mice. Mouse fecal samples were taken over the first 7 days (D0–D7) of feeding obesogenic, low fiber, high fat diets (HFD) and processed for bacterial DNA sequencing (N = 7–8). All mice were on a Chow diet on Day 0 (D0). a PCoA of Bray-Curtis dissimilarity for all samples over the 7 days on Chow diet, 45% HFD, or 60% HFD. b PCoA of Bray-Curtis dissimilarity after 3 days of eating each of the 3 diets. c Stacked bar graph showing the relative abundance of the 12 most abundant bacterial taxa (Genus level) over the first 7 days of eating each of the 3 diets. d Heat map of the 36 microbial taxa that were significantly different 3 days after eating Chow, 45% HFD, and 60% HFD. Non-parametric analysis of variance for each taxon between groups was conducted using the Kruskal–Wallis test. Taxa that passed the significance threshold of p < 0.05 were analyzed using the pairwise Wilcoxon rank sum test. Correction for multiple hypothesis testing (FDR) was calculated using the Benjamini-Hochberg method. Statistical significance was accepted at p < 0.05.  Fold change in relative abundance of the taxa that significantly changed between the groups was expressed relative to Chow and plotted in the heatmap
Fig. 3
Fig. 3
Rapid changes in the composition of the fecal microbiota are maintained during prolonged obesogenic diet feeding. Fecal samples were taken 3 days (D3) and at 14 weeks (W14) after feeding chow or each obesogenic diet and processed for bacterial DNA sequencing (Chow = 12, 45% HFD = 13, 60% HFD = 12 mice). a PCoA of Bray-Curtis dissimilarity between each of the 3 diet groups (Day 3 and Week 14) (top panel), between the two obesogenic diet groups only (Day 3 and Week 14) (middle panel), and between Day 3 and Week 14 of mice that only ate the chow diet (bottom panel). b Stacked bar graph showing the relative abundance of the 12 most abundant bacterial taxa (Genus level) at Day 3 and Week 14 mice fed each diet. c Heat map of the 69 microbial taxa that differed between mice fed Chow, 45% HFD, and 60% HFD on Day 3 or Week 14. The average relative abundances of each taxon detected in mice fed the respective diets for 3 days or 14 weeks were compared between groups. For each time point (Day 3 or Week 14), non-parametric analysis of variance for each taxon between the diet groups was conducted using the Kruskal–Wallis test. Taxa that passed the significance threshold of p < 0.05 were analyzed using the pairwise Wilcoxon rank sum test. Correction for multiple hypothesis testing (FDR) was calculated using the Benjamini-Hochberg method. Statistical significance was accepted at p < 0.05.  Fold change in relative abundance of the taxa that significantly changed between the groups was expressed relative to Chow within each timepoint and plotted in the heatmap
Fig. 4
Fig. 4
Glucose intolerance persists despite rapid changes in fecal microbiota after removing an obesogenic diet for 2 days. Mice were fed chow or 60% HFD (N = 8, 8) for 14 days before HFD was replaced with a chow diet for 2 days (Day 16) (a). b Glucose tolerance test (GTT) curve with area under the curve (AUC) (2 g per kg glucose, i.p.) and c body mass on day 16. Statistical significance was measured as p < 0.05 using Student t-test (*p < 0.05; **p < 0.01; #p < 0.001; ## p < .0001). Values are mean ± SEM. d PCoA of Bray-Curtis dissimilarity for Chow (Day 14), Chow (Day 16), 60% HFD (Day 14), and 2 days HFD removal (60HFD Day 16). PCoA plots for all groups of mice (left panel), mice only fed a chow diet (middle panel), and mice that were fed a 60% HFD with or without replacement of the obesogenic diet with a chow (right panel). e Genus level changes in the microbiota relative to 14 days of chow diet. The average relative abundance of each taxon detected in fecal samples was compared across the different groups of mice. Non-parametric analysis of variance for each taxon between the treatment groups (Chow day 14, Chow Day 16, 60% HFD Day 14, 60% HFD Day 16) was conducted using the Kruskal–Wallis test. Taxa that passed the significance threshold of p < 0.05 were analyzed using the pairwise Wilcoxon rank sum test. Correction for multiple hypothesis testing (FDR) was calculated using the Benjamini-Hochberg method. Statistical significance was accepted at p < 0.05.  Fold change in relative abundance of the taxa that significantly changed within either diet group was expressed relative to Chow Day 14 and plotted in the heatmap
Fig. 5
Fig. 5
Antibiotics can improve glucose tolerance in mice fed chow or certain obesogenic diets for short durations. Mice were treated with or without antibiotics (1 mg/mL ampicillin and 0.5 mg/mL neomycin) in the water for 3 days before being placed on chow, 45% HFD, or 60% HFD with or without antibiotics for an additional 4 days. a Experimental design for testing antibiotics during the obesogenic diet containing 60% fat (Chow + Ab = 10; HFD = 9; HFD + Ab = 19). b Body mass and change in % body fat on Day 4 of HFD feeding with or without antibiotics. c Fasting blood glucose and d Glucose tolerance test (GTT) (2 g per kg glucose i.p.) and area under the curve (AUC) with and without antibiotics. e Experimental design for testing antibiotics during the obesogenic diet containing 45% fat (Chow = 10; Chow + Ab = 9; HFD = 10; HFD + Ab = 10). f Body mass and % change in body fat measures for chow fed and 45% HFD mice on Day 4 of feeding. g Fasting blood glucose and h GTT (2 g per kg glucose i.p.) and AUC with and without antibiotics. i PCoA of Bray-Curtis dissimilarity for all groups on Day 4 of chow diet or 45% HFD, with or without antibiotics. j Stacked bar graph showing the relative abundance of the 12 most abundant bacterial taxa (Genus level) over the entire course of the experiment in chow and 45% HFD-fed mice. Statistical significance was measured as p < 0.05 using Student t-test or one-way ANOVA. Post hoc analysis was performed using Tukey’s multiple comparisons test (*p < 0.05; **p < 0.01; #p < 0.001; ##p < .0001). Values are mean ± SEM
Fig. 6
Fig. 6
Antibiotics consistently improve glucose tolerance in mice fed obesogenic diets for long durations. a After 13 weeks of feeding obesogenic HFD diets, mice were treated with or without antibiotics (1 mg/mL ampicillin and 0.5 mg/mL neomycin) in the drinking water for 1 week (60% HFD = 11; 60% HFD + Ab = 12; 45% HFD = 8; 45% HFD + Ab = 9). b Glucose tolerance test (GTT) (2 g per kg glucose i.p.) and area under the curve (AUC) in mice fed a 60% HFD with and without antibiotics. c, d Fasting blood glucose and body mass in mice fed 60% HFD (c) and 45% HFD (d) with and without antibiotics. e Changes in body fat % in mice fed 45% HFD with and without antibiotics. f GTT (2 g per kg glucose i.p.) and AUC in mice fed a 45% HFD with and without antibiotics. g PCoA of Bray-Curtis dissimilarity for all mice fed a 45% HFD with and without antibiotics. h Stacked bar graph showing the relative abundance of the 12 most abundant bacterial taxa (Genus level) for all mice fed a 45% HFD with and without antibiotics. Statistical significance was measured as p < 0.05 using Student t-test. Post hoc analysis was performed using Tukey’s multiple comparisons test (*p < 0.05; **p < 0.01; #p < 0.001; ##p < .0001). Values are mean ± SEM
Fig. 7
Fig. 7
Gut microbiota from long-term, but not short-term HFD-fed mice causes glucose intolerance in germ-free mice. a Schematic of experimental design. Specific pathogen free (SPF) donor mice were placed on chow or 60% HFD on Day -1. On Day 0, and each subsequent day, feces were transferred from donor mice fed a chow diet or donor mice fed a HFD to recipient mice that were germ-free until colonized for this experiment. Recipient mice were all fed chow diet. After 7 days of daily exposure, feces were then transferred from donor to recipient mouse cages once per week. On Day 4 (b) and Day 45 (c) of microbiota transfer from donor to recipient mice the colonized germ-free, recipient mice were tested for glucose tolerance (N = 5, 5), where glucose tolerance test (GTT), area under the curve (AUC), and % body fat are shown. Statistical significance was measured with a Student t-test (**p < 0.01). Values are mean ± SEM. d PCoA of Bray-Curtis dissimilarity for all groups (left panel) and germ-free recipient groups only (right panel). e Boxplots showing the relative abundances of taxa that were significantly different between recipient mice that were exposed to feces from chow-fed or 60% HFD-fed donor mice. The Wilcoxon rank sum test was used to compare the two groups and calculate the significance (p < 0.05). Boxplots show median ± first and third quartiles. f Upset plot comparing taxa present in each group, where the y-axis shows the number of taxa common between the groups identified along the x-axis. Bar graph beside the x-axis shows the total number of taxa detected in each group
Fig. 8
Fig. 8
Long-term, but not short exposure to HFD-induced dysbiosis is sufficient for transmissible glucose intolerance, independent of changes in adiposity. a Schematic of experimental design. Specific pathogen free (SPF) donor mice were placed on chow or 60% HFD on Day -28. On Day 0, and each subsequent day, feces were transferred from donor mice fed chow diet or donor mice fed a HFD to recipient mice that were germ-free until colonized for this experiment. After 7 days of daily exposure, feces were then transferred from donor to recipient mouse cages once per week. On Day 4 (b) and Day 45 (c) of microbiota transfer colonized germ-free, recipient mice were tested for glucose tolerance (N = 3, 4), where glucose tolerance test (GTT), area under the curve (AUC), and % body fat are shown. Statistical significance was measured with a Student t-test (**p < 0.01). Values are mean ± SEM. d PCoA of Bray-Curtis dissimilarity for all groups (left panel) and germ-free recipient groups only (right panel). e Boxplots showing taxa that were significantly different between recipient mice that were exposed to feces from chow-fed or 60% HFD-fed donor mice. The Wilcoxon rank sum test (p < 0.05) was used to compare the two groups and calculate the significance (p < 0.05). Boxplots show median ± first and third quartiles. f Upset plot comparing taxa present in each group, where the y-axis shows the number of taxa common between the groups identified along the x-axis. Bar graph beside x-axis shows the total number of taxa detected in each group

References

    1. Nathan DM, et al. Impaired fasting glucose and impaired glucose tolerance: implications for care. Diabetes Care. 2007;30:753–759. doi: 10.2337/dc07-9920. - DOI - PubMed
    1. Schellenberg ES, Dryden DM, Vandermeer B, Ha C, Korownyk C. Lifestyle interventions for patients with and at risk for type 2 diabetes: a systematic review and meta-analysis. Ann. Intern. Med. 2013;159:543–551. doi: 10.7326/0003-4819-159-8-201310150-00007. - DOI - PubMed
    1. Zeevi D, et al. Personalized nutrition by prediction of glycemic responses. Cell. 2015;163:1079–1094. doi: 10.1016/j.cell.2015.11.001. - DOI - PubMed
    1. Ley RE, et al. Obesity alters gut microbial ecology. Proc. Natl Acad. Sci. USA. 2005;102:11070–11075. doi: 10.1073/pnas.0504978102. - DOI - PMC - PubMed
    1. Qin J, et al. A metagenome-wide association study of gut microbiota in type 2 diabetes. Nature. 2012;490:55–60. doi: 10.1038/nature11450. - DOI - PubMed

Publication types

Substances