. 2018 Nov 8;9(1):4692.
doi: 10.1038/s41467-018-06654-8.

TGF-β-associated extracellular matrix genes link cancer-associated fibroblasts to immune evasion and immunotherapy failure

Affiliations

TGF-β-associated extracellular matrix genes link cancer-associated fibroblasts to immune evasion and immunotherapy failure

Ankur Chakravarthy et al. Nat Commun. .

Abstract

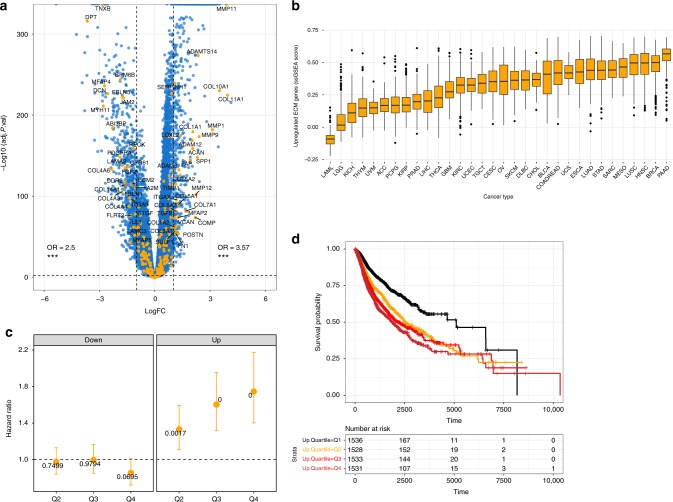
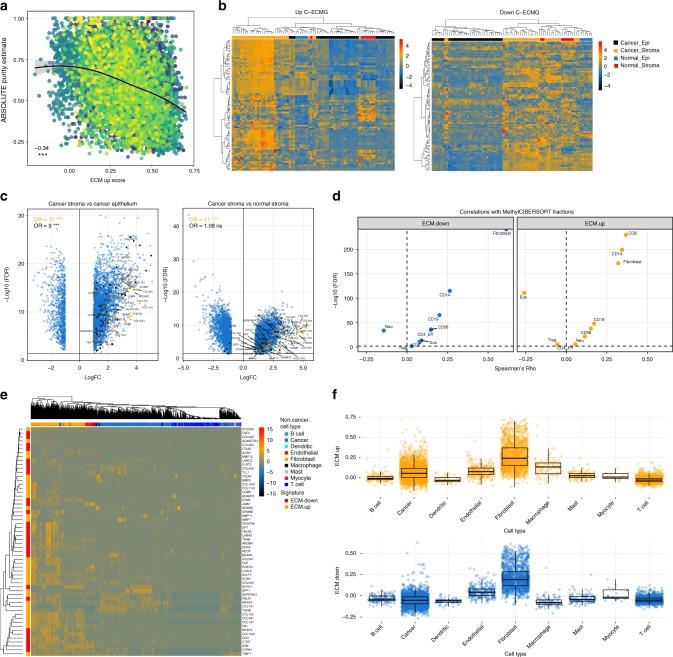
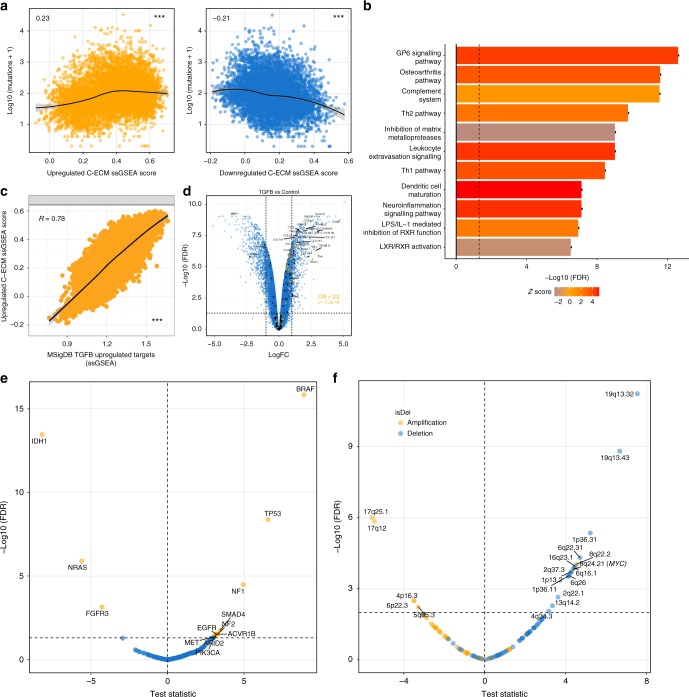
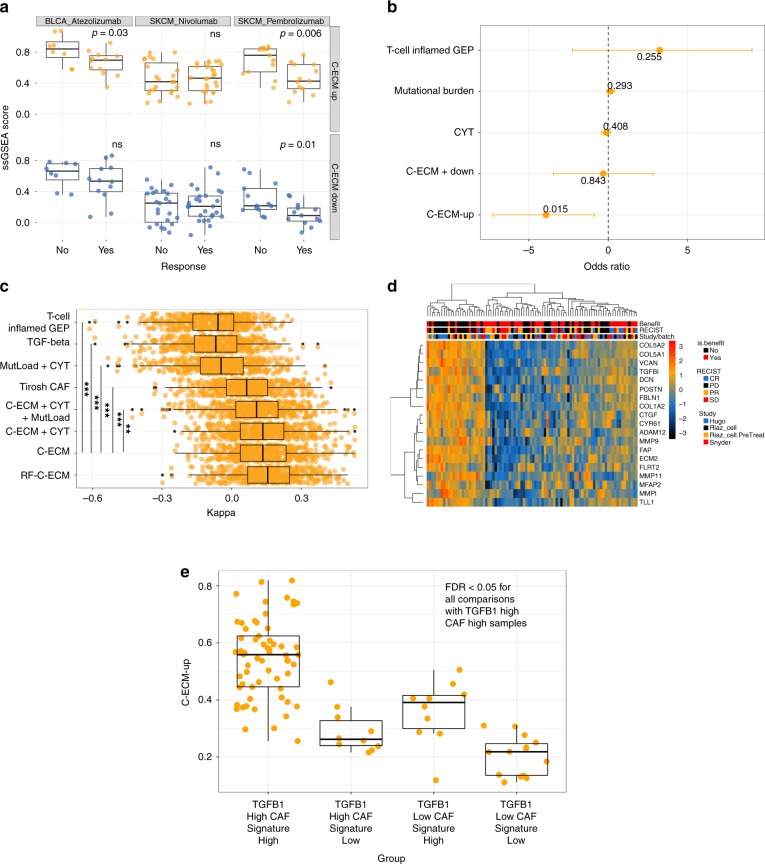
The extracellular matrix (ECM) is a key determinant of cancer progression and prognosis. Here we report findings from one of the largest pan-cancer analyses of ECM gene dysregulation in cancer. We define a distinct set of ECM genes upregulated in cancer (C-ECM) and linked to worse prognosis. We found that the C-ECM transcriptional programme dysregulation is correlated with the activation of TGF-β signalling in cancer-associated fibroblasts and is linked to immunosuppression in otherwise immunologically active tumours. Cancers that activate this programme carry distinct genomic profiles, such as BRAF, SMAD4 and TP53 mutations and MYC amplification. Finally, we show that this signature is a predictor of the failure of PD-1 blockade and outperforms previously-proposed biomarkers. Thus, our findings identify a distinct transcriptional pattern of ECM genes in operation across cancers that may be potentially targeted, pending preclinical validation, using TGF-β blockade to enhance responses to immune-checkpoint blockade.


Conflict of interest statement

The authors declare no competing interests.

Figures

Fig. 1
Fig. 1
ECM genes are significantly associated with tumorigenesis and prognosis. a Volcano plot showing fold changes for genes differentially expressed between cancer and normal samples. ECM genes are enriched in upregulated and downregulated genes. b Boxplots of C-ECM-up enrichment scores show variation across tumour types (n = 9716, see S1F for C-ECM-down genes). c Plot of Cox model coefficients by quartile for C-ECM-up and -down scores pan-cancer, error bars indicate 95% confidence intervals (n = 6128). d Unadjusted Kaplan–Meier curves showing survival by C-ECM-up-quartile., asterisks indicate statistical significance. ***p < 0.001. On the volcano plot, y axis = −log10 fold change, x axis = test statistic/fold change/Spearman’s Rho. On volcano plots, all enrichment statistics are from Fisher’s Exact Tests
Fig. 2
Fig. 2
C-ECM transcription is associated with stroma, especially CAFs. a ABSOLUTE purity estimates are inversely correlated with C-ECM-up score, suggesting stromal origin; colours represent cancer types, number shows Spearman’s Rho (n = 8128). b Heatmaps of C-ECM-up and -down signatures projected onto microdissected epithelium and stroma from ovarian cancers. Rows show expression z-scores, samples are in columns. Annotation bars indicate tissue type. c Volcano plots show C-ECM genes (upregulated in orange, downregulated in black) differentially expressed between cancer stroma and epithelium and between cancer and normal stroma. d Volcano plots showing Spearman’s correlations between MethylCIBERSORT cell-type fractions and C-ECM scores. e Heatmap of C-ECM genes in single-cell HNSCC RNA-seq data (n = 5902). f CAFs show the highest expression of C-ECM genes relative to other cell types in single-cell HNSCC data. Numbers on scatterplots indicate Spearman’s Rho, asterisks indicate statistical significance. ***p < 0.001. On all volcano plots, y axis = −log10 fold change, x axis = test statistic/fold change/Spearman’s Rho. On volcano plots, all enrichment statistics are from Fisher’s Exact Tests
Fig. 3
Fig. 3
E-ECM scores are associated with immunologically hot tumours and TGF-β. a C-ECM-up and down scores are significantly associated with mutational burden across cancer types but in opposite directions. b Canonical pathway analysis shows activation of inflammatory/adaptive-immune pathways. c Correlation between C-ECM-up scores and enrichment for an aggregated list of upregulated non-C-ECM TGF-beta target genes across tissues and species from MSigDB. d Volcano plot showing enrichment for C-ECM genes in TGF-β-induced transcriptional changes in immortalised normal fibroblasts. Linear model t-statistics for candidate e mutational and f copy-number alterations associated with ECM-up ssGSEA scores, adjusted for tumour type, on volcano plots. Numbers on scatterplots indicate Spearman’s Rho, asterisks indicate statistical significance. ***p < 0.001. On all volcano plots, y axis = −log10 fold change, x axis = test statistic/fold change/Spearman’s Rho. On volcano plots, all enrichment statistics are from Fisher’s Exact Tests
Fig. 4
Fig. 4
C-ECM scores predict failure of PD-1 blockade. a Boxplots showing distributions of C-ECM ssGSEA scores across multiple data sets of pretreatment biopsies from patients treated with PD-1 blockade. Non-responders = progressive disease (PD). p Values are from Wilcoxon’s Rank Sum Test. b Coefficients from pooled logistic regression analysis evaluating various predictors on PD-1-blockade response, error bars indicate 95% confidence intervals. c Boxplots of Cohen’s Kappa from 0.632 bootstrapping (500 resamples), showing that ECM-based models outperform other candidate biomarkers. Asterisks show q-values. d Heatmap showing C-ECM genes differentially expressed between ICB responders and nonresponders after controlling for study-specific variation. Rows show z-scores of expression (log2 CPM) and columns show samples; annotation ribbons display clinical information. e Boxplot showing C-ECM-up score distributions based on discretised categories of TGFB1 expression and the Tirosh CAF signature. All comparisons with the TGFB1 high, CAF high group were significant at FDR < 0.05 (Wilcoxon’s Rank Sum Test)

References

    1. Hanahan D, Weinberg RA. Hallmarks of cancer: the next generation. Cell. 2011;144:646–674. doi: 10.1016/j.cell.2011.02.013. - DOI - PubMed
    1. Pickup MW, Mouw JK, Weaver VM. The extracellular matrix modulates the hallmarks of cancer. EMBO Rep. 2014;15:1243–1253. doi: 10.15252/embr.201439246. - DOI - PMC - PubMed
    1. Shintani Y, et al. IL-6 secreted from cancer-associated fibroblasts mediates chemoresistance in NSCLC by increasing epithelial-mesenchymal transition signaling. J. Thorac. Oncol. 2016;11:1482–1492. doi: 10.1016/j.jtho.2016.05.025. - DOI - PubMed
    1. Richards KE, et al. Cancer-associated fibroblast exosomes regulate survival and proliferation of pancreatic cancer cells. Oncogene. 2017;36:1770–1778. doi: 10.1038/onc.2016.353. - DOI - PMC - PubMed
    1. Moffitt Richard A, Marayati Raoud, Flate Elizabeth L, Volmar Keith E, Loeza S Gabriela Herrera, Hoadley Katherine A, Rashid Naim U, Williams Lindsay A, Eaton Samuel C, Chung Alexander H, Smyla Jadwiga K, Anderson Judy M, Kim Hong Jin, Bentrem David J, Talamonti Mark S, Iacobuzio-Donahue Christine A, Hollingsworth Michael A, Yeh Jen Jen. Virtual microdissection identifies distinct tumor- and stroma-specific subtypes of pancreatic ductal adenocarcinoma. Nature Genetics. 2015;47(10):1168–1178. doi: 10.1038/ng.3398. - DOI - PMC - PubMed

Publication types

MeSH terms

Substances