Review
. 2019 Jan;18(1):59-82.
doi: 10.1038/nrd.2018.180. Epub 2018 Nov 9.

GPCR drug discovery: integrating solution NMR data with crystal and cryo-EM structures

Affiliations
Review

GPCR drug discovery: integrating solution NMR data with crystal and cryo-EM structures

Ichio Shimada et al. Nat Rev Drug Discov. 2019 Jan.

Abstract

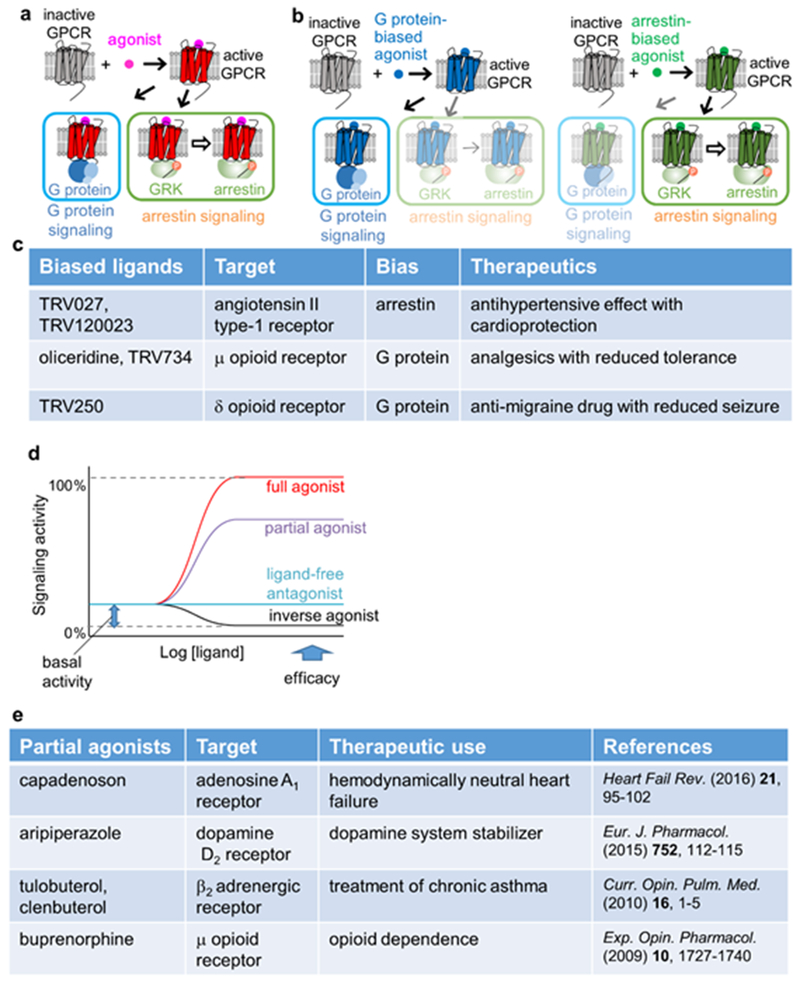
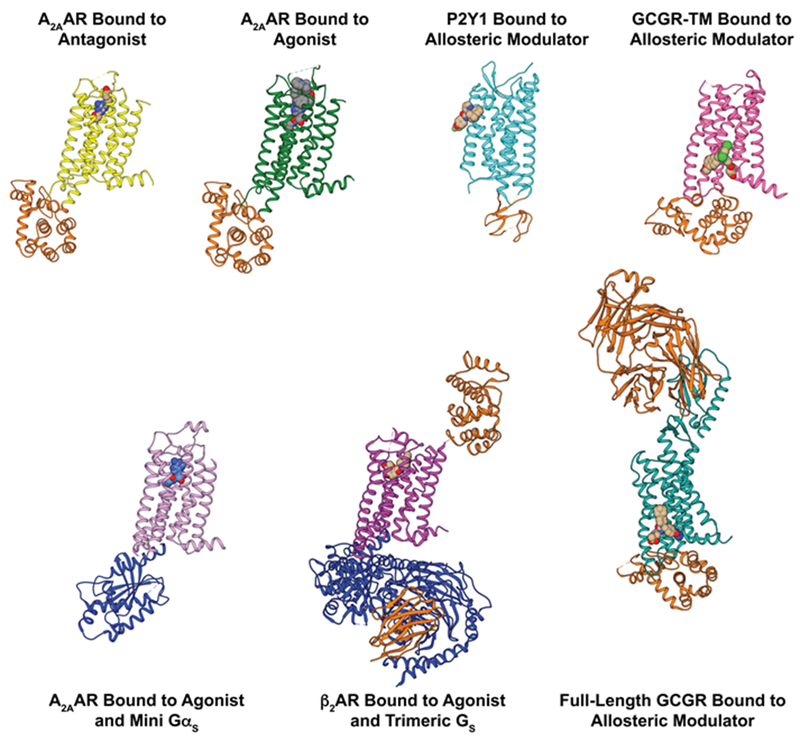
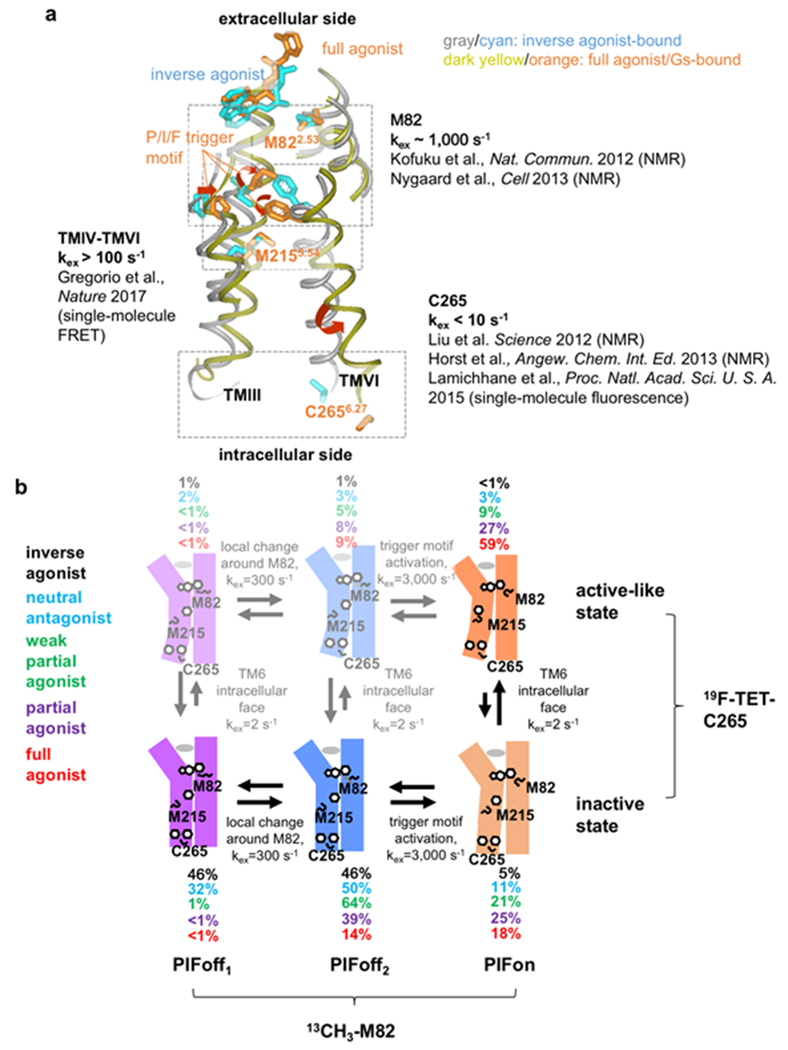
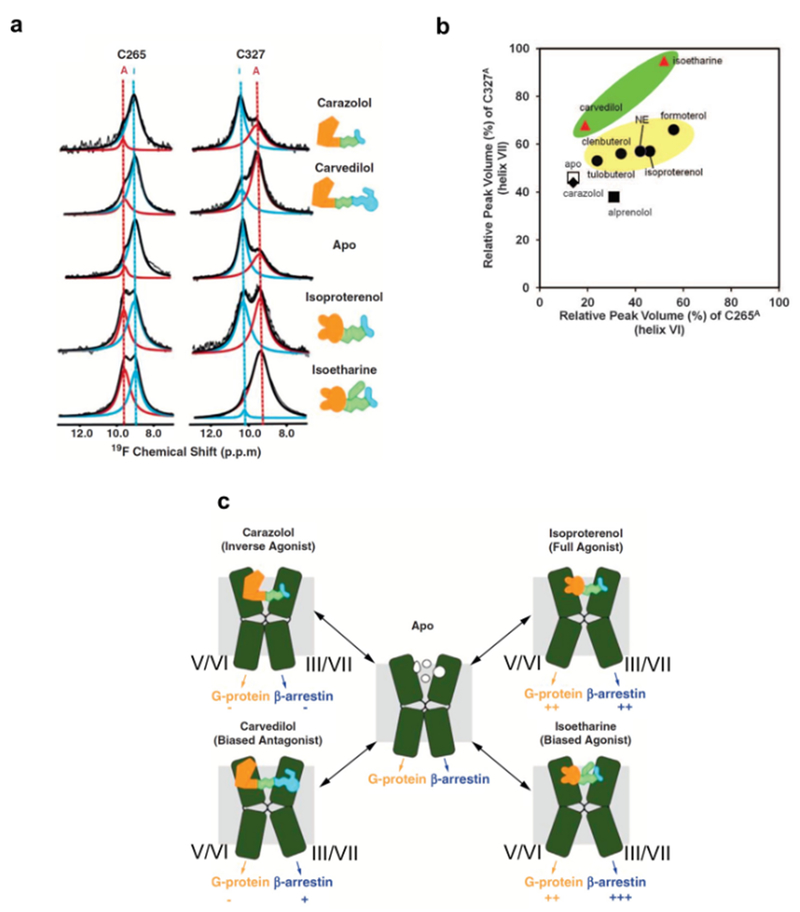
The 826 G protein-coupled receptors (GPCRs) in the human proteome regulate key physiological processes and thus have long been attractive drug targets. With the crystal structures of more than 50 different human GPCRs determined over the past decade, an initial platform for structure-based rational design has been established for drugs that target GPCRs, which is currently being augmented with cryo-electron microscopy (cryo-EM) structures of higher-order GPCR complexes. Nuclear magnetic resonance (NMR) spectroscopy in solution is one of the key approaches for expanding this platform with dynamic features, which can be accessed at physiological temperature and with minimal modification of the wild-type GPCR covalent structures. Here, we review strategies for the use of advanced biochemistry and NMR techniques with GPCRs, survey projects in which crystal or cryo-EM structures have been complemented with NMR investigations and discuss the impact of this integrative approach on GPCR biology and drug discovery.


Figures

Figure 1 |
Figure 1 |. Therapeutic use, efficacy, and biased signaling of GPCR ligands.
a | Schematic diagram of GPCR signaling. Activated GPCRs induce signal transduction through independent signaling pathways, either via G proteins or via G protein-coupled receptor kinases (GRKs) and arrestins. b | Schematic diagram of biased signaling. A G protein-biased ligand and an arrestin-biased ligand elicit signaling via the G protein pathway and the arrestin pathway, respectively. c | Examples of clinically effective biased ligands of GPCRs. d | Plots of signaling activity versus ligand concentration, representing different common GPCR efficacies. e | Examples of clinically effective partial agonists of GPCRs.
Figure 2 |
Figure 2 |. Selected crystallography data on GPCR structural architectures and intermolecular interactions.
Side views are shown of crystal structures of GPCRs in binary complexes with orthosteric ligands or allosteric modulators, and in tertiary complexes with intracellular partner proteins and orthosteric ligands or allosteric modulators. Fusion proteins, nanobodies, and antibodies used to facilitate crystallization of the GPCR complexes are shown in orange, and intracellular partner proteins are shown in blue. Different colors are used for different functional states of GPCRs: A2AAR in complex with the antagonist ZM241385 (yellow; PDB 3EML) and the agonist UK432097 (green; PDB 3QAK), P2Y1 receptor bound to the allosteric modulator BPTU (cyan; PDB 4XNV), the transmembrane domain (TM) of GCGR in complex with the allosteric modulator MK-0893 (fuchsia; PDB 5EE7), A2AAR in a tertiary complex with the agonist NECA and a mini Gs protein (salmon; PDB 5G53), β2AR in a tertiary complex with an agonist and a heterotrimeric G protein (purple; PDB 3SN6), and full-length GCGR in complex with the allosteric modulator NNC0640 (marine; PDB 5XEZ).
Figure 3 |
Figure 3 |. Conformational plasticity of β2AR.
a | Exchange rates between simultaneously populated locally different conformations observed with NMR and fluorescence probes introduced in different locations of β2AR. Shown are the crystal structures of β2AR complexes with the inverse agonist carazolol (PDB: 2RH1), and with the full agonist BI-167107 and a G-protein (PDB: 3SN6), overlaid for best fit of TMII; the drawing represents a side view with the extracellular surface at the top. TMII, TMIII, TMV and TMVI are shown as grey or dark-yellow Cα traces, and the sidechains of M82., I121., P211., M215., C265. and F282., and the bound ligands are depicted by cyan or orange sticks, as detailed in the figure. The antagonist and full agonist complexes differ by a rearrangement of the TM helices and the P/I/F activation motif of P211., I121. and F282.. The rearrangement at the P/I/F motif induces conformational changes near the cytoplasmic region that is involved in G protein binding. The environments around M82., M215., and C265. have been shown to be sensitive to the above-described conformational changes upon activation. b | Schematic model of plasticity in β2AR, which rationalizes the wide range of different exchange rates in (a). Vertical arrows indicate the equilibria between ‘inactive’ and ‘active-like’ conformations at the cytoplasmic surface, as observed with NMR probes at C265. Horizontal arrows correspond to equilibria in the local region around M82 (PIFoff1↔PIFoff2) and in the P/I/F motif (PIFoff2↔PIFon), as observed with probes at M82 (the states PIFoff1, PIFoff2 and PIFon correspond to M82D, M82U and M82A in a previous report). Black, cyan, green, purple and red numbers are the populations of the different states, as observed experimentally for β2AR bound to an inverse agonist, an antagonist, a weak partial agonist, a partial agonist, and a full agonist, respectively. The states with populations below 10% are listed in faint colors.
Figure 4 |
Figure 4 |. NMR-observable conformational equilibria related to biased signaling of β2AR.
a | 19F-NMR signals of CF3 probes attached to C265 and C327 in the apo-form and in four drug complexes of β2AR. The experimental spectra (thin black line showing noise) have been deconvoluted into signals of an active-like state (red, A) and an inactive state (blue, I) of β2AR. The thick black line represents the sum of the signals I and A. b | Plot of the relative peak volumes for an active-like state of β2AR observed at C265 (C265A) versus the relative peak volumes for an active-like state at C327 (C327A). The relative peak volumes are the ratios of the volume of peak A and the sum of the volumes of peaks A and I. The data for the complexes with the agonists tulobuterol, clenbuterol, norepinephrine (NE), isoproterenol, and formoterol are shown as black circles highlighted by a yellow background. The data with the biased ligands carvedilol and isoetharine are shown as red triangles highlighted by a green background. The data with the neutral antagonist alprenolol, the inverse agonist carazolol, and the apo state are shown as a black square, a black diamond, and an open square, respectively. c | Signaling intensities through two β2AR pathways suggested by the 19F-NMR experiments. TMVI and TMVII of β2AR are shown as green kinked cylinders. The structures of the four bound ligands are schematically drawn (yellow, green, and cyan) and their functionalities are indicated. The arrows at the lower end of the cylinders indicate the signaling to the downstream effectors, with plus and minus signs indicating the signaling levels relative to the basal state.
Figure 5 |
Figure 5 |. Effects on local conformational equilibria of β-adrenergic receptors from different experimental set-ups.
a | Schematic side view representations of β2AR-T4L visualizing the effects of T4L-fusion into ICL3 on local conformational equilibria related to the G-protein and arrestin signaling pathways, as observed with 19F-NMR probes at positions 265 and 327123 (see also Fig. 4). The transmembrane helices TMI to TMV are shaded in gray. TMVII, which is in equilibrium between two conformational states manifested by different NMR chemical shifts of a 19F probe attached to C327, is represented as dashed cyan rectangles. TMVI, which is blocked in an active-like state by the T4L fusion, is represented by solid blue rectangles. The T4L fusion protein is depicted as a small red oval, the direction of its impact on local conformational equilibria is indicated by red arrows, and increased intensity of its impact is indicated by increased density of the red shading. The positions of the 19F-NMR labels are shown by yellow spheres, where the active-like state is further identified by a black circle. The orthosteric ligand binding cavity is indicated by shading. The left panel represents the ligand-binding cavity in the complex with the small ligand norepinephrine (small green rectangle; in the apo-form the cavity does not contain a ligand); the red arrows indicate that a long-range effect from T4L via the orthosteric ligand binding cavity causes a shift in the conformational equilibrium at the intracellular tip of TMVII. The right panel shows the orthosteric binding site containing one of the listed larger ligands (green rectangle); the long-range effect from T4L to TMVII is suppressed by the presence of these ligands, which carry a hydrophobic substituent at the ethanolamine end. b | [15N,1H]-TROSY correlation NMR spectra of thermostabilized turkey β1AR (TS-β1AR) containing selective 15N-labeling of its 28 valines in antagonist-bound and agonist-bound states. Resonances are marked with assignment information (black, firm; cyan, tentative). The ligand chemical structures are shown as inserts. c | Differences between corresponding exchange rates and populations of conformational substates in β2AR in nanodiscs and in DDM micelles. The upper and lower panels visualize conformational equilibria of the β2AR complex with the weak partial agonist tulobuterol in nanodiscs and in DDM micelles, respectively. Approximate relative populations of the three states are indicated below the drawings. d | Correlation between the simulated cAMP response based on the PIFon populations observed in the M82 NMR signal and the experimental maximal cAMP responses. Plots of the relative amounts, in percent, of cAMP formed upon activation of CHO-K1 cells by the partial agonists tulobuterol and clenbuterol, which were previously identified as such by cAMP accumulation assays, versus the relative concentration of cAMP in activated cells calculated from the measured populations of PIFon. Both values were normalized to those in the fully active states, and thus are expected to be close to each other whenever the PIFon populations determined by NMR were similar to those in vivo. Circles and triangles represent the cAMP responses based on the PIFon populations of β2AR in DDM micelles and in nanodiscs, respectively. The dotted line represents the hypothetical situation where the simulated cAMP response would be equal to the experimental maximal cAMP response. The error bars along the horizontal axis represent the cAMP concentrations calculated based on the lowest and highest PIFon populations estimated from the M82 NMR signals.
Figure 6 |
Figure 6 |. NMR-observable conformational equilibria related to biased signaling of MOR.
a | Correlation between the normalized chemical shifts of the M245 NMR signals and the value of the bias factor, which is the ratio of the β-arrestin signaling efficacy to the G protein signaling efficacy. b | Mechanisms leading to functional selectivity of MOR for different ligands. In the balanced full agonist state with DAMGO bound, MOR primarily adopts the active conformation (red), in which the intracellular surface is characterized by multiple substates, with exchange rates larger than 100 s−1. In the G protein-biased partial agonist TRV130-bound state, MOR exists in an equilibrium between the inactive (grey) and active conformations, with exchange rates smaller than 200 s−1, and the equilibrium within the active substates is shifted toward the conformation preferred for G protein activation. In the DAMGO-bound state of the MOR N1523.35A mutant, where MOR adopts only the active conformation, the equilibrium among the active substates is shifted toward the conformation preferred for arrestin activation.
Figure 7.
Figure 7.. NMR affords a global view of A2AAR response to variable drug efficacy and inactivation of an allosteric center.
a | [15N,1H]-TROSY NMR correlation spectrum of [u-15N, ~70% 2H]-A2AAR in complex with the antagonist ZM241385. Assigned backbone 15N–1H glycine and indole 15N–1H tryptophan signals are annotated. b | Locations of assigned glycine (orange) and tryptophan (blue) signals in the crystal structure of A2AAR in complex with the antagonist ZM241385 (PDB 6AQF). ZM241385 is shown in green. D522., a critical residue in the allosteric center, is shown in red. Helices are labeled with Roman numerals. The position of G218 is indicated by a dotted circle, as it was replaced with a fusion protein to facilitate crystallization. c | The indole 15N–1H signal of W246., the so-called “toggle switch” tryptophan,, is highly responsive to variable drug efficacy, as observed by comparing NMR spectra for A2AAR in complex with the antagonist ZM241385 (blue) and agonist NECA (red). d | The response of the W246. indole 15N–1H signal to variable drug efficacy can be rationalized by reorientation of the nearby F242. in the P/I/F activation motif, which is highly conserved among Class A GPCRs. e | Schematic side views of A2AAR (left) and A2AAR[D52N] (right). Each transmembrane helix is represented by two adjoining rectangles. The three helices carrying NMR reporter groups near the intracellular surface are shaded, and the residues with assigned NMR lines are indicated by yellow spheres, where black framed spheres indicate that a single NMR line was observed, and unframed spheres correspond to multiple-component signals. The helices drawn with broken lines indicate local polymorphisms seen in the NMR spectra of the residues with unframed yellow spheres. The broken horizontal lines indicate the extracellular and intracellular membrane surfaces. The black arrow indicates the signaling pathway from the orthosteric drug binding site to the intra- cellular surface. In A2AAR, signaling has been correlated with local polymorphisms at the intracellular tips of the helices I and VI. In A2AAR[D52N], signaling to the intracellular surface is quenched. The broken arrow indicates loss of signaling to the G protein, which correlates with the abolishment of the dynamic polymorphisms at the intracellular surface.
Figure 8. |
Figure 8. |. NMR methods for studies of GPCR–ligand interactions.
a | Target-immobilized NMR screening (TINS). Resonance broadening of ligands upon binding to proteins immobilized on Sepharose resin is observed. The bound ligand can be identified by the broadening of its ligand signals. b | Saturation transfer difference (STD) NMR. The protein–ligand complex is irradiated at a frequency corresponding to hydrogen atoms of the protein, so that saturation can be transferred from the protein to the ligand. If the complex has sufficiently large ligand exchange rates, then this saturation is transferred to the bulk free ligands. The bound ligand can be identified by the transferred saturation. c | Transfer NOE (trNOE). Similar to (b): negative NOEs on the bound ligand are transferred by rapid ligand exchange to the bulk of free ligands. Therefore, trNOEs provide information on distances between protons of the ligand in the receptor-bound state. d | Interligand NOEs for pharmacophore mapping (INPHARMA). Protein-mediated NOEs between two or multiple simultaneously bound ligands are observed. Thus, INPHARMA peaks describe the orientation of the two ligands relative to each other in the receptor binding pocket.
Figure 9 |
Figure 9 |. NMR screening of biased ligands.
a | Structures and functions of β2AR ligands. Modifications of the ethanolamine tail moieties (highlighted in orange boxes) result in selective modulation of the efficacies for β-arrestin signaling, whereas modifications of the aromatic head groups (highlighted in blue boxes) affect the efficacies of both G protein-mediated signaling and β-arrestin-mediated signaling. b | Crystal structure of the β2AR complex with the inverse agonist carazolol (PDB: 2RH1). TMV and TMVI (cyan) form the binding site for the aromatic head groups shown in (a). TMIII and TMVII (orange) form the binding site for the ethanolamine tail moieties shown in (a). 19F-NMR probes introduced at C265. (Cβ is shown cyan) enable studies of the roles of TMV and TMVI for G protein signaling efficacy. 19F-NMR probes introduced at C327. (Cβ is shown orange) enable studies of TMIII and TMVII in arrestin bias. c | Structure–function relationships of derivatives of the MOR ligand oliceridine. Modification of either of the two aromatic rings that are highlighted in boxes results in selective modulation of β-arrestin signaling. d | Crystal structure of MOR with a morphinan antagonist (PDB: 4DKL). TMIII, TMV, TMVI and TMVII are shown as purple ribbons, and Cε atoms from M163., M245., M257., M283. are shown as purple spheres. NMR studies observing 13CH3 groups of these four methionines suggest that TMIII, TMV, TMVI and TMVII are involved in G protein/arrestin signaling bias.

References

    1. Rask-Andersen M, Almén MS & Schiöth HB Trends in the exploitation of novel drug targets. Nat. Rev. Drug Discov. 10, 579–590, doi:10.1038/nrd3478 (2011). - DOI - PubMed
    1. Hauser AS, Attwood MM, Rask-Andersen M, Schiöth HB & Gloriam DE Trends in GPCR drug discovery: new agents, targets and indications. Nat. Rev. Drug Discov. 16, 829–842, doi:10.1038/nrd.2017.178 (2017). - DOI - PMC - PubMed
    1. Santos R et al. A comprehensive map of molecular drug targets. Nat. Rev. Drug Discov. 16, 19–34, doi:10.1038/nrd.2016.230 (2017). - DOI - PMC - PubMed
    1. Jazayeri A, Andrews SP & Marshall FH Structurally enabled discovery of adenosine A2A receptor antagonists. Chem. Rev. 117, 21–37, doi:10.1021/acs.chemrev.6b00119 (2017). - DOI - PubMed
    1. Hutchings CJ, Koglin M, Olson WC & Marshall FH Opportunities for therapeutic antibodies directed at G-protein-coupled receptors. Nat. Rev. Drug Discov. 16, 787–810, doi:10.1038/nrd.2017.91 (2017). - DOI - PubMed

Publication types

MeSH terms

Substances