. 2018 Nov 8;8(1):16512.
doi: 10.1038/s41598-018-34841-6.

A practical protocol for measurements of spinal cord functional connectivity

Affiliations

A practical protocol for measurements of spinal cord functional connectivity

Robert L Barry et al. Sci Rep. .

Abstract

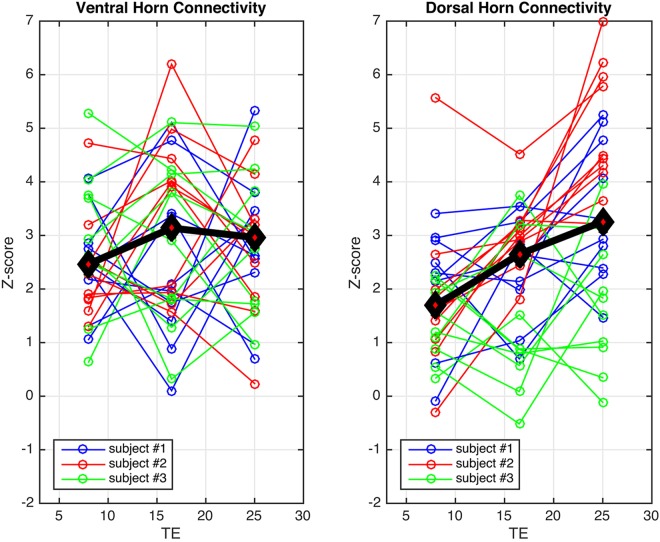
Resting state functional magnetic resonance imaging (fMRI) has been used to study human brain function for over two decades, but only recently has this technique been successfully translated to the human spinal cord. The spinal cord is structurally and functionally unique, so resting state fMRI methods developed and optimized for the brain may not be appropriate when applied to the cord. This report therefore investigates the relative impact of different acquisition and processing choices (including run length, echo time, and bandpass filter width) on the detectability of resting state spinal cord networks at 3T. Our results suggest that frequencies beyond 0.08 Hz should be included in resting state analyses, a run length of ~8-12 mins is appropriate for reliable detection of the ventral (motor) network, and longer echo times - yet still shorter than values typically used for fMRI in the brain - may increase the detectability of the dorsal (sensory) network. Further studies are required to more fully understand and interpret the nature of resting state spinal cord networks in health and in disease, and the protocols described in this report are designed to assist such studies.


Conflict of interest statement

The authors declare no competing interests.

Figures

Figure 1
Figure 1
(A) Mid-sagittal slice from a healthy volunteer [S = superior, I = inferior, A = anterior, P = posterior]. (B) High-resolution anatomical image at C4 (acquired voxel size = 0.65 × 0.65 × 5 mm3, interpolated voxel size = 0.29 × 0.29 × 5 mm3) [V = ventral, D = dorsal, R = right, L = left]. (C) Functional image shows minimal distortions and excellent conspicuity between cerebrospinal fluid and the cord (acquired voxel size = 1 × 1 × 5 mm3, and interpolated to match the resolution of the anatomical image). The orientation shown in (B) is used for all axial images throughout this paper and the supplementary material.
Figure 2
Figure 2
Functional connectivity between ventral horns (top) and dorsal horns (bottom) for both acquisition sequences and three bandpass filter ranges for time series between 2 and 20 mins. Only points at every minute are displayed and analyzed, and, for clarity, the curves are temporally offset from one another slightly to better visualize the error bars. Error bars represents standard error of the mean across subjects. In the bottom panel, the figure legend relating color to volume acquisition time (VAT) and bandwidth (BW) refers to curves in both top and bottom panels.
Figure 3
Figure 3
Functional connectivity between ventral horns for increasing run length between t = 2 and t = 20 mins. Analysis performed in AFNI using the ‘InstaCorr’ function with a fixed statistical threshold of p < 0.001. Yellow denotes high temporal correlation (r > 0.50) with the single voxel time course at the green crosshair, and blue represents anti-correlations. The motor network becomes detectable at t = 6 mins and stable when t ≥ ~12 mins.
Figure 4
Figure 4
Visualization of five approximately equidistant anatomical slices (#1, #4, #6, #8, and #10, superior to inferior) and the corresponding registered mean functional slices with TE = 8.0, 16.5, and 25 ms in one representative subject. The grayscale values are kept constant across TEs by normalizing each image to its respective 98% percentile intensity. Across most slices in all subjects, longer TEs, especially at 25 ms, introduce significant artifacts that can significantly obscure spinal cord gray/white matter and increase the difficulty of accurate functional-to-anatomical registration. The corresponding TSNR maps for slices #2 to #11 are shown in Supp. Fig. S2.
Figure 5
Figure 5
Measurements of connectivity between ventral horns and between dorsal horns for TE = 8.0, 16.5, and 25 ms, respectively, for three subjects. Based upon the results of the “scan length” study, a high-pass filter is used to retain all frequencies above 0.01 Hz. There are no statistically significant effects of TE on ventral z-scores for any subject, but dorsal z-scores are significantly higher at TE = 25 ms compared to TE = 8.0 ms for subject #1 (paired, p < 0.05) and subject #2 (paired, p < 0.001). A black and red diamond marks the median z-score for each aggregate column.

References

    1. Biswal B, Yetkin FZ, Haughton VM, Hyde JS. Functional connectivity in the motor cortex of resting human brain using echo-planar MRI. Magn Reson Med. 1995;34:537–541. doi: 10.1002/mrm.1910340409. - DOI - PubMed
    1. Biswal BB, et al. Toward discovery science of human brain function. Proc Natl Acad Sci USA. 2010;107:4734–4739. doi: 10.1073/pnas.0911855107. - DOI - PMC - PubMed
    1. Fox MD, Greicius M. Clinical applications of resting state functional connectivity. Front Syst Neurosci. 2010;4:19. - PMC - PubMed
    1. Yoshizawa T, Nose T, Moore GJ, Sillerud LO. Functional magnetic resonance imaging of motor activation in the human cervical spinal cord. Neuroimage. 1996;4:174–182. doi: 10.1006/nimg.1996.0068. - DOI - PubMed
    1. Stroman PW, Nance PW, Ryner LN. BOLD MRI of the human cervical spinal cord at 3 Tesla. Magn Reson Med. 1999;42:571–576. doi: 10.1002/(SICI)1522-2594(199909)42:3<571::AID-MRM20>3.0.CO;2-N. - DOI - PubMed

Publication types