Review
. 2018 Dec;9(6):1057-1075.
doi: 10.1007/s13244-018-0661-y. Epub 2018 Nov 8.

Brain tumour post-treatment imaging and treatment-related complications

Affiliations
Review

Brain tumour post-treatment imaging and treatment-related complications

Alexander T Kessler et al. Insights Imaging. 2018 Dec.

Abstract

Purpose: The imaging of primary and metastatic brain tumours is very complex and relies heavily on advanced magnetic resonance imaging (MRI). Utilisation of these advanced imaging techniques is essential in helping clinicians determine tumour response after initiation of treatment. Many options are currently available to treat brain tumours, and each can significantly alter the brain tumour appearance on post-treatment imaging. In addition, there are several common and uncommon treatment-related complications that are important to identify on standard post-treatment imaging.

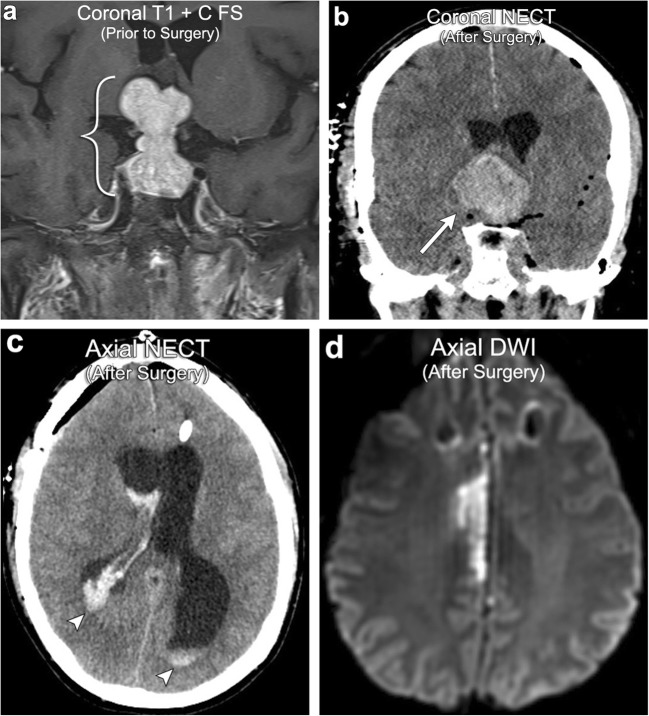
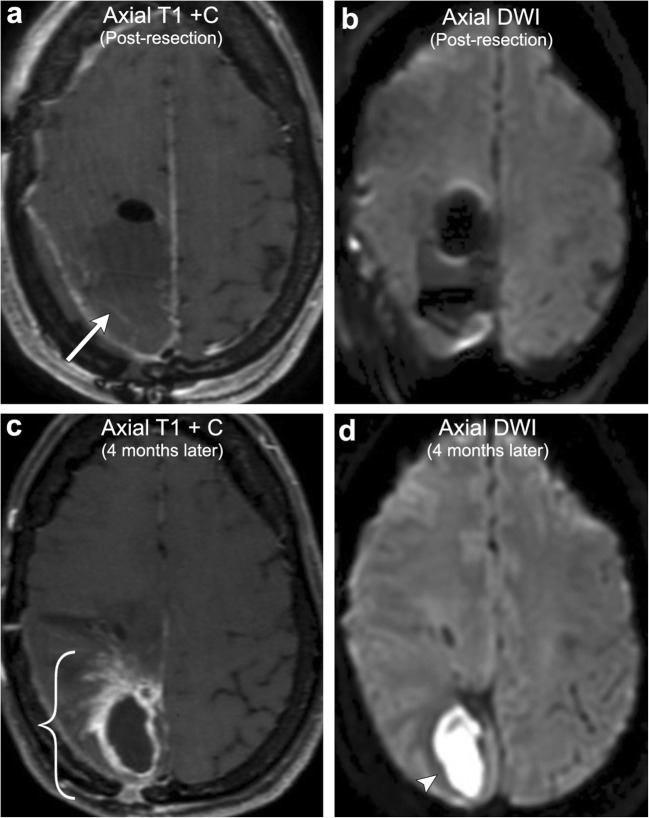
Methods: This article provides a review of the various post-treatment-related imaging appearances of brain neoplasms, including a discussion of advanced MR imaging techniques available and treatment response criteria most commonly used in clinical practice. This article also provides a review of the multitude of treatment-related complications that can be identified on routine post-treatment imaging, with an emphasis on radiation-induced, chemotherapy-induced, and post-surgical entities. Although radiological evaluation of brain tumours after treatment can be quite challenging, knowledge of the various imaging techniques available can help the radiologist distinguish treatment response from tumour progression and has the potential to save patients from inappropriate alterations in treatment. In addition, knowledge of common post-treatment-related complications that can be identified on imaging can help the radiologist play a key role in preventing significant patient morbidity/mortality.

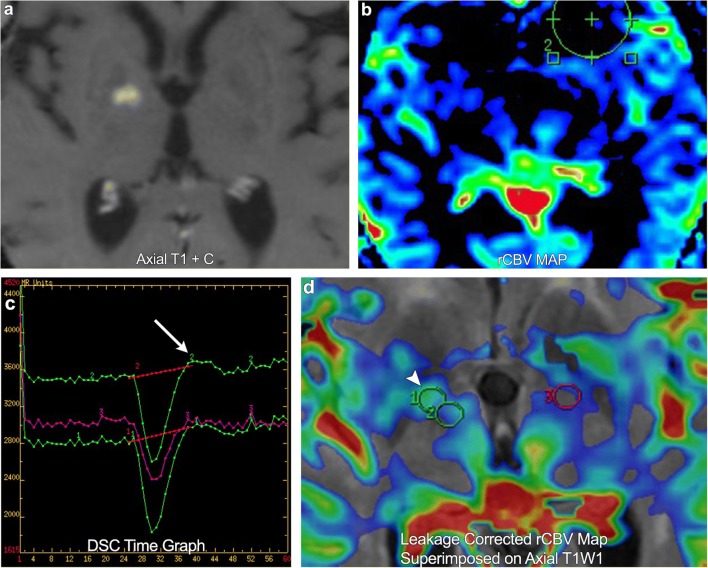
Teaching points: • Contrast enhancement does not reliably define tumour extent in many low-grade or infiltrative gliomas. • Focal regions of elevated cerebral blood volume (rCBV) on dynamic susceptibility contrast (DSC) perfusion-weighted imaging are suggestive of tumour growth/recurrence. • Brain tumour treatment response criteria rely on both imaging and clinical parameters. • Chemotherapeutic agents can potentiate many forms of radiation-induced injury. • Ipilimumab-induced hypophysitis results in transient diffuse enlargement of the pituitary gland.

Keywords: Brain neoplasms; Glioma; Neoplasm metastasis; Radiotherapy; Review.


Figures

Fig. 1
Fig. 1
Pathology-proven low-grade glioma. A 58-year-old male with a T2 FLAIR hyperintense mass in the right thalamus (arrow). No associated enhancement (arrowhead)
Fig. 2
Fig. 2
Postoperative ischaemia. A 39-year-old male with preoperative imaging (first row of images) demonstrating a T2 hypointense, diffusion-restricting left parietal lobe mass, suggestive of a hypercellular tumour (arrows). Immediate postoperative imaging (second row of images) shows Gliadel wafers in the resection cavity and a new area of diffusion restriction medial to the resection cavity suggestive of postoperative ischaemia (arrowheads)
Fig. 3
Fig. 3
Normal DSC perfusion maps (CBF and CBV) with an adequate time graph
Fig. 4
Fig. 4
Pathology-proven CNS lymphoma. A 67-year-old male with an avidly enhancing right frontal lobe mass (arrow). Colour perfusion map demonstrates elevated rCBV within the tumour (arrowhead)
Fig. 5
Fig. 5
A 73-year-old female with right frontal lobe glioblastoma multiforme. Post-treatment imaging demonstrates a new region of enhancement in the right basal ganglia. DSC rCBV map shows no definite increased perfusion. However, the time graph demonstrates overshoot (arrow). DSC leakage-corrected map superimposed on axial T1WI now shows asymmetric elevated rCBV in the enhancing lesion (arrowhead), compatible with a new site of tumour
Fig. 6
Fig. 6
Hunter’s angle. Normal MR spectroscopy demonstrating a gradual increase in metabolite peaks of choline, creatine, and NAA (arrows). No lipid/lactate peak is present
Fig. 7
Fig. 7
MR spectroscopy of pathology-proven radiation necrosis. Decreased choline, creatine, and NAA peaks (arrows) and an elevated lipid/lactate peak (arrowhead)
Fig. 8
Fig. 8
Pseudoprogression. A 46-year-old male with left callosal/pericallosal glioblastoma multiforme. Initial post-resection MRI demonstrates a small area of irregular enhancement along the anterior margin of the resection cavity (arrow). Follow-up imaging obtained 4 months later (2 months after completion of radiation) demonstrates a significant increase in peripheral, now thick, fluffy enhancement along the resection cavity, most marked posteriorly (bracket). Repeat MRI obtained 8 months post resection demonstrates decreased enhancement (arrowhead). No appreciable elevated perfusion or diffusion restriction was present (not shown). The constellation of findings is compatible with pseudoprogression on the 4-month postoperative scan
Fig. 9
Fig. 9
Pseudoresponse. A 38-year-old male with left frontal astrocytoma. Initial imaging demonstrates a peripherally enhancing lesion in the left frontal lobe. Follow-up imaging 4 weeks after starting bevacivumab demonstrates a marked interval decrease in enhancement (arrow). However, there is persistent T2 FLAIR hyperintensity and low ADC signal (arrowheads). Serial imaging afterwards (not shown) demonstrated progression in T2 FLAIR hyperintensity and mass effect, confirming pseudoresponse
Fig. 10
Fig. 10
Partial response. A 55-year-old female with breast cancer. Initial staging MRI demonstrates a large rim-enhancing left frontoparietal brain metastasis. Follow-up imaging obtained 9 months after completion of radiation (not on steroid medication) demonstrates a > 30% decrease in the size of the metastasis, no associated low ADC signal, and the absence of elevated cerebral perfusion (arrows). Spectroscopy demonstrates suppressed NAA, choline, and creatine peaks as well as an elevated lipid/lactate peak (arrowhead). Findings consistent with partial response
Fig. 11
Fig. 11
Radiation-induced vasculopathy and mineralising microangiopathy. A 35-year-old male with a history of radiation for craniopharyngioma (brackets). The patient went on to develop multiple strokes over subsequent years with MRA images demonstrating multiple areas of severe stenosis of the intracranial vasculature, most notable in the basilar artery and left supraclinoid ICA (arrows); this is compatible with radiation-induced vasculopathy. CT demonstrates dense calcifications in the subcortical white matter and basal ganglia (arrowheads), consistent with mineralising microangiopathy
Fig. 12
Fig. 12
Radiation-induced cavernous angiomas (cavernomas). A 76-year-old female with a history of lung cancer, multiple intracranial metastases (arrows). Susceptibility-weighted imaging (SWI) at the time of diagnosis demonstrates no foci of abnormal low T2-star signal/blooming in the brain parenchyma. SWI imaging performed 2 years after whole-brain radiation therapy (WBRT) demonstrates multiple foci of new abnormal low T2-star signal scattered within the brain parenchyma (arrowheads), consistent with radiation-induced cavernous angiomas
Fig. 13
Fig. 13
Radiation necrosis. A 58-year-old male with left sphenoid wing meningioma extending into the left cavernous sinus and orbital apex (bracket). The left basifrontal region at that time was unremarkable. Follow-up imaging 2 years after receiving radiation now demonstrates several irregular rim-enhancing lesions in the left basifrontal region (arrows). There is no abnormal corresponding DWI signal. Follow-up imaging 5 years after radiation now demonstrates resolution of the irregular enhancing lesions in the left basifrontal region (arrowhead), confirming radiation necrosis
Fig. 14
Fig. 14
Radiation-induced leukoencephalopathy. A 47-year-old female with a history of multiple intracranial thyroid carcinoma metastases (arrows). The patient received WBRT and then developed gradual cognitive decline over the subsequent few years. Imaging performed 3 years after WBRT demonstrates extensive periventricular T2 FLAIR hyperintensity (arrowheads), more than would be expected for age-related microvascular disease, consistent with radiation-induced leukoencephalopathy. Note the relative sparing of subcortical U fibres
Fig. 15
Fig. 15
SMART syndrome. A 31-year-old male with a history of posterior fossa atypical teratoid rhabdoid tumour resected and radiated 10 years prior, now presents with persistent headaches, visual field deficits, and 1 day of word-finding difficulties. MRI images demonstrate gyriform thickening and a high T2 FLAIR signal involving much of the posterior cortex of the left temporal, parietal, and occipital lobes (arrow). There is associated mild diffusion restriction (arrowhead) and gyriform enhancement (bracket). Follow-up EEG demonstrated no epileptiform activity and symptoms subsequently resolved. Imaging findings and clinical course compatible with SMART syndrome
Fig. 16
Fig. 16
Ipilimumab-induced hypophysitis. A 63-year-old male with metastatic melanoma. Initial imaging demonstrates a partially empty sella with an otherwise normal pituitary gland (arrow). After initiation of ipilimumab, there is marked heterogeneous enlargement of the pituitary gland (arrowhead) compatible with ipilimumab-induced hypophysitis. Imaging 6 weeks after cessation of ipilimumab demonstrates resolution of pituitary enlargement (bracket). However, patient now has clinical and laboratory evidence of panhypopituitarism
Fig. 17
Fig. 17
Postoperative complication: haemorrhage and infarct. A 52-year-old male with a large pituitary macroadenoma (bracket). Postoperative imaging after gross resection demonstrates haemorrhagic enlargement of the residual component of the adenoma consistent with apoplexy (arrow). There is also intraventricular extension of haemorrhage (arrowheads). Follow-up MRI demonstrates right anterior cerebral artery (ACA) territory infarction due to mass effect on the right ACA from the enlarged haemorrhagic pituitary adenoma
Fig. 18
Fig. 18
Postoperative complication: abscess. A 45-year-old female with a history of right parietal lobe anaplastic astrocytoma resection. Initial post-resection imaging demonstrates faint peripheral enhancement of the surgical cavity (arrow) and no internal diffusion restriction. About 4 months after, the patient described a persistent “scab” over the surgical site, increasing headaches, and subjective fever. Repeat imaging shows thick rim enhancement (bracket) with internal diffusion restriction (arrowhead), consistent with abscess formation, confirmed intraoperatively

References

    1. Cha S. Update on brain tumor imaging: from anatomy to physiology. AJNR Am J Neuroradiol. 2006;27(3):475–487. - PMC - PubMed
    1. Bulakbasi N, Guvenc I, Onguru O, Erdogan E, Tayfun C, Ucoz T. The added value of the apparent diffusion coefficient calculation to magnetic resonance imaging in the differentiation and grading of malignant brain tumors. J Comput Assist Tomogr. 2004;28:735–746. doi: 10.1097/00004728-200411000-00003. - DOI - PubMed
    1. Smith JS, Cha S, Mayo MC, et al. Serial diffusion-weighted magnetic resonance imaging in cases of glioma: distinguishing tumor recurrence from postresection injury. J Neurosurg. 2005;103:428–438. doi: 10.3171/jns.2005.103.3.0428. - DOI - PubMed
    1. Pauleit D, Langen KJ, Floeth F, et al. Can the apparent diffusion coefficient be used as a noninvasive parameter to distinguish tumor tissue from peritumoral tissue in cerebral gliomas? J Magn Reson Imaging. 2004;20:758–764. doi: 10.1002/jmri.20177. - DOI - PubMed
    1. Chan AA, Nelson SJ (2004) Simplified gamma-variate fitting of perfusion curves. 2nd IEEE International Symposium on Biomedical Imaging: Nano to Macro 2(2):1067-1070

LinkOut - more resources