Monocytes show immunoregulatory capacity on CD4+ T cells in a human in-vitro model of extracorporeal photopheresis
- PMID: 30411330
- PMCID: PMC6378377
- DOI: 10.1111/cei.13232
Monocytes show immunoregulatory capacity on CD4+ T cells in a human in-vitro model of extracorporeal photopheresis
Abstract
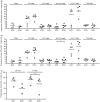
Extracorporeal photopheresis (ECP) is a widely used immunomodulatory therapy for the treatment of various T cell-mediated disorders such as cutaneous T cell lymphoma (CTCL), graft-versus-host disease (GvHD) or systemic sclerosis. Although clinical benefits of ECP are already well described, the underlying mechanism of action of ECP is not yet fully understood. Knowledge on the fate of CD14+ monocytes in the context of ECP is particularly limited and controversial. Here, we investigated the immunoregulatory function of ECP treated monocytes on T cells in an in-vitro ECP model. We show that ECP-treated monocytes significantly induce proinflammatory T cell types in co-cultured T cells, while anti-inflammatory T cells remain unaffected. Furthermore, we found significantly reduced proliferation rates of T cells after co-culture with ECP-treated monocytes. Both changes in interleukin secretion and proliferation were dependent on cell-contact between monocytes and T cells. Interestingly, blocking interactions of programmed death ligand 1 (PD-L1) to programmed death 1 (PD-1) in the in-vitro model led to a significant recovery of T cell proliferation. These results set the base for further studies on the mechanism of ECP, especially the regulatory role of ECP-treated monocytes.
Keywords: PD-L1/2; Th17 cells; extracorporeal photopheresis; monocytes; proliferation.
© 2018 British Society for Immunology.
Figures


Similar articles
-
Extracorporeal photopheresis attenuates murine graft-versus-host disease via bone marrow-derived interleukin-10 and preserves responses to dendritic cell vaccination.Biol Blood Marrow Transplant. 2011 Jun;17(6):790-9. doi: 10.1016/j.bbmt.2010.12.712. Epub 2011 Jan 7. Biol Blood Marrow Transplant. 2011. PMID: 21216299 Free PMC article.
-
Treatment of cutaneous T cell lymphoma with extracorporeal photopheresis induces Fas-ligand expression on treated T cells, but does not suppress the expression of co-stimulatory molecules on monocytes.J Photochem Photobiol B. 2003 Feb;69(2):129-38. doi: 10.1016/s1011-1344(02)00414-1. J Photochem Photobiol B. 2003. PMID: 12633985
-
Lymphocytes treated by extracorporeal photopheresis can down-regulate cytokine production in untreated monocytes.Photodermatol Photoimmunol Photomed. 2005 Dec;21(6):293-302. doi: 10.1111/j.1600-0781.2005.00192.x. Photodermatol Photoimmunol Photomed. 2005. PMID: 16313240
-
Extracorporeal photopheresis: a focus on apoptosis and cytokines.J Dermatol Sci. 2006 Aug;43(2):85-94. doi: 10.1016/j.jdermsci.2006.05.004. Epub 2006 Jun 23. J Dermatol Sci. 2006. PMID: 16797926 Review.
-
Updating ECP action mechanisms.Transfus Apher Sci. 2014 Jun;50(3):330-9. doi: 10.1016/j.transci.2014.04.003. Epub 2014 Apr 13. Transfus Apher Sci. 2014. PMID: 24837416 Review.
Cited by
-
Extracorporeal photopheresis as an immunomodulatory treatment modality for chronic GvHD and the importance of emerging biomarkers.Front Immunol. 2023 Feb 17;14:1086006. doi: 10.3389/fimmu.2023.1086006. eCollection 2023. Front Immunol. 2023. PMID: 36875063 Free PMC article. Review.
-
Extracorporeal Photopheresis (ECP) and the Potential of Novel Biomarkers in Optimizing Management of Acute and Chronic Graft vs. Host Disease (GvHD).Front Immunol. 2020 Jan 31;11:81. doi: 10.3389/fimmu.2020.00081. eCollection 2020. Front Immunol. 2020. PMID: 32082329 Free PMC article. Review.
-
Extracorporeal Photopheresis: A Case of Immunotherapy Ahead of Its Time.Transfus Med Hemother. 2020 Jun;47(3):226-235. doi: 10.1159/000508479. Epub 2020 May 27. Transfus Med Hemother. 2020. PMID: 32595427 Free PMC article. Review.
-
European dermatology forum - updated guidelines on the use of extracorporeal photopheresis 2020 - part 1.J Eur Acad Dermatol Venereol. 2020 Dec;34(12):2693-2716. doi: 10.1111/jdv.16890. Epub 2020 Oct 6. J Eur Acad Dermatol Venereol. 2020. PMID: 33025659 Free PMC article.
References
-
- Edelson R, Berger C, Gasparro F et al Treatment of cutaneous T‐cell lymphoma by extracorporeal photochemotherapy. Preliminary results. N Engl J Med 1987;316:297–303. - PubMed
-
- Knobler R, Duvic M, Querfeld C et al Long‐term follow‐up and survival of cutaneous T‐cell lymphoma patients treated with extracorporeal photopheresis. Photodermatol Photoimmunol Photomed 2012;28:250–7. - PubMed
-
- Duvic M, Chiao N, Talpur R. Extracorporeal photopheresis for the treatment of cutaneous T‐cell lymphoma. J Cutan Med Surg 2003;7(Suppl. 4):3–7. - PubMed
-
- Evans AV, Wood BP, Scarisbrick JJ et al Extracorporeal photopheresis in Sezary syndrome: hematologic parameters as predictors of response. Blood 2001;98:1298–301. - PubMed
-
- Dall’Amico R, Messina C. Extracorporeal photochemotherapy for the treatment of graft‐versus‐host disease. Ther Apher 2002;6:296–304. - PubMed
Publication types
MeSH terms
Substances
LinkOut - more resources
Full Text Sources
Research Materials

