. 2018 Nov 9:7:e38472.
doi: 10.7554/eLife.38472.

Inhibition of mTORC1 by ER stress impairs neonatal β-cell expansion and predisposes to diabetes in the Akita mouse

Affiliations

Inhibition of mTORC1 by ER stress impairs neonatal β-cell expansion and predisposes to diabetes in the Akita mouse

Yael Riahi et al. Elife. .

Abstract

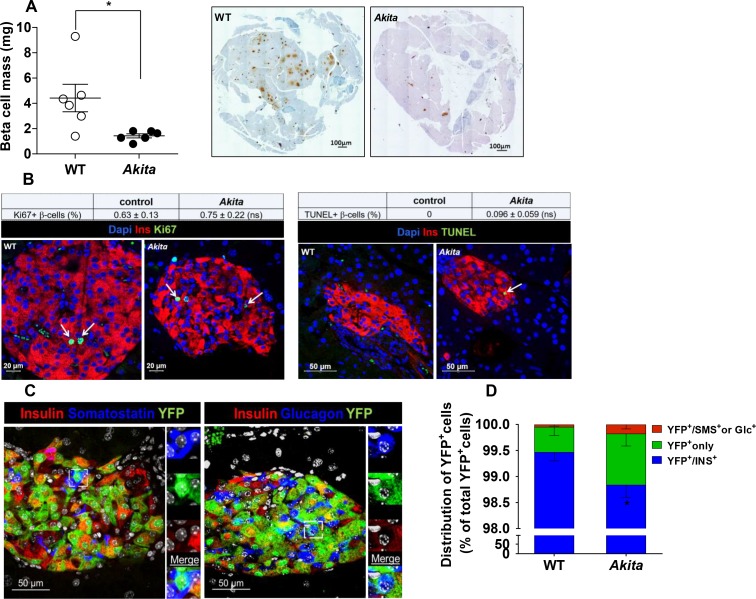
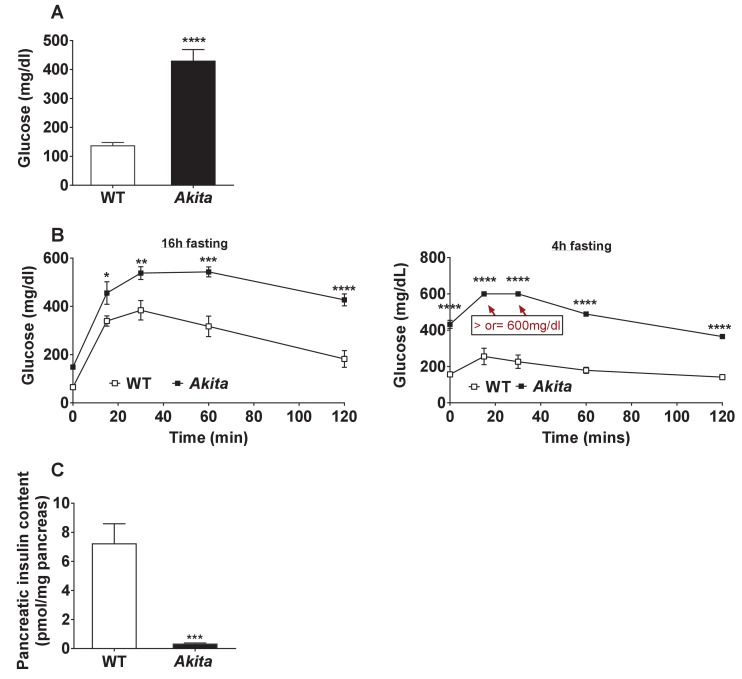
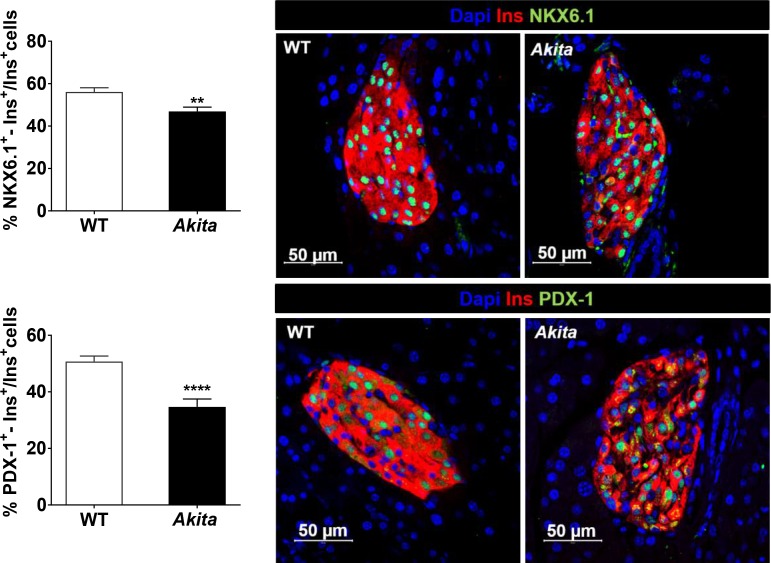
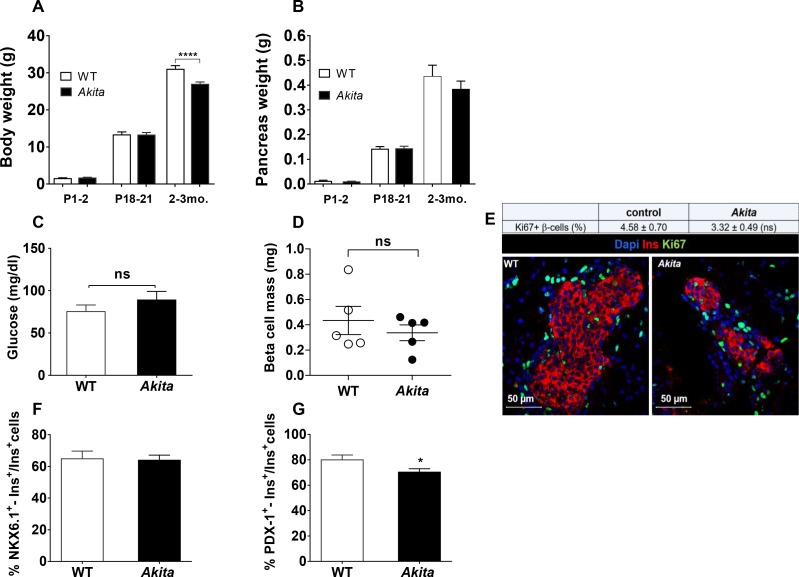
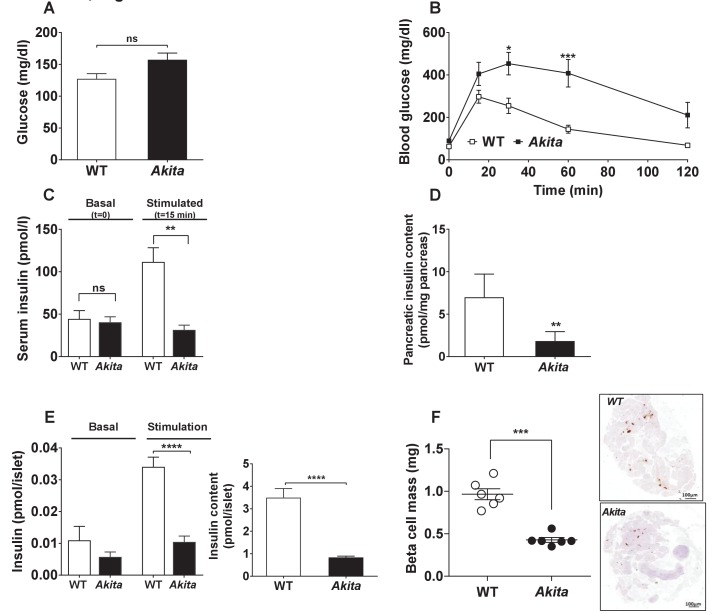
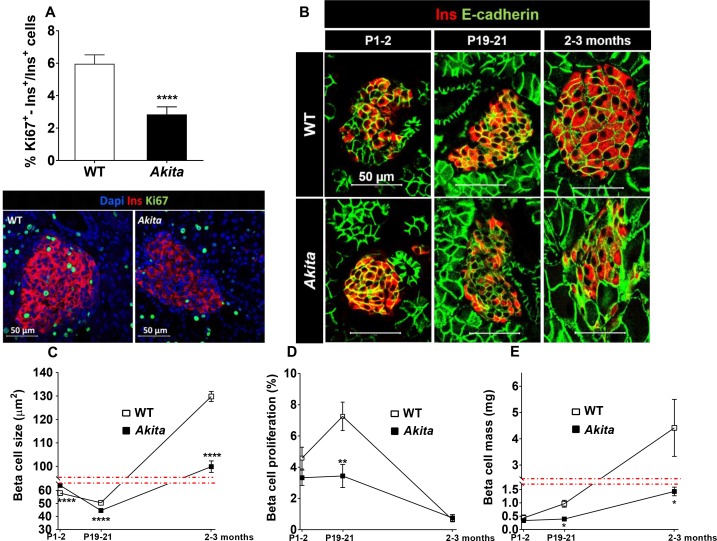
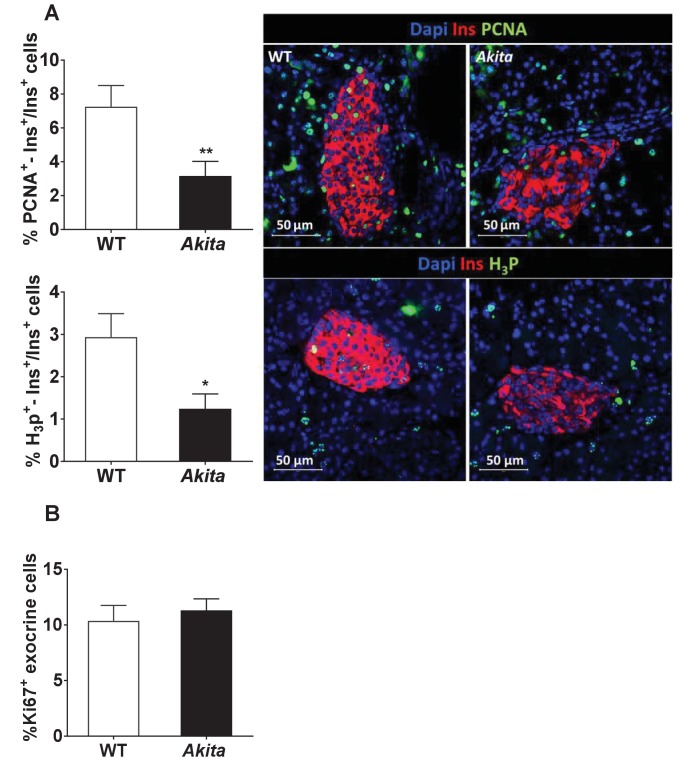
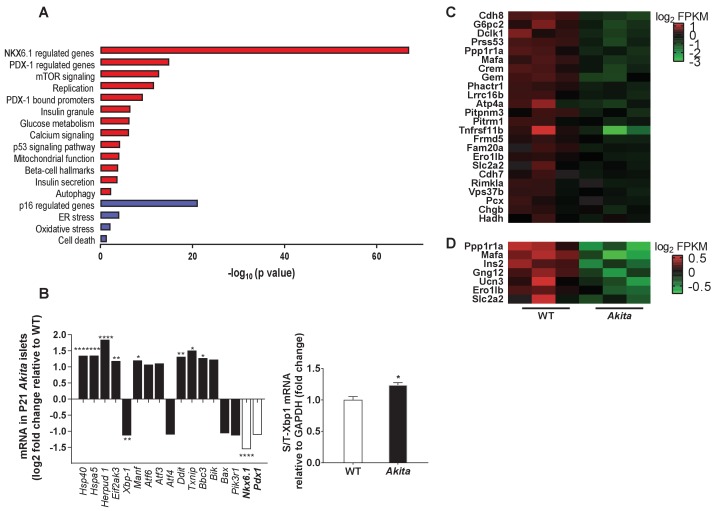
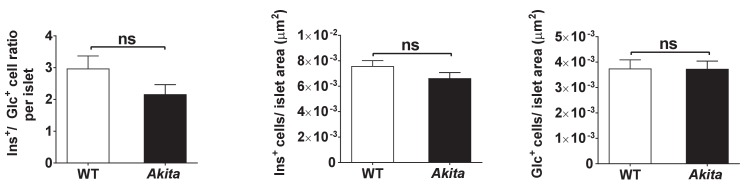
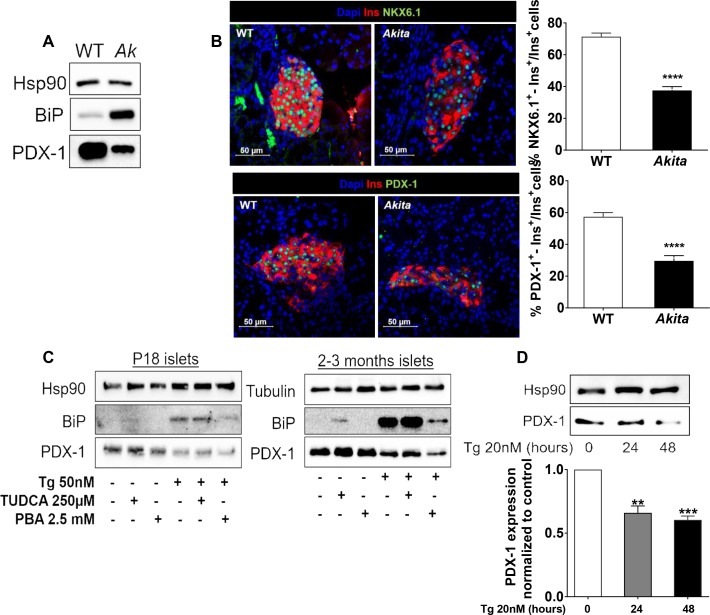
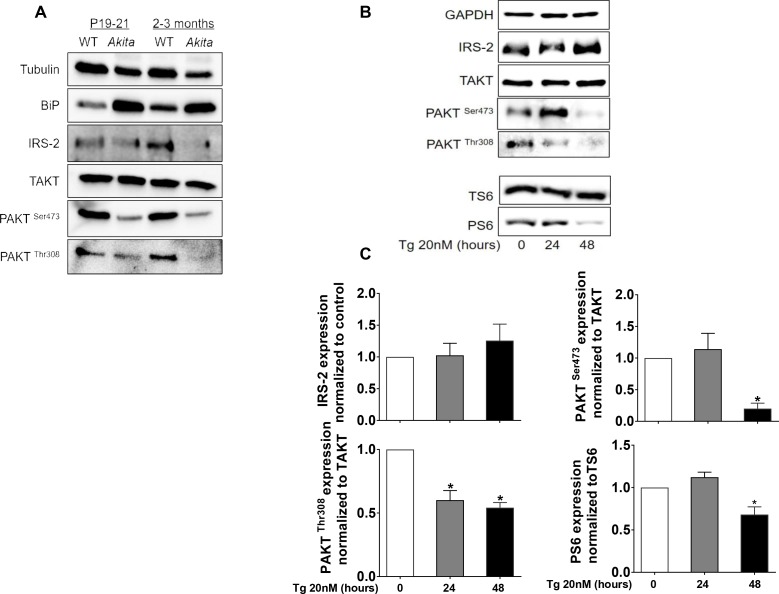
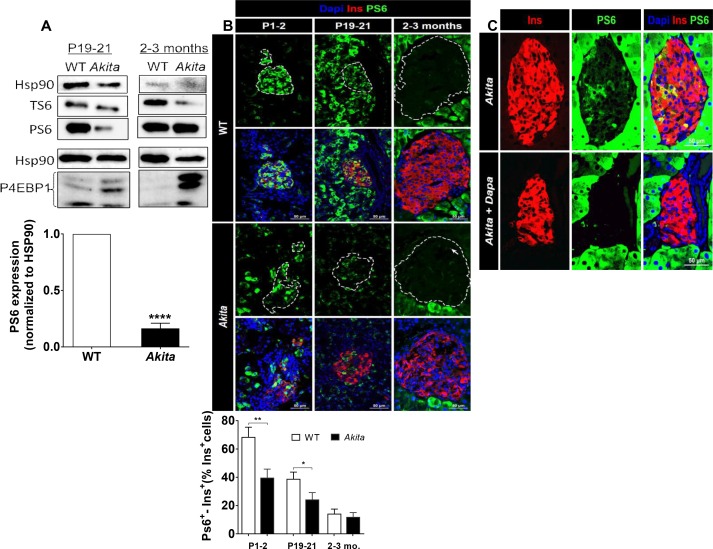
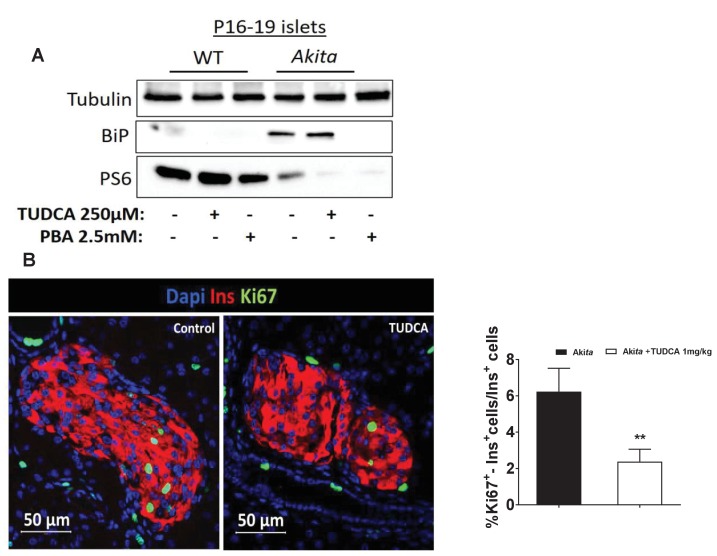
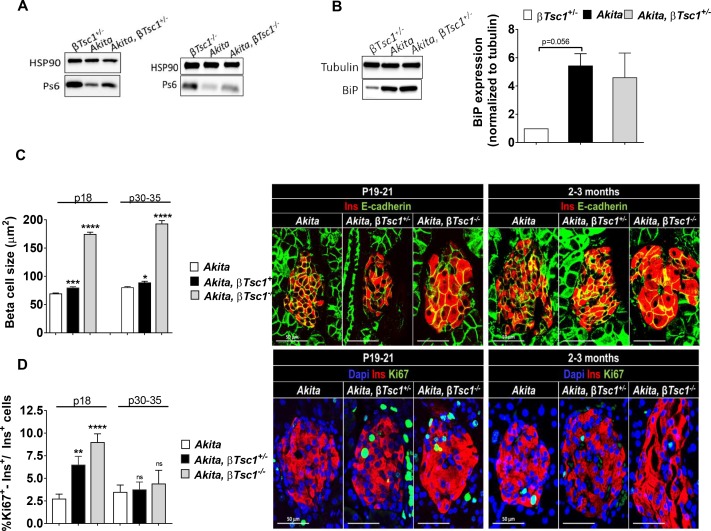
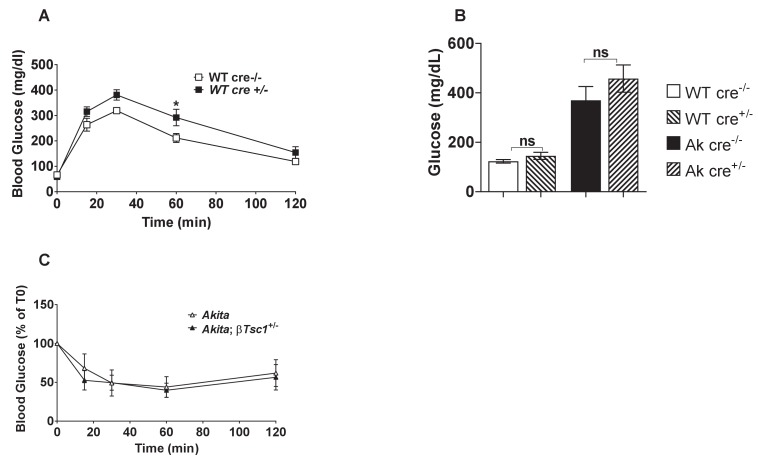
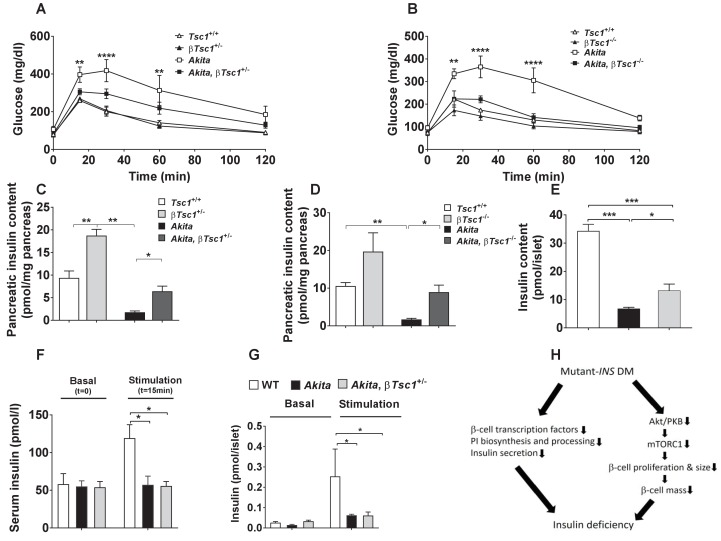
Unresolved ER stress followed by cell death is recognized as the main cause of a multitude of pathologies including neonatal diabetes. A systematic analysis of the mechanisms of β-cell loss and dysfunction in Akita mice, in which a mutation in the proinsulin gene causes a severe form of permanent neonatal diabetes, showed no increase in β-cell apoptosis throughout life. Surprisingly, we found that the main mechanism leading to β-cell dysfunction is marked impairment of β-cell growth during the early postnatal life due to transient inhibition of mTORC1, which governs postnatal β-cell growth and differentiation. Importantly, restoration of mTORC1 activity in neonate β-cells was sufficient to rescue postnatal β-cell growth, and to improve diabetes. We propose a scenario for the development of permanent neonatal diabetes, possibly also common forms of diabetes, where early-life events inducing ER stress affect β-cell mass expansion due to mTOR inhibition.

Keywords: Beta cells; ER stress; diabetes; human biology; mTOR; medicine; mouse; proinsulin misfolding; proliferation.


Conflict of interest statement

YR, TI, RY, SC, DA, MS, IA, MS, NP, EB, YD, EC, GL No competing interests declared

Figures

Figure 1.
Figure 1.. β-Cell mass, turnover and differentiation in adult Akita mice.
Analyses were performed on 2- to 3-month-old Akita mice and age-matched controls. (a) β-cell mass (n = 6 in each group); (b) β-cell proliferation and apoptosis assessed by staining for insulin and Ki67 (n = 6–7 mice in each group; a total of 4909 wild type (WT) and 2523 Akita β-cells were quantified) or TUNEL (n = 4–5 mice in each group; 2592 WT and 1754 Akita β-cells). The percentage of Ki67+ and TUNEL+β-cells is shown in the table above; (c–d) β-cell differentiation was assessed by lineage tracing. Wild-type and Akita mice were crossed with RIP-Cre:Rosa26-Yfp reporter mice; (c) pancreatic sections of Akita mice were immunostained for insulin and somatostatin or glucagon. Lineage-traced β-cells (YFP+) expressing somatostatin or glucagon is shown in squares and zoomed in; (d) quantification of insulin-expressing β-cells (percentage of insulin+/YFP+ cells), insulin-degranulated β-cells (percentage of insulin-/YFP+ cells) and of cells with misexpression of somatostatin or glucagon (percentage of somatostatin+ or glucagon+/YFP+ cells) in WT and Akita mice is shown; *p<0.05.
Figure 1—figure supplement 1.
Figure 1—figure supplement 1.. Glycemia and β-cell function in adult Akita and control mice.
(a) Fed blood glucose (n = 11–15 in each group); (b) IPGTT- glucose (1.5 g/kg) was injected intraperitoneally after an overnight or 4 hr fast (n = 4–5 in each group); (c) pancreatic insulin content analyzed by ELISA on whole pancreas extracts (n = 4–5 in each group). *p<0.05, **p<0.01, ***p<0.001, ****p<0.0001.
Figure 1—figure supplement 2.
Figure 1—figure supplement 2.. NKX6.1 and PDX-1 expression in adult Akitaβ-cells.
Pancreatic sections of 2- to 3-month-old Akita and control mice were stained for NKX6.1 (n = 5 mice in each group; 3348 WT and 2370 Akita β-cells) or PDX-1 and insulin (n = 5–7 mice in each group; 4580 WT and 2320 Akita β-cells). Values are mean ± SE. **p<0.01, ****p<0.0001.
Figure 2.
Figure 2.. Dynamic changes of body and pancreas growth and glycemia, β-cell mass, proliferation and differentiation in Akita and control mice at P1-2.
(a) body weight, (b) pancreas weight of wild-type and Akita mice at P1-2, P19-21 and at the age of 2–3 months. (a) P1-2: WT (n = 8); Akita mice (n = 4), P19-21: WT (n = 21); Akita mice (n = 23), 2–3 months: WT (n = 33); Akita mice (n = 39); (b) P1-2: WT (n = 8); Akita mice (n = 4), P19-21: n = 14 in each group, 2–3 months: n = 17 mice in each group). (c) fed blood glucose (n = 7–8 mice in each group); (d) β-cell mass (n = 5 mice in each group); (e) β-cell proliferation assessed by immunostaining for insulin and Ki67 (n = 4 mice in each group; 1886 WT and 1483 Akita β-cells). The percentage of Ki67β-cells is shown in the table above; (f–g) quantification of β-cells (insulin+) expressing NKX6.1 (n = 3–4 mice in each group; 1148 WT and 1808 Akita β-cells) and PDX-1 (n = 3–5 mice in each group; 1364 WT and 1507 Akita β-cells). *p<0.05, ****p<0.0001.
Figure 3.
Figure 3.. Metabolic state, β-cell function and mass in pre-weaning (P19-21) Akita mice and age-matched controls.
(a) fed blood glucose (n = 7 in each group); (b) IPGTT- glucose (1.5 g/kg) was injected intraperitoneally after an overnight fast (n = 5 in each group); (c) glucose-stimulated insulin secretion in vivo. Insulin was measured before and 15 min following IP glucose injection (1.5 g/kg); (d) pancreatic insulin content (n = 4–5 in each group); (e) basal (3.3 mmol/l glucose) and stimulated (16.7 mmol/l glucose) insulin secretion and insulin content of Akita and control islets analyzed by static incubations. Islets were divided into 4 batches of 25 islets per group (n = 3); (f) β-cell mass (n = 6 mice in each group). *p<0.05, **p<0.01, ***p<0.001, ****p<0.0001.
Figure 4.
Figure 4.. Dynamic changes in β-cell expansion in Akita and control mice.
(a) β-cell proliferation assessed by immunostaining for insulin and Ki67 (n = 6 mice in each group; 2541 WT and 3391 Akita β−cells); (b) β-cell size at P1-2 (newborn, n = 4–5 mice in each group; 334 WT and 435 Akita β-cells), P19-21 (pre-weaning, n = 3 mice in each group; 330 WT and 364 Akita β−cells) and in adult mice (2–3 month-old, n = 3 mice in each group; 266 WT and 417 Akita β−cells) assessed by immunostaining for E-cadherin and insulin. Quantifications of β-cell size (c), proliferation (d), and mass (e) are shown. *p<0.05, **p<0.01, ****p<0.0001.
Figure 4—figure supplement 1.
Figure 4—figure supplement 1.. Proliferation of β-cells and exocrine cells in pre-weaning Akita and control mice.
Analyses were performed on pancreatic sections of Akita mice and age-matched controls at 19–21 days stained for proliferation markers. (a) β-Cell proliferation was assessed by staining for insulin and PCNA (n = 3 mice in each group; 1241 WT and 1944 Akita β cells), or phospho-Histone H3 (H3P n = 3 mice in each group; 1176 WT and 1982 Akita β−cells). (b) Proliferation of pancreatic exocrine cells in pre-weaning Akita and control mice. Pancreatic sections of pre-weaning Akita and control mice were stained for insulin and Ki67 and exocrine cells surrounding the islets were used for quantification. The percentage of proliferating exocrine cells (Ki67+/INS-) is shown (n = 6 mice in each group; 2486 WT and 2670 Akita cells). *p<0.05, **p<0.01.
Figure 5.
Figure 5.. Transcriptomic analysis of ER stress markers and β-cell gene signature in neonate Akita islets.
(a) RNA-seq comparing the transcriptome of islets from P19-21 Akita and age-matched control mice (n = 3 samples in each group, each sample is a pool of islets from three mice). Columns represent pathways that are differentially regulated in Akita mice; (b) expression of UPR and apoptosis genes and of Nkx6.1 and Pdx1 in islets of Akita compared to control mice at P19-21. Spliced and total Xbp1 were also quantified by qPCR. The spliced/total Xbp1 ratio is shown beside (n = 3); (c–d) heat map of genes regulated by NKX6.1 (c) and PDX-1 (d) in Akita islets and controls. *p<0.05, **p<0.01, ***p<0.001, ****p<0.0001.
Figure 5—figure supplement 1.
Figure 5—figure supplement 1.. Islet composition of wild-type and Akita mice.
β/α cell ratio and number of β and α cells per islet area in P19-21 wild-type and Akita mice (n = 44 and 35 islets isolated from three to four mice in each group).
Figure 6.
Figure 6.. Effects of ER stress on the expression of β-cell transcription factors in neonate Akita islets (P19-21) and islets treated with thapsigargin.
(a) PDX-1 and BiP protein level analyzed by Western blotting (n = 3, each sample is a pool of islets from four to six mice); (b) quantification of NKX6.1 (n = 3 mice in each group; 1646 WT and 728 Akita β−cells), and PDX-1 (n = 3 mice in each group; 1534 WT and 844 Akita β−cells) expressing β-cells. Pancreatic sections were immunostained for NKX6.1 or PDX-1 and insulin. The percentage of NKX6.1- and PDX-1-positive β-cells is shown. (c) Islets from young (P19-21) and adult wild-type mice were treated with low-dose thapsigargin (50 nmol/l) and TUDCA (250 µmol/l) or PBA (2.5 mmol/l) for 48 hr with daily media changes and further analyzed by western blotting for PDX-1 and BiP (n = 3, each sample is a pool of islets from six to nine mice); (d) INS-1E cells were treated with 20 nmol/l thapsigargin for 24 and 48 hr followed by western blotting for PDX-1. **p<0.01, ***p<0.001, ****p<0.0001.
Figure 7.
Figure 7.. Effects of ER stress on IRS2/Akt signaling in Akita islets and in INS-1E treated with low-dose thapsigargin.
(a) IRS2/Akt signaling in islets from neonate (P19-21) and adult wild-type and Akita mice. Each sample is a pool of islets from 4 to 15 mice (n = 4 for neonate islets and n = 2 for adult islets). (b–c) INS-1E cells were treated with 20 nmol/l thapsigargin for 24 and 48 hr followed by western blotting for IRS2, total and phosphorylated Akt (Ser473 and Thr308) and S6 (Ser240/244). A representative experiment (b) and quantification (c) are shown (n = 4–6). *p<0.05.
Figure 8.
Figure 8.. mTORC1 signaling in neonate and adult Akita islets.
(a) Western blot analysis of S6 and 4EBP1 phosphorylation in islets of neonate (P19-21) and adult wild-type and Akita mice. Quantification of phosphorylated S6 in neonate Akita compared to control islets is shown (n = 3, each sample is a pool of islets from 4 to 7 mice); (b) immunostaining for phospho-S6 on pancreatic sections of P1-2, P19-21 and adult Akita mice and age-matched controls and quantifications of the percentage of S6β-cells (P1-2: n = 4 mice in each group; 1159 WT and 1655 Akita β−cells; P19-21: n = 6 mice in each group; 2259 WT and 1567 Akita β−cells; adult: n = 4–5 mice in each group; 2391 WT and 1383 Akita β-cells). Islet boundaries are marked by dotted line; (c) adult Akita mice were treated with 25 mg/kg dapagliflozin in drinking water for 72 hr. Blood glucose in dapagliflozin-treated Akita mice was ~ 200 mg/dl compared to ~ 500 mg/dl in control Akita mice. Pancreatic sections were immunostained for insulin and phospho-S6 (n = 3 mice in each group). *p<0.05, **p<0.01, ****p<0.0001.
Figure 8—figure supplement 1.
Figure 8—figure supplement 1.. Effects of chemical chaperones on mTORC1 activity in neonate Akita islets and controls.
(a) islets of P16-19 Akita and wild-type (WT) mice were treated with 250 μmol/l TUDCA or 2.5 mmol/l PBA for 48 hr followed by western blotting for BiP and phosphorylated S6 (n = 3, each sample is a pool of islets from 4 to 9 mice); (b) effects of TUDCA on β-cell proliferation in neonate Akita mice (P18-20). TUDCA (1 mg/kg) was injected IP twice daily for 48 hr followed by immunostaining of pancreatic sections for Ki67 and insulin (n = 4–6 mice in each group; 1403 control Akita and 2183 TUDCA-treated Akitaβ-cells). **p<0.01.
Figure 9.
Figure 9.. Effects of mTORC1 activation in neonate Akita β-cells on β-cell size and proliferation.
Studies were performed on heterozygous and homozygous βTsc1 knockout Akita mice (RIP-Cre:Tsc1flox/+:Akita (Akita, βTsc1+/-) and RIP-Cre:Tsc1flox/flox:Akita (Akita, βTsc1-/-). Tsc1flox/+:Akita and Tsc1flox/flox:Akita were used as Akita controls. RIP-Cre:Tsc1flox/+ mice (βTsc1+/-) and RIP-Cre:Tsc1flox/flox mice (βTsc1-/-) were used as WT controls (a, b). (a) Western blotting for phospho-S6 on islets from homozygous and heterozygous knockout mice and matched controls (n = 4, each sample is a pool of islets from two to four mice); (b) Western blotting and quantification of BiP expression in wild-type, Akita and Akita, βTsc1 +/- mice (n = 4, each sample is a pool of islets from two to four mice); (c) β-cell size was assessed by immunostaining for insulin and E-cadherin (n = 400–500 β-cells per group), (d) β-cell proliferation was assessed by immunostaining for insulin and Ki67 (n = 1200–1400 β−cells per group). Quantifications and representative images are shown. *p<0.05, **p<0.01, ***p<0.001, ****p<0.0001.
Figure 9—figure supplement 1.
Figure 9—figure supplement 1.. Metabolic characterization of RIP-Cre mouse.
(a) IPGTT- glucose (1.5 gr/kg) was injected after an overnight fast to adult RIP-Cre and non-transgenic control mice (n = 3); (b) fed blood glucose of adult RIP-Cre mice and RIP-Cre:Akita mice compared to non-transgenic controls (n = 6–8); (c) insulin tolerance test on Akita and RIP-Cre:Akita mice (n = 3). *p<0.05.
Figure 10.
Figure 10.. Effects of mTORC1 activation in neonate Akita β-cells on diabetes.
(a–b) IPGTT at P30-35: glucose (1 g/kg) was injected IP after an overnight fast; (a) heterozygous Tsc1 knockout Akita mice (RIP-Cre:Tsc1flox/+:Akita (Akita, βTsc1+/-) and matched controls: Tsc1flox/+ mice (Tsc1+/+), RIP-Cre:Tsc1flox/+ mice (βTsc1+/-), and Tsc1flox/+:Akita (Akita) (n = 3–5 mice in each group); (b) homozygous Tsc1 knockout Akita mice (RIP-Cre:Tsc1flox/flox:Akita (Akita, βTsc1-/-) and matched controls: Tsc1flox/flox mice (Tsc+/+), RIP-Cre:Tsc1flox/flox mice (βTsc1-/-), and Tsc1flox/flox:Akita (Akita) (n = 3–5 in each group); (c–d) pancreatic insulin content of heterozygous and homozygous Tsc1 knockout Akita mice and matched controls at P30-35 (WT (n = 7), Akita (n = 11), Akita, βTsc1+/- (n = 3) and Akita, βTsc1-/- (n = 4); (e) islet insulin content. (f–g) Effects of mTORC1 activation in neonate Akita β-cells on insulin secretion in vivo and ex vivo. (f) insulin secretion in response to IP glucose injection (n = 6 mice in each group); (g) islets were isolated from Tsc1flox/+ WT mice (WT), Tsc1flox/+:Akita (Akita) and RIP-Cre:Tsc1flox/+:Akita (Akita, βTsc1+/-) mice and insulin secretion assessed following static incubations at basal (3.3 mmol/l) and stimulated (16.7) mmol/l glucose. (h) a model of the pathophysiology of permanent neonatal diabetes. *p<0.05 **, p<0.01, ***, p<0.001****, p<0.0001.
Figure 10—figure supplement 1.
Figure 10—figure supplement 1.. Effects of mTORC1 activation in Akitaβ-cells on PDX-1 (a, b) and NKX6.1 expression (c, d).
Heterozygous (a, c) and homozygous (b, d) βTsc1 knockout Akita and age-matched controls were sacrificed at P18. Pancreatic sections were stained for insulin and PDX-1 (Akita (n = 1760 β-cells); Akita, βTsc1+/- (n = 814 β-cells); Akita, βTsc1-/- (n = 1458 β−cells) or NKX6.1 (Akita (n = 1500 β-cells); Akita, βTsc1+/- (n = 1438 β-cells); Akita, βTsc1-/- (n = 1584 β-cells).
Figure 10—figure supplement 2.
Figure 10—figure supplement 2.. Fed blood glucose of Tsc1flox/+ mice (WT), Tsc1flox/+:Akita (Akita) and heterozygous Tsc1 knockout RIP-Cre:Tsc1flox/+:Akita (Akita,βTsc1+/-) mice at the age of 2–3 months.
Blood glucose levels are the mean of the last three consecutive glucose measurements. **p<0.01, ***p<0.001.
Author response image 1.
Author response image 1.. Effects of 4 and 16h fast on IPGTT.
Wildtype (WT) and Akita mice were fasted for 4 or 16h followed by IPGTT (1.5 gr/kg glucose) (n=4 in each group).

Comment in

References

    1. Accili D, Ahrén B, Boitard C, Cerasi E, Henquin J-C, Seino S. What ails the β-cell? Diabetes, Obesity and Metabolism. 2010;12:1–3. doi: 10.1111/j.1463-1326.2010.01296.x. - DOI - PubMed
    1. Alejandro EU, Gregg B, Wallen T, Kumusoglu D, Meister D, Chen A, Merrins MJ, Satin LS, Liu M, Arvan P, Bernal-Mizrachi E. Maternal diet-induced microRNAs and mTOR underlie β cell dysfunction in offspring. Journal of Clinical Investigation. 2014;124:4395–4410. doi: 10.1172/JCI74237. - DOI - PMC - PubMed
    1. Bachar E, Ariav Y, Ketzinel-Gilad M, Cerasi E, Kaiser N, Leibowitz G. Glucose amplifies fatty acid-induced endoplasmic reticulum stress in pancreatic beta-cells via activation of mTORC1. PLoS ONE. 2009;4:e4954. doi: 10.1371/journal.pone.0004954. - DOI - PMC - PubMed
    1. Bachar-Wikstrom E, Wikstrom JD, Ariav Y, Tirosh B, Kaiser N, Cerasi E, Leibowitz G. Stimulation of autophagy improves endoplasmic reticulum stress-induced diabetes. Diabetes. 2013;62:1227–1237. doi: 10.2337/db12-1474. - DOI - PMC - PubMed
    1. Barker DJ. Adult consequences of fetal growth restriction. Clinical Obstetrics and Gynecology. 2006;49:270–283. doi: 10.1097/00003081-200606000-00009. - DOI - PubMed

Publication types

Substances

Supplementary concepts