. 2018 Nov 9;13(11):e0206948.
doi: 10.1371/journal.pone.0206948. eCollection 2018.

Comparative mRNA and miRNA transcriptome analysis of a mouse model of IGFIR-driven lung cancer

Affiliations

Comparative mRNA and miRNA transcriptome analysis of a mouse model of IGFIR-driven lung cancer

Robert A Jones et al. PLoS One. .

Abstract

Mouse models of cancer play an important role in elucidating the molecular mechanisms that contribute to tumorigenesis. The extent to which these models resemble one another and their human counterparts at the molecular level is critical in understanding tumorigenesis. In this study, we carried out a comparative gene expression analysis to generate a detailed molecular portrait of a transgenic mouse model of IGFIR-driven lung cancer. IGFIR-driven tumors displayed a strong resemblance with established mouse models of lung adenocarcinoma, particularly EGFR-driven models highlighted by elevated levels of the EGFR ligands Ereg and Areg. Cross-species analysis revealed a shared increase in human lung adenocarcinoma markers including Nkx2.1 and Napsa as well as alterations in a subset of genes with oncogenic and tumor suppressive properties such as Aurka, Ret, Klf4 and Lats2. Integrated miRNA and mRNA analysis in IGFIR-driven tumors identified interaction pairs with roles in ErbB signaling while cross-species analysis revealed coordinated expression of a subset of conserved miRNAs and their targets including miR-21-5p (Reck, Timp3 and Tgfbr3). Overall, these findings support the use of SPC-IGFIR mice as a model of human lung adenocarcinoma and provide a comprehensive knowledge base to dissect the molecular pathogenesis of tumor initiation and progression.


Conflict of interest statement

The authors have declared that no competing interests exist.

Figures
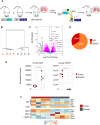
Fig 1
Fig 1. RNA-Seq analysis of SPC-IGFIR mice.
(A) Schematic of doxycycline inducible expression of IGFIR in the mouse lung via the SPC promoter. (B) Unsupervised hierarchical clustering dendrogram of RNA-Seq data from tumor (T, red) and non-transgenic normal lung (N, grey) samples. (C) Volcano plot of log2 fold changes and differential expression p values between tumor and normal lung tissue. (D) Pie chart illustrating percentage of genes up and down-regulated in IGFIR-driven tumors. (E) Dot plots of endogenous murine Igf1r (padj = 5.71E-11) and human IGFIR transgene (padj = 5.65E-249) mRNA expression following mapping to a hybrid genome. (F) Heatmap showing differential expression of markers of AT2 and Club cells as well as subtypes of non-small cell lung cancer. ADC, adenocarcinoma, SCC, squamous cell carcinoma, mADC, mucinous adenocarcinoma. Adjusted p-values for (C) and (E) were obtained from DESeq2.
Fig 2
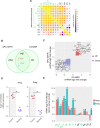
Fig 2. Comparative analysis of mouse models of lung cancer.
(A) Correlation matrix of log2 fold-changes (tumor vs normal) between the SPC-IGFIR model and mouse models of lung cancer. (B) Venn diagram and (C) scatterplot of log2 fold changes (tumor vs normal) between the SPC-IGFIR and C/L models. Only genes differentially expressed in the same direction in both the SPC-IGFIR models are plotted. (D) Dot plot of Areg and Ereg mRNA expression levels determined by qPCR (n = 5 for each group). Ereg, p <0.0001, Areg, p = 0.0004 by 2-tailed t-test. (E) Bar plot of Areg and Ereg log2 fold changes (tumor versus normal) derived from microarray datasets across multiple mouse models of lung cancer. Adenoma/adenocarcinoma (SI, SPC-IGFIR; C/L, CCSP-L858R; C/T, CCSP-T790M; C/L+T, CCSP-L858R+T790M, cR, cRaf1; M, SPC-Myc; U, Urethane; K, KrasLA2; S3, CCSP-Stat3C), Small cell lung cancer (RP, Rb/p53 DKO); Mucinous Adenocarcinoma (KN, KrasG12D/Nkx2.1+/-); Adenosquamous cell carcinoma (PS, Pten/Smad4 DKO); Squamous cell carcinoma (LP, Lkb1/Pten DKO).
Fig 3
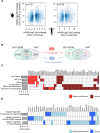
Fig 3. Cross-species analysis of gene expression profiles with human NSCLC.
(A) Smoothed scatterplots of log2 fold changes of genes differentially expressed in human lung ADC (tumor versus normal) (LUAD, n = 181; N, n = 20) and SCC (LUSC, n = 178; N, n = 59) with orthologous genes in the SPC-IGFIR model. ρ, spearman correlation coefficient (rho). (B) Venn diagrams illustrating the identification of genes with coordinated expression across IGFIR-driven and human lung ADC. (C) Bar chart with overrepresented gene ontology (GO) biological terms alongside a plot of corresponding genes up-regulated in mouse and/or human lung ADCs present within the ONGene and (D) TSG2.0 databases. ADC and LUAD, Adenocarcinoma; SCC and LUSC, squamous cell carcinoma.
Fig 4
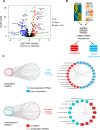
Fig 4. Integrated analysis of miRNA-mRNA expression in IGFIR-driven tumors.
(A) Volcano plot of log2 fold changes and differential expression p values of miRNAs between tumors from SPC-IGFIR mice and normal lung tissue. (B) Schematic of procedure used to identify miRNA:mRNA interaction pairs with oncogenic or tumor suppressive functions. The multiMiR database was used to identify ‘predicted’ and ‘validated’ miRNA targets followed by mining of the ONGene and TSG2.0 databases. (C) Regulatory networks of miRNA:mRNA interactions involving ‘validated’ target genes. The networks to the left illustrate all miRNA:mRNA interactions while those to the right highlight miRNA targets reported to have tumor suppressor or oncogenic activity.
Fig 5
Fig 5. Comparative miRNA analysis.
(A) Scatter plot of log2 fold changes of differentially expressed miRNAs in human ADC with conserved miRNAs in SPC-IGFIR mice. ρ, spearman’s correlation coefficient (rho). (B) Venn diagram illustrating overlap of differentially expressed miRNAs in human ADC and SPC-IGFIR mice. (C) Scatter plot of log2 fold changes of miRNAs differentially expressed in SPC-IGFIR mice and human ADC (n = 181 tumor, n = 20 normal). Up and downregulated miRNAs shared across species are highlighted in red and blue respectively. miRNAs highlighted in grey are altered only in one species. (D) Network diagram of ‘validated’ and (E) ‘predicted’ miRNA:mRNA interactions shared between SPC-IGFIR and human ADC. miRNA targets with reported oncogenic or tumor suppressor functions are highlighted.

References

    1. Siegel RL, Miller KD, Jemal A. Cancer statistics, 2015. CA Cancer J Clin. 2015;65: 5–29. 10.3322/caac.21254 - DOI - PubMed
    1. Travis WD, Brambilla E, Nicholson AG, Yatabe Y, Austin JHM, Beasley MB, et al. The 2015 World Health Organization Classification of Lung Tumors: Impact of Genetic, Clinical and Radiologic Advances Since the 2004 Classification. J Thorac Oncol. Elsevier; 2015;10: 1243–1260. 10.1097/JTO.0000000000000630 - DOI - PubMed
    1. Chen Z, Fillmore CM, Hammerman PS, Kim CF, Wong K-K. Non-small-cell lung cancers: a heterogeneous set of diseases. Nat Rev Cancer. 2014;14: 535–546. 10.1038/nrc3775 - DOI - PMC - PubMed
    1. Kwon M, Berns A. Mouse models for lung cancer. Mol Oncol. 2013;7: 165–177. 10.1016/j.molonc.2013.02.010 - DOI - PMC - PubMed
    1. Vikis HG, Rymaszewski AL, Tichelaar JW. Mouse models of chemically-induced lung carcinogenesis. Front Biosci (Elite Ed). 2013;5: 939–46. Available: http://www.ncbi.nlm.nih.gov/pubmed/23747909 - PubMed

Publication types