. 2018 Nov 20;49(5):857-872.e5.
doi: 10.1016/j.immuni.2018.09.010. Epub 2018 Nov 6.

Interleukin-17-Producing γδ T Cells Originate from SOX13+ Progenitors that Are Independent of γδTCR Signaling

Affiliations

Interleukin-17-Producing γδ T Cells Originate from SOX13+ Progenitors that Are Independent of γδTCR Signaling

Nicholas A Spidale et al. Immunity. .

Abstract

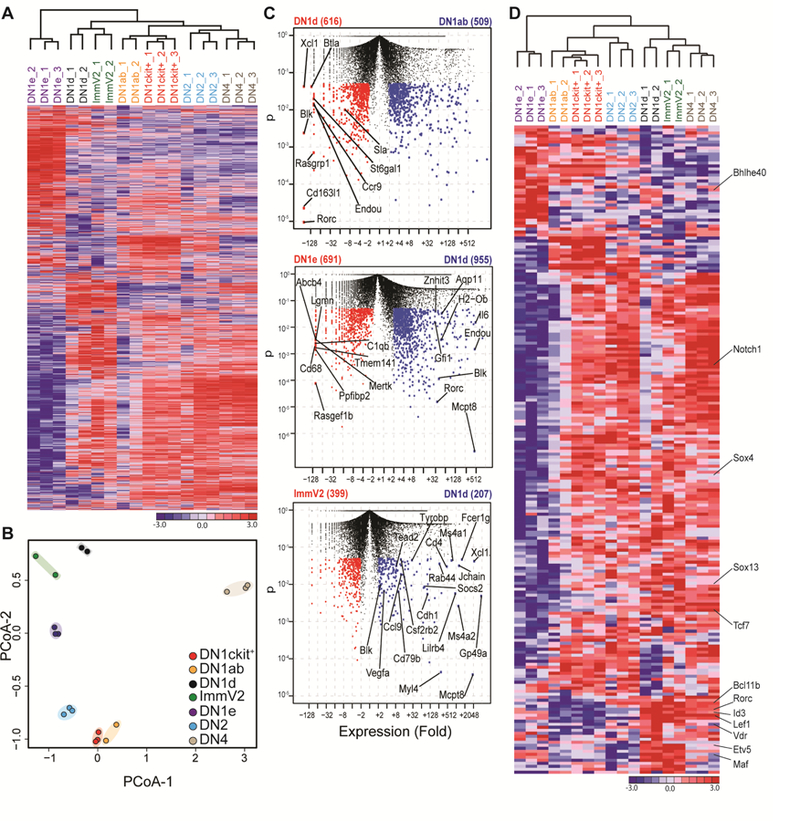
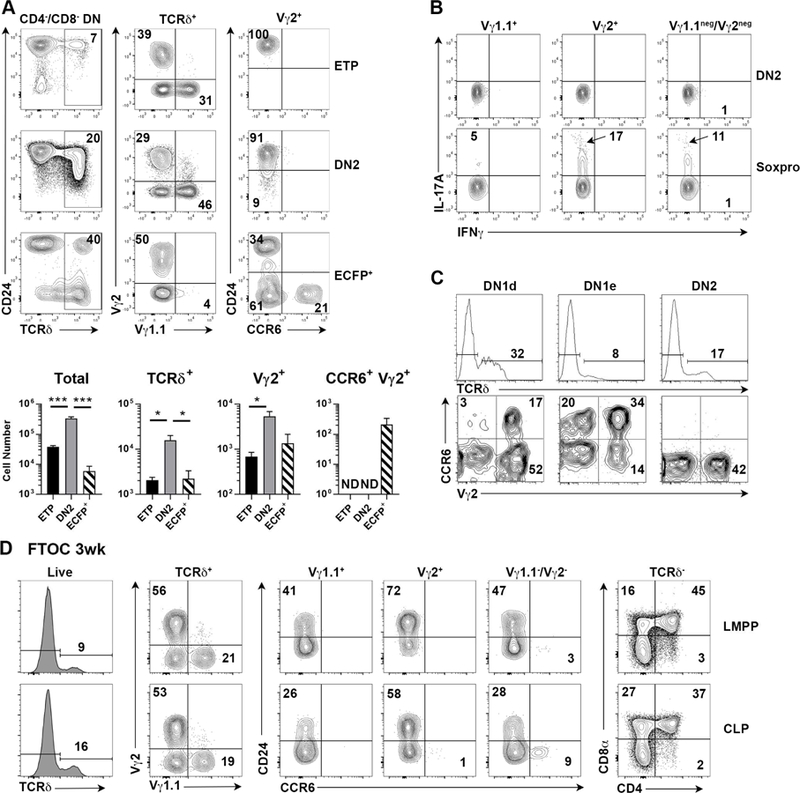
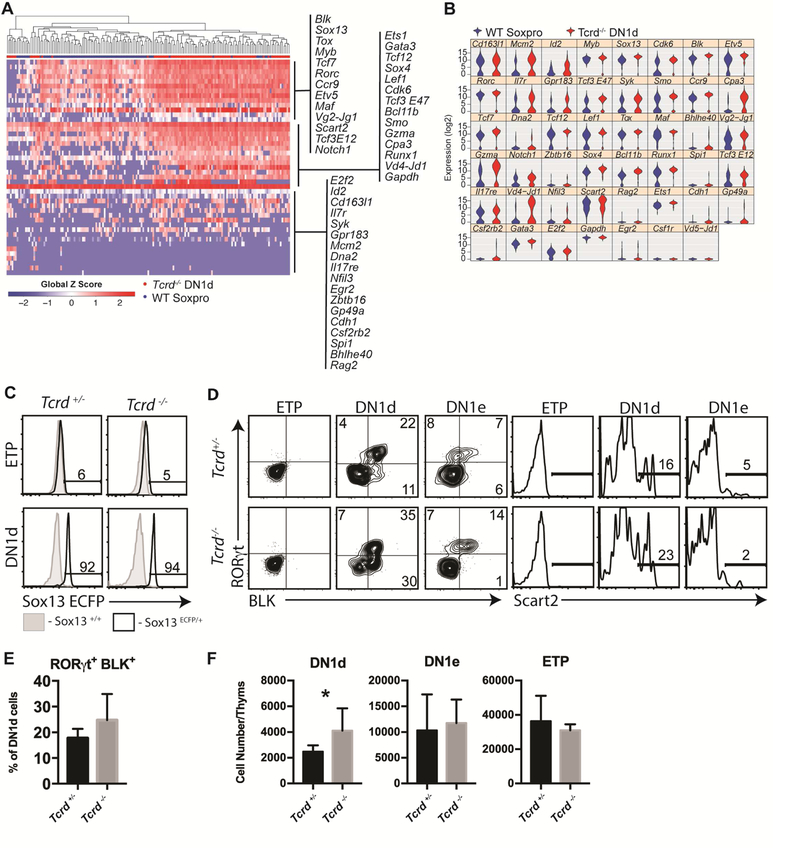
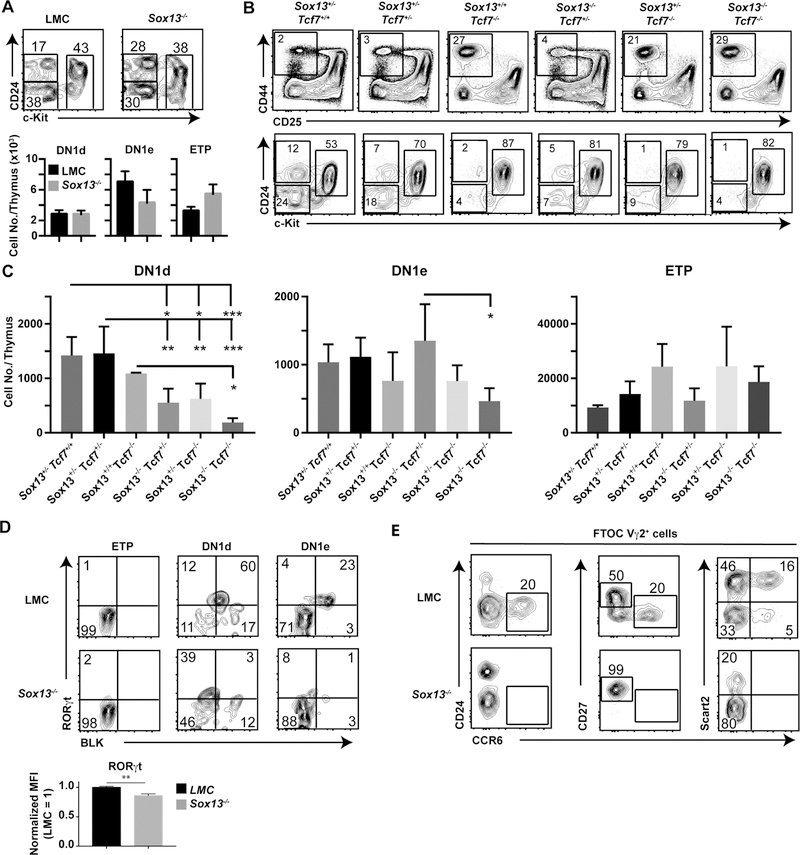
Lineage-committed αβ and γδ T cells are thought to originate from common intrathymic multipotent progenitors following instructive T cell receptor (TCR) signals. A subset of lymph node and mucosal Vγ2+ γδ T cells is programmed intrathymically to produce IL-17 (Tγδ17 cells), however the role of the γδTCR in development of these cells remains controversial. Here we generated reporter mice for the Tγδ17 lineage-defining transcription factor SOX13 and identified fetal-origin, intrathymic Sox13+ progenitors. In organ culture developmental assays, Tγδ17 cells derived primarily from Sox13+ progenitors, and not from other known lymphoid progenitors. Single cell transcriptome assays of the progenitors found in TCR-deficient mice demonstrated that Tγδ17 lineage programming was independent of γδTCR. Instead, generation of the lineage committed progenitors and Tγδ17 cells was controlled by TCF1 and SOX13. Thus, T lymphocyte lineage fate can be prewired cell-intrinsically and is not necessarily specified by clonal antigen receptor signals.

Keywords: IL-17; SOX13; T cell receptor; T cells; development; thymus; transcription factor.


Conflict of interest statement

Declaration of Interests

The authors declare no competing interests.

Figures

Figure 1.
Figure 1.. Identification and characterization of SOX13-ECFP expressing thymic progenitors.
(A) Expression of ECFP driven by the Sox13 promoter in DN subsets (bold black line) of 10 day (d10) old mice. Light gray plots indicate background fluorescence from DN subsets of non-reporter mice (Sox13-ECFP mice, n = 28). (B) Assessment of ECFP expression by DN1d cells from Sox13ECFP/+mice analyzed at the indicated embryonic day or time post-birth. (C) Representative DN1 subset distributions during ontogeny. (D) Expression of intranuclear RORγt, MAF, and BLK and surface Scart2 by DN1d and DN1e cells in thymuses of E18.5 fetuses. (E) Analysis of TCF1 and LEF1expression in E18.5 fetal thymocyte progenitors.
Figure 2.
Figure 2.. DN1d thymic progenitors exhibit molecular hallmarks of Tγδ17 cells.
(A) Thymocyte progenitor subsets were sorted from d7–10 old mice and subjected to RNA sequencing analysis. Hierarchical clustering and heat map rendering of differentially expressed genes (DEGs: >2-fold change and p-value < 0.05) from population-level RNA-Seq. (B) Principal coordinate analysis (PCoA) of indicated thymic progenitor subsets and immature Vγ2+ thymocytes (ImmV2), the immediate precursors to Vγ2+ Tγδ17 cells. (C) Pairwise comparisons of genes increased and decreased in expression (red, blue dots) in indicated subsets plotted as expression fold change versus p-value; numbers in brackets indicate transcripts significantly increased in expression by at least 2-fold and p< 0.05. (D) Hierarchical clustering and heat map rendering of differentially expressed transcription factors (p< 0.01) in indicated subsets.
Figure 3.
Figure 3.. Heterogeneity among DN1d cells identified by single-cell transcriptomics.
(A) Single-cell gene expression analysis of DN1d (four denoted clusters) and DN2 (clustered to far right) thymocytes from d7–10 old mice. Expression of 47 genes are visualized by hierarchical clustering and displayed by heat map rendering of global Z scores. Each column is expression profile of single cells and each row is a target gene, denoted on the right. The blue dot marks the row for Sox13. (B) Principle coordinate analysis (PCoA) of individual DN1d and DN2 cells in two dimensions. Boxed “Soxpro” cluster (n=83/223 total DN1d cells) contain DN1d cells with the Tγδ17 gene signature. (C) PCoA of genes that define cell clusters depicted in Panel B, with genes most strongly associated with the “Soxpro” DN1d cluster (low in PC2) indicated by gene symbol. (D)Violin plots of 47 genes analyzed.
Figure 4.
Figure 4.. Soxpro cells generate Tγδ17.
(A) Thymic lobes were seeded with ETP, DN2, or Sox13-ECFP+ DN1d cells sorted from d7–10 old Sox13ecfp/= mice and then cultured for 7 days before analysis. Two to four repopulated lobes were pooled for analyses. Summary data combines three hFTOC experiments analyzed at 7–8 d of culture. *, p<.05; ***, p<.001 by one-way ANOVA with Turkey’s multiple comparisons test. ND, not detected. (B) DN2 or total DN1d progenitor cells were sorted from d7–10 old WT B6 thymi, used to repopulate alymphoid fetal thymic lobes by hanging drop culture, and then cultured under standard hFTOC conditions. After 1 wk of hFTOC culture, cells were stimulated with PMA and Ionomycin to assess production of IL-17A and IFNγ. Gates for cytokine+ cells were based on non-stimulated controls stained with anti-cytokine Abs. Data are pooled from 6 lobes. (C) Developmental potential of indicated precursor subsets sorted from d7–10 old Tcrb−/− mice was assessed on OP9-DLL1 stromal cells. Top row is gated on total live cells and bottom row is gated on TCRδ+ cells. Data are representative of one of three experiments. (D) Fetal liver progenitors from E13.5 embryos were sorted and used to repopulate hFTOC lobes. Analyses shown were performed on d20 of culture. Quadrants without an inset number indicate <1% cells. Data are representative of 2 experiments.
Figure 5.
Figure 5.. DN1d cell generation is independent of maximal TCR signaling or RAG.
(A) DN1 subsets from d7–10 old mice of the indicated genotypes were analyzed by FACS. Data are from one of three independent experiments. (Tcrd−/− N = 11 mice, Tcrb−/− N = 8). (B) DN1 subset analysis from 6 weeks old WT B6 or 6F/6F mice. (C) Representative intranuclear staining for RORγt and BLK in ETP and DN1d cells from 6wk old WT B6 and 6F/6F mice. (D) Summary of total DN1d cell numbers and RORγt+ BLK+ DN1d cell numbers in 2wk old and 6wk old WT and 6F/6F mice. 6wk n=16 (WT) or 18 (6F/6F); 2wk n=6 each. (E) Analysis of Rag1−/− DN1 subsets from E16.5, 17.5, and 18.5 fetuses and <24h old Neonates (Neo), top to bottom row, respectively. E16.5 n=3 (WT) or 5 (−/−); E17.5 n=10 (WT) or 8 (−/−); E18.5 n=8 (WT) or 7 (−/−); Neo n=4 each. * p<.05, ** p<.01, *** p<.001 by unpaired t-test. (F) FACS analysis of RORγt, BLK, and Scart2 expression by DN1 subsets of E18.5 Rag1−/− mice. Data are representative of 3 independent experiments. (G) Neonatal (<48h old) Rag1−/−c-Kitneg DN1 progenitors were sorted and analyzed by single-cell qPCR. Rag1−/− cells were segregated into Sox13+ (n=25) and Sox13 (n=198) cells and then compared against WT Soxpro from Figure 3 via hierarchical clustering. (H) Violin plot analysis of gene expression of cells from Panel F.
Figure 6.
Figure 6.. γδTCR is dispensable for DN1d cell generation and Tγδ17 gene programming.
(A) DN1d cells from d7–10 old Tcrd−/− thymi were sorted and analyzed by single-cell qPCR (n=86). Data are visualized by hierarchical clustering and displayed by heat map rendering of global Z scores and compared to WT Soxpro from Figure 3. (B) Violin plot of single-cell qPCR data presented in Panel A. Note that Tcrd−/− mice are deficient in the constant region, but do not exhibit any deficiencies in VDJ rearrangement. (C) Sox13-ECFP reporter signal was assessed in ETP or DN1d cells from Tcrd+/−Sox13 ecfp/+ and Tcrd−/−Sox13ecfp/+ littermates. Histograms are representative of 6 Tcrd+/−Sox13 ecfp/+ mice analyzed across three independent experiments. (D) Analysis of Scart2, RORγt, and BLK expression by DN1 progenitors from Tcrd−/− mice. (E) Summary data of n=4 mice assessed in Panel D. Data are from 1 of 3 representative experiments. (F) Enumeration of total DN1d cells, DN1e cells, and ETP cells isolated per thymus from Tcrd+/− or Tcrd−/− mice. n=5 (+/−) or 7 (−/−) pooled from 2 independent experiments. *, p<.05 by unpaired t test.
Figure 7.
Figure 7.. HMG TFs regulate DN1d and Tγδ17 functional programming.
(A) Analysis of DN1 progenitor distribution in d7–10 old littermate control 129.Sox13+/− (LMC) and 129.Sox13−/− mice (N=9 each). (B) Representative DN subset profiles (Top) and DN1 subset distributions (Bottom) in neonatal mice (<48h old) lacking Sox13 and Tcf7. Analysis was performed in neonates prior to ectopic activation of T cells observed in young Tcf7−/− mice. (C) Summary of analysis performed in Panel B. Sox13+/−Tcf7+/+ n=4, Sox13+/−Tcf7+/− n=5, Sox13+/+Tcf7−/− n=2, Sox13−/−Tcf7+/− n=4, Sox13+/−Tcf7−/− n=5, Sox13−/−Tcf7−/− n=4 pooled from 2 independent experiments. * p<.05, ** p<.01, *** p<.001 by one-way ANOVA with Turkey’s multiple comparisons test. (D) Representative RORγt+BLK+ intracellular profiles in mice (d7–10 old) deficient for SOX13. Summary data n=6 (LMC) or7 (−/−) from 2 independent experiments expressed as “normalized MFI” in which LMC mice were normalized to 1 to permit comparison across experiments. **, p<.01 by unpaired t test. (E) Differentiation of DN1d cells sorted from d7–10 old LMC or Sox13−/− mice in hFTOC analyzed at d7 of culture. Shown are phenotypes of Vγ2+ T cells. Data are representative of three independent experiments. Quadrants and gates without an inset number indicate <1% cells in gate.

References

    1. Bando JK, Liang HE, and Locksley RM (2015). Identification and distribution of developing innate lymphoid cells in the fetal mouse intestine. Nature immunology 16, 153–160. - PMC - PubMed
    1. Benz C, Martins VC, Radtke F, and Bleul CC (2008). The stream of precursors that colonizes the thymus proceeds selectively through the early T lineage precursor stage of T cell development. J Exp Med 205, 1187–1199. - PMC - PubMed
    1. Boiers C, Carrelha J, Lutteropp M, Luc S, Green JC, Azzoni E, Woll PS, Mead AJ, Hultquist A,Swiers G, et al. (2013). Lymphomyeloid contribution of an immune-restricted progenitor emerging prior to definitive hematopoietic stem cells. Cell stem cell 13, 535–548. - PubMed
    1. Buus TB, Odum N, Geisler C, and Lauritsen JPH (2017). Three distinct developmental pathways for adaptive and two IFN-gamma-producing gammadelta T subsets in adult thymus. Nat Commun 8, 1911. - PMC - PubMed
    1. Cai Y, Shen X, Ding C, Qi C, Li K, Li X, Jala VR, Zhang HG, Wang T, Zheng J, and Yan J(2011). Pivotal role of dermal IL-17-producing gammadelta T cells in skin inflammation. Immunity 35, 596–610. - PMC - PubMed

Publication types