. 2018 Nov 9;145(21):dev167833.
doi: 10.1242/dev.167833.

Single cell transcriptome analysis of human, marmoset and mouse embryos reveals common and divergent features of preimplantation development

Affiliations

Single cell transcriptome analysis of human, marmoset and mouse embryos reveals common and divergent features of preimplantation development

Thorsten Boroviak et al. Development. .

Abstract

The mouse embryo is the canonical model for mammalian preimplantation development. Recent advances in single cell profiling allow detailed analysis of embryogenesis in other eutherian species, including human, to distinguish conserved from divergent regulatory programs and signalling pathways in the rodent paradigm. Here, we identify and compare transcriptional features of human, marmoset and mouse embryos by single cell RNA-seq. Zygotic genome activation correlates with the presence of polycomb repressive complexes in all three species, while ribosome biogenesis emerges as a predominant attribute in primate embryos, supporting prolonged translation of maternally deposited RNAs. We find that transposable element expression signatures are species, stage and lineage specific. The pluripotency network in the primate epiblast lacks certain regulators that are operative in mouse, but encompasses WNT components and genes associated with trophoblast specification. Sequential activation of GATA6, SOX17 and GATA4 markers of primitive endoderm identity is conserved in primates. Unexpectedly, OTX2 is also associated with primitive endoderm specification in human and non-human primate blastocysts. Our cross-species analysis demarcates both conserved and primate-specific features of preimplantation development, and underscores the molecular adaptability of early mammalian embryogenesis.

Keywords: Blastocyst; Embryo; Human; Inner cell mass; Pluripotency; Primate.


Conflict of interest statement

Competing interestsThe authors declare no competing or financial interests.

Figures

Fig. 1.
Fig. 1.
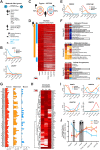
Global analysis of human, marmoset and mouse preimplantation stages. (A) Summary of single-cell RNA-seq data considered in this study. Individual transcriptome numbers are indicated for each developmental stage. MYA, million years. (B) Phase-contrast images of marmoset embryos processed for transcriptional profiling. (C-E) PCA of single cell embryo data for each species (FPKM>0). (F) Pearson correlation distance of preimplantation stages of human (red), marmoset (orange) and mouse (blue), with stages indicated below as in C. (G-I) Mutual information entropy between preimplantation stages.
Fig. 2.
Fig. 2.
Cross-species analysis of maternal gene transcripts. (A) Schematic of mouse maternal effect genes according to Kim and Lee (2014). Symbols indicate transcripts present in the relevant species (FPKM>10). (B) Mouse-specific maternal genes in FPKM. (C) Intersection of maternal transcripts in human, marmoset and mouse zygotes (FPKM>10). (D) Maternal human transcripts (FPKM>10), conserved in marmoset (orange) and mouse (blue). (E) Primate-specific maternal genes in FPKM. (F) GO and pathway significance (−log10 P-value) ranked according to the top 10 processes statistically enriched in human. (G) Ribosomal transcripts in FPKM. (H) One-way hierarchical clustering of chromatin remodellers in at least one species (FPKM>20). (I) DNA methyltransferases in FPKM. (J) Combined Z-score of PRC1 and PRC2 components over developmental time.
Fig. 3.
Fig. 3.
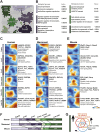
Stage-specific expression modules of preimplantation development. (A) Self-organizing map (SOM) of developmental stages from marmoset data. Stage-specific clusters (Z-score>1.5) are indicated by colour. (B) Enriched biological processes for specific SOM clusters. (C-E) SOM of human, marmoset and mouse stages, selected transcription factors and significantly enriched (P<0.05) KEGG pathways. (F) Numbers of stage-specific genes in each species. (G) Significantly enriched (P<0.05) biological processes at the late ICM stage.
Fig. 4.
Fig. 4.
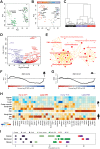
The second lineage decision in the marmoset. (A) PCA of marmoset samples from compacted morula, early and late ICM stages (FPKM>0). (B) PCA based on variable genes (log2FPKM>0, logCV2>0.5, n=3363) for the marmoset late ICM. (C) Weighted gene co-expression network analysis (WGCNA) represented as clusters of eigengene values for early and late ICM. (D) Genes differentially expressed between marmoset EPI (red) and PrE (purple). (E) Cytoscape enrichment map of the top 50 biological processes (P>0.05) based on absolute fold change >0.5 between PrE and EPI. (F,G) Gene set enrichment analysis (GSEA) based on genes differentially expressed between (F) human and marmoset, and (G) human and mouse EPI versus PrE. (H) Representative early and late EPI and PrE markers in marmoset and human. (I) Pseudotime analysis of human, marmoset and mouse embryonic lineages.
Fig. 5.
Fig. 5.
The transposcriptome in preimplantation development. (A-C) PCA of selected transposable elements (log2 normalised count>0.5 and logCV2>1) expressed in human (A), marmoset (B) and mouse (C). (D) Numbers of stage-specific transposable elements for all preimplantation stages (for individual elements=Z-score>2 and normalised read counts>10). (E) Top 1000 stage-specific transcripts in human. Pie charts indicate proportions of the 10 most abundant classes for the top 1000 stage-specific transposable elements. Bar charts display counts for the 10 most abundant families encompassing the top 1000 stage-specific elements. (F,G) Most abundant retrotransposon families for the top 1000 stage-specific transcripts in marmoset (F) and mouse (G) as defined in Table S7.
Fig. 6.
Fig. 6.
Conserved and divergent elements of EPI and PrE transcription factor networks. (A) Intersection of transcription factors specific to EPI [FPKM>5 in EPI and not significantly (P>0.05) upregulated in PrE]. (B) Protein-protein interaction network of primate-specific EPI transcription factors. Node sizes are scaled to normalised expression in human and marmoset; edges are derived from the STRING database. (C) EPI-enriched transcription factors (circles) and chromatin remodelling factors (squares). Axes show the relative fraction of expression in the EPI between mouse and human (x), human and marmoset (y), and marmoset and mouse (z). (D) Selected markers representing normalised expression in ICM, EPI and PrE. (E) Sequentially activated canonical mouse PrE markers expressed in mouse (blue), marmoset (orange) and human (red). (F) Protein-protein interaction network of primate-specific PrE transcription factors [FPKM>5 in PrE and not significantly (P>0.05) upregulated in EPI]. As in B, node sizes are scaled to normalised expression in human and marmoset and edges are derived from the STRING database.
Fig. 7.
Fig. 7.
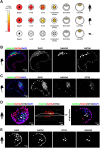
OTX2 protein localisation in primate embryos. (A) Schematic of Otx2 expression over preimplantation development. (B,C) Confocal microscopy immunofluorescence images of (B) NANOG, GATA6 and DAPI, and (C) NANOG, OTX2 and DAPI in marmoset late blastocysts. (D) Confocal sections, 3D reconstruction and single-plane image of NANOG, GATA2, OTX2 and DAPI localisation in an early human blastocyst. (E) Confocal sections of the indicated markers in a representative late human blastocyst. White arrowheads indicate PrE cells.

References

    1. Acampora D., Di Giovannantonio L. G. and Simeone A. (2013). Otx2 is an intrinsic determinant of the embryonic stem cell state and is required for transition to a stable epiblast stem cell condition. Development 140, 43-55. 10.1242/dev.085290 - DOI - PubMed
    1. Acampora D., Omodei D., Petrosino G., Garofalo A., Savarese M., Nigro V., Di Giovannantonio L. G., Mercadante V. and Simeone A. (2016). Loss of the Otx2-binding site in the Nanog promoter affects the integrity of embryonic stem cell subtypes and specification of inner cell mass-derived epiblast. Cell Rep. 15, 2651-2664. 10.1016/j.celrep.2016.05.041 - DOI - PubMed
    1. Akagi T., Kuure S., Uranishi K., Koide H., Costantini F. and Yokota T. (2015). ETS-related transcription factors ETV4 and ETV5 are involved in proliferation and induction of differentiation-associated genes in embryonic stem (ES) cells. J. Biol. Chem. 290, 22460-22473. 10.1074/jbc.M115.675595 - DOI - PMC - PubMed
    1. Anders S., Pyl P. T. and Huber W. (2015). HTSeq–a Python framework to work with high-throughput sequencing data. Bioinformatics 31, 166-169. 10.1093/bioinformatics/btu638 - DOI - PMC - PubMed
    1. Arnold S. J. and Robertson E. J. (2009). Making a commitment: cell lineage allocation and axis patterning in the early mouse embryo. Nat. Rev. Mol. Cell Biol. 10, 91-103. 10.1038/nrm2618 - DOI - PubMed

Publication types

MeSH terms