. 2018 Nov 27;115(48):12170-12175.
doi: 10.1073/pnas.1807988115. Epub 2018 Nov 9.

Genome-wide RNA structurome reprogramming by acute heat shock globally regulates mRNA abundance

Affiliations

Genome-wide RNA structurome reprogramming by acute heat shock globally regulates mRNA abundance

Zhao Su et al. Proc Natl Acad Sci U S A. .

Abstract

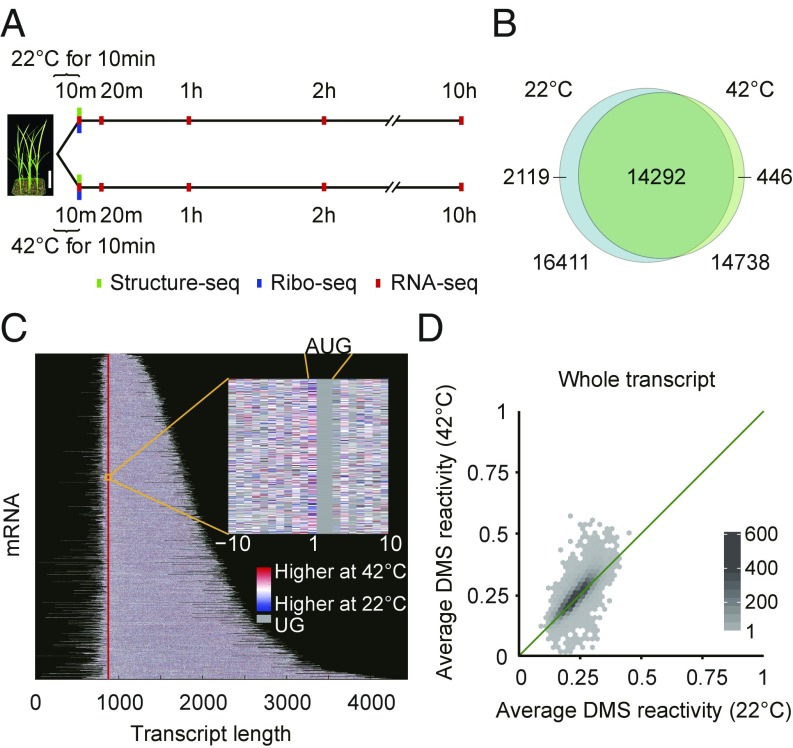
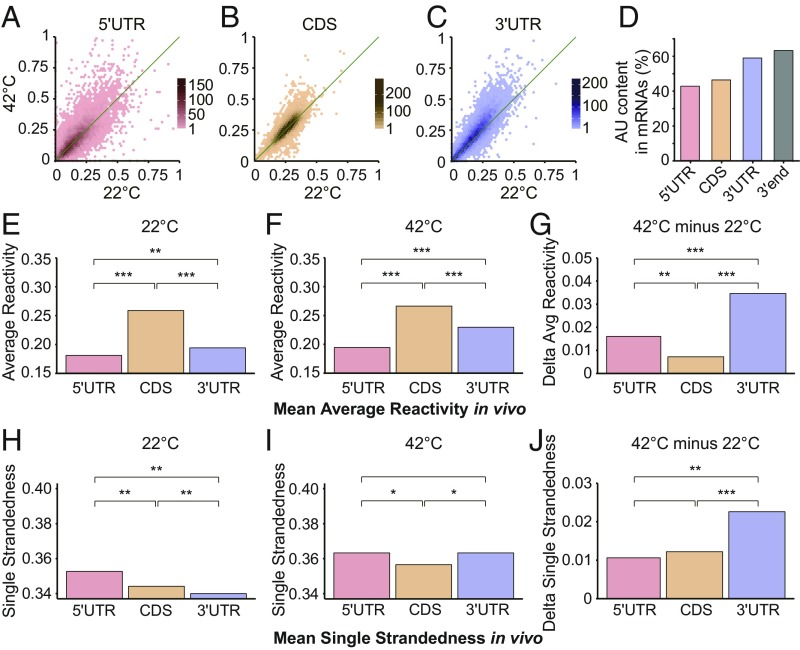
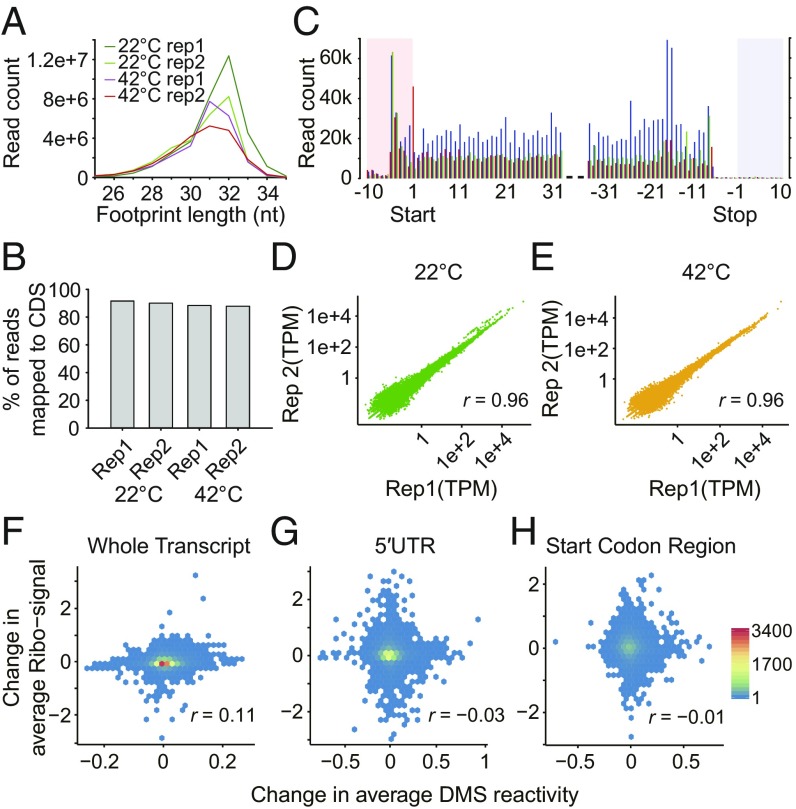
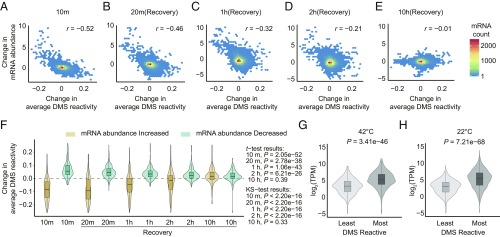
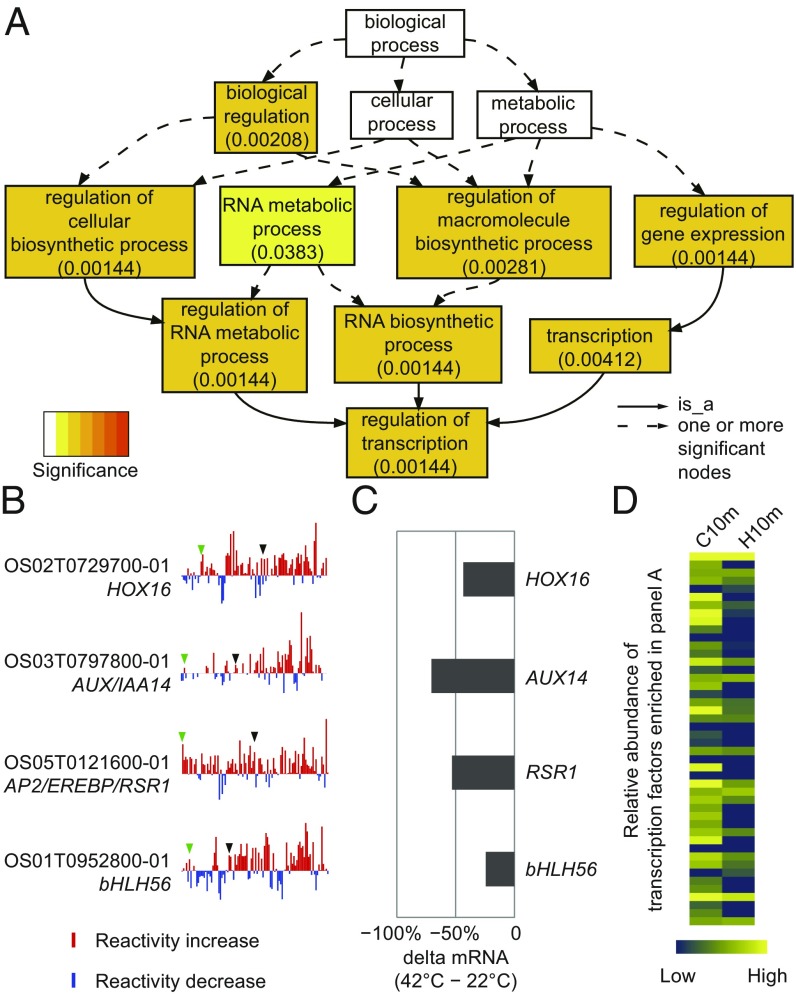
The heat shock response is crucial for organism survival in natural environments. RNA structure is known to influence numerous processes related to gene expression, but there have been few studies on the global RNA structurome as it prevails in vivo. Moreover, how heat shock rapidly affects RNA structure genome-wide in living systems remains unknown. We report here in vivo heat-regulated RNA structuromes. We applied Structure-seq chemical [dimethyl sulfate (DMS)] structure probing to rice (Oryza sativa L.) seedlings with and without 10 min of 42 °C heat shock and obtained structural data on >14,000 mRNAs. We show that RNA secondary structure broadly regulates gene expression in response to heat shock in this essential crop species. Our results indicate significant heat-induced elevation of DMS reactivity in the global transcriptome, revealing RNA unfolding over this biological temperature range. Our parallel Ribo-seq analysis provides no evidence for a correlation between RNA unfolding and heat-induced changes in translation, in contrast to the paradigm established in prokaryotes, wherein melting of RNA thermometers promotes translation. Instead, we find that heat-induced DMS reactivity increases correlate with significant decreases in transcript abundance, as quantified from an RNA-seq time course, indicating that mRNA unfolding promotes transcript degradation. The mechanistic basis for this outcome appears to be mRNA unfolding at both 5' and 3'-UTRs that facilitates access to the RNA degradation machinery. Our results thus reveal unexpected paradigms governing RNA structural changes and the eukaryotic RNA life cycle.

Keywords: RNA thermometer; RNA-seq; Structure-seq; heat shock; rice.


Conflict of interest statement

The authors declare no conflict of interest.

Figures

Fig. 1.
Fig. 1.
Experimental design and Structure-seq library statistics. (A) Timeline of Structure-seq (green), Ribo-seq (blue), and RNA-seq (red) experiments. [Scale bar (white) for rice seedlings, 4 cm.] (B) Overlap of mRNAs with sufficient structure-probing coverage between 22 °C (blue) and 42 °C (green). (C) Heat stress-induced structural reactivity changes across the rice mRNA structurome. Each horizontal line represents a different mRNA. Reactivity information is obtained at single nucleotide resolution (Inset). Vertical line (red) marks start codon. (D) Average DMS reactivity is significantly greater at 42 °C than 22 °C (whole transcripts; P = 5.27 × 10−77; r = 0.82). [Scale bar (gradient), numbers of RNAs.] In the analyses of C and D, only transcripts with sufficient Structure-seq coverage under both temperature conditions are shown and used.
Fig. 2.
Fig. 2.
Average DMS reactivity is higher on all mRNA regions at elevated temperature. Average DMS reactivity is significantly greater at 42 °C for all mRNA subregions. (A) 5′UTR (P = 4.00 × 10⁻¹⁸; r = 0.74). (B) CDS (P = 8.08 × 10⁻¹²; r = 0.83). (C) 3′UTR (P = 2.24 × 10−89; r = 0.87). DMS reactivities on whole transcripts were cross-normalized between temperatures to correct for the higher chemical reactivity of DMS at higher temperature (SI Appendix, Materials and Methods). [Scale bars (gradient) in AC, numbers of mRNAs.] (D) Average AU content is significantly greater in 3′UTRs than in 5′UTRs or CDS, especially at the 3′ end (last 100 nt). (E and F) Mean of the average DMS reactivity at 22 °C (E) and 42 °C (F) in the 5′UTR, CDS, 3′UTR regions. (G) Change in average DMS reactivity (42 °C − 22 °C) in the 5′UTR, CDS, and 3′UTR regions. (H and I) Mean of single strandedness at 22 °C (H) and 42 °C (I) in the 5′UTR, CDS, 3′UTR regions. Here, single-strandedness is the percentage of single-stranded nucleotides in the RNA structure predicted with in vivo restraints. (J) Change in average single strandedness (42 °C − 22 °C) in the 5′UTR, CDS, 3′UTR regions. In the analyses of AJ, only transcripts with sufficient Structure-seq coverage under both temperature conditions were used. In EJ, *P < 0.01; **P < 10−10; ***P < 10−50, respectively. Specific P values for each comparison are provided in SI Appendix, Table S2.
Fig. 3.
Fig. 3.
Ribo-seq data statistics and absence of correlations between temperature-induced changes in DMS reactivity and in the translatome. (A) Distribution of sequence read length of Ribo-seq data, peaking at 30–32 nucleotides, as expected for ribosome footprinting. (B) Percentage of mRNA-mapped Ribo-seq reads that map to the CDS. (C) Distribution of sequence read count around start codon and stop codon. Shown are 32-nt reads as the example; reading frames are shown in red (first position), blue (second position), and green (third position), and UTRs are highlighted in pink and gray. (D and E) High correlation of transcript abundance between replicates of Ribo-seq libraries. Transcript abundance was calculated as TPM (transcripts per million). (D) 22 °C. (E) 42 °C. (FH) No correlation detected between the change in average DMS reactivity (42 °C − 22 °C) and change in Ribo-seq signal (42 °C − 22 °C) for (F) whole transcripts (n = 14,197). (G) 5′UTR (n = 9,895), (H) start codon region (−50 nt to +50 nt; n = 8,726). n, number of candidates with both sufficient coverage in Structure-seq and presence in Ribo-seq datasets.
Fig. 4.
Fig. 4.
Strong negative correlation between heat-shock-induced DMS reactivity change and heat-shock-induced mRNA abundance (TPM) change that gradually dissipates after heat shock. (AE) Change of average DMS reactivity (42 °C − 22 °C) from Structure-seq (all 10 min) vs. fold change (log2) in mRNA abundance (42 °C − 22 °C) from RNA-seq (see Fig. 1A for time course), calculated on all mRNAs with sufficient Structure-seq coverage. (A) 10 min (= end of 42 °C treatment), (B) 20 min, (C) 1 h, (D) 2 h, (E) 10 h. (F) Distribution of change in average DMS reactivity of all transcripts with sufficient Structure-seq coverage within the top 5% of mRNAs with increased abundance (beige) and the bottom 5% of mRNAs with decreased abundance (blue). (G and H) The abundance of degradome fragments of the top/bottom 5% most/least DMS reactive transcripts at (G) 42 °C and (H) 22 °C is compared, showing that more reactive transcripts have a higher mean number of degradome fragments.
Fig. 5.
Fig. 5.
Gene ontology analysis uncovers enrichment of transcription factors in mRNAs with the greatest heat-induced DMS reactivity increases. (A) Enrichment of gene ontology functional categories in the 5% of mRNAs with most elevated DMS reactivity at 42 °C. (B) DMS reactivity profiles for four transcription factors in the “regulation of transcription” category; these show dramatic heat-induced increase in DMS reactivity. For visualization, reactivity differences (42 °C − 22 °C) on all nucleotides in a transcript were placed into 100 bins and averaged within each bin. Green and black arrowheads point to the end of 5′UTR and the start of 3′UTR, respectively. (C) Heat-promoted mRNA decay. Loss in mRNA abundance at 10 min in the presence of cordycepin (42 °C – 22 °C). (D) Transcription factors in the top 5% of transcripts with elevated mRNA DMS reactivity after 10 min of 42 °C heat shock (H10m) show decreased abundance after 10 min heat shock (RNA-seq analysis). Blue and yellow indicate low and high abundance, respectively (SI Appendix, Fig. S11 provides the corresponding RNA-seq heat map at other timepoints).

References

    1. Bita CE, Gerats T. Plant tolerance to high temperature in a changing environment: Scientific fundamentals and production of heat stress-tolerant crops. Front Plant Sci. 2013;4:273. - PMC - PubMed
    1. Battisti DS, Naylor RL. Historical warnings of future food insecurity with unprecedented seasonal heat. Science. 2009;323:240–244. - PubMed
    1. Peng S, et al. Rice yields decline with higher night temperature from global warming. Proc Natl Acad Sci USA. 2004;101:9971–9975. - PMC - PubMed
    1. Zhao C, et al. Temperature increase reduces global yields of major crops in four independent estimates. Proc Natl Acad Sci USA. 2017;114:9326–9331. - PMC - PubMed
    1. Kosová K, Vítámvás P, Prášil IT, Renaut J. Plant proteome changes under abiotic stress–Contribution of proteomics studies to understanding plant stress response. J Proteomics. 2011;74:1301–1322. - PubMed

Publication types