. 2018 Nov 27;115(48):E11388-E11396.
doi: 10.1073/pnas.1808609115. Epub 2018 Nov 9.

Klotho controls the brain-immune system interface in the choroid plexus

Affiliations

Klotho controls the brain-immune system interface in the choroid plexus

Lei Zhu et al. Proc Natl Acad Sci U S A. .

Abstract

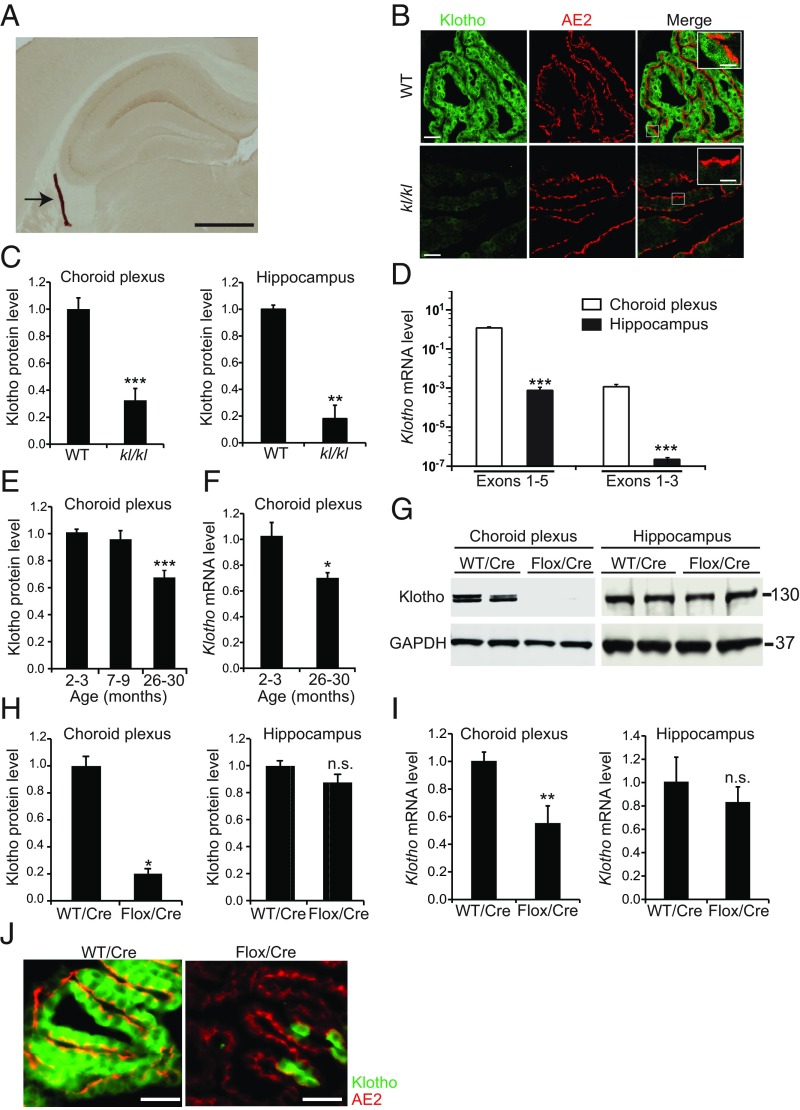
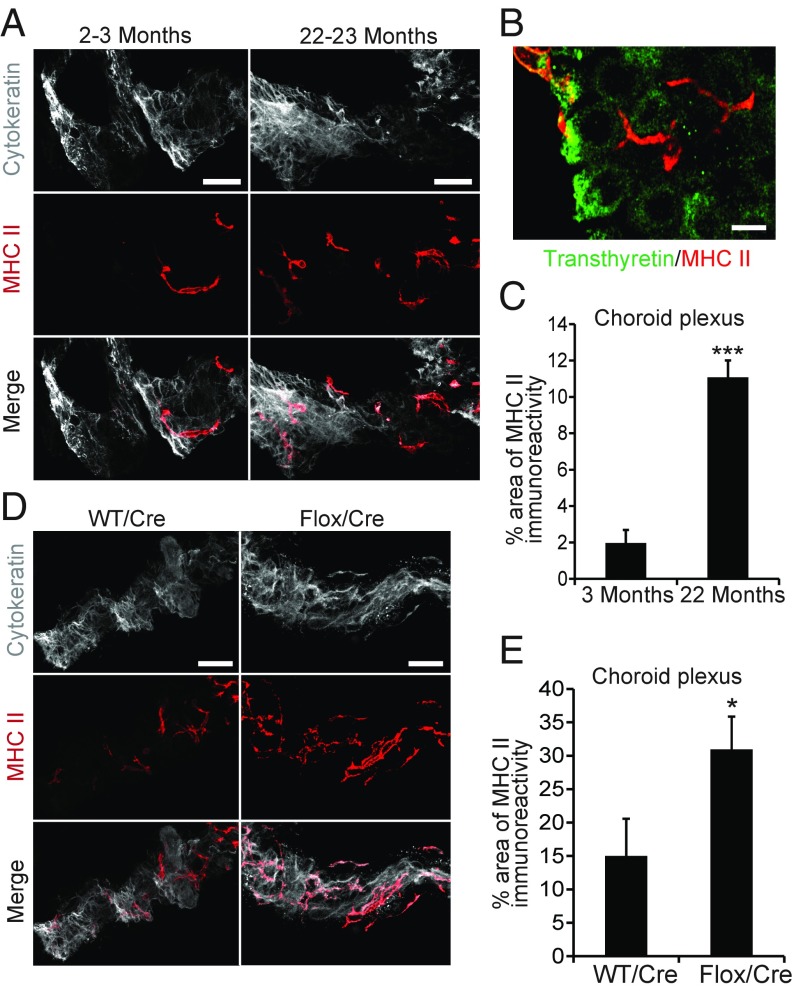
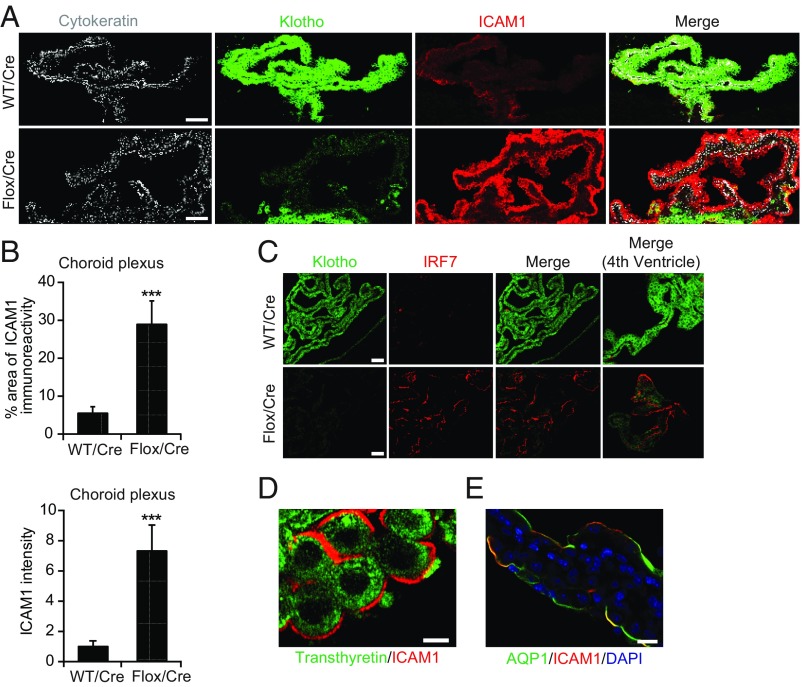
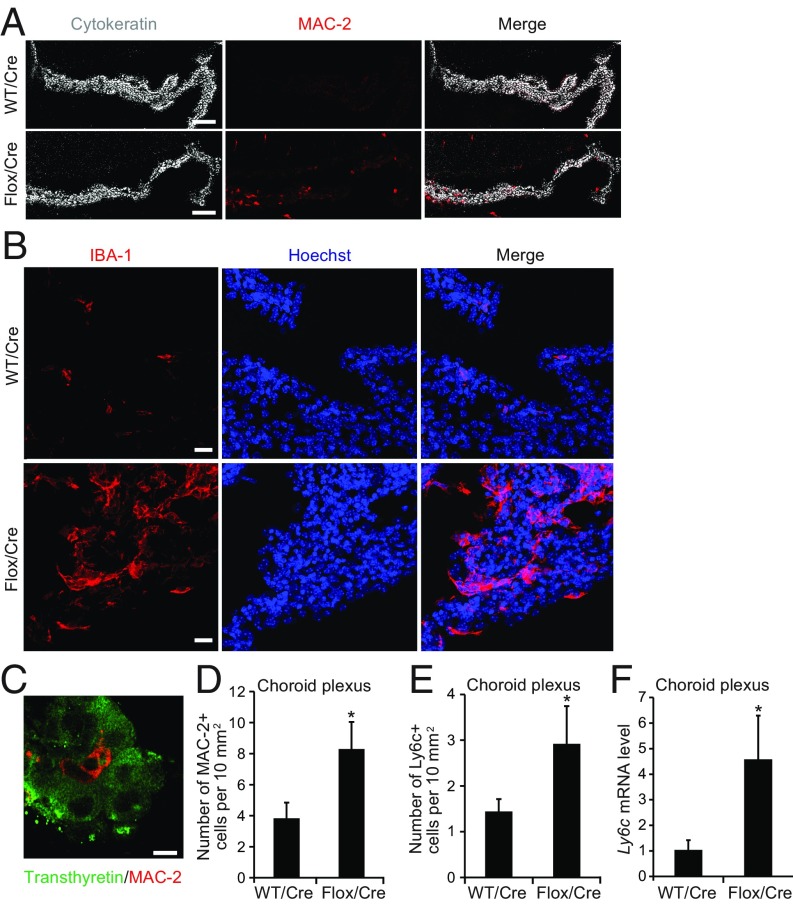
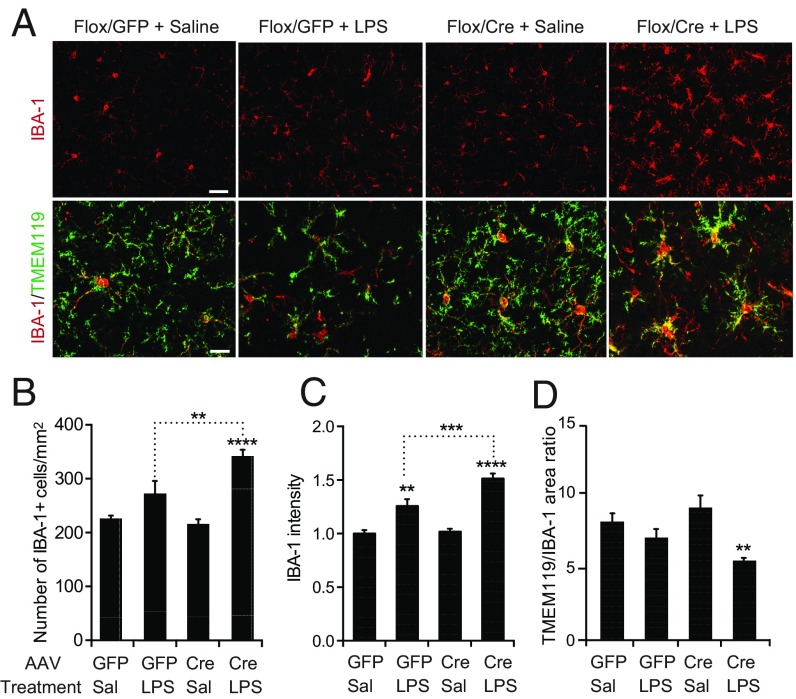
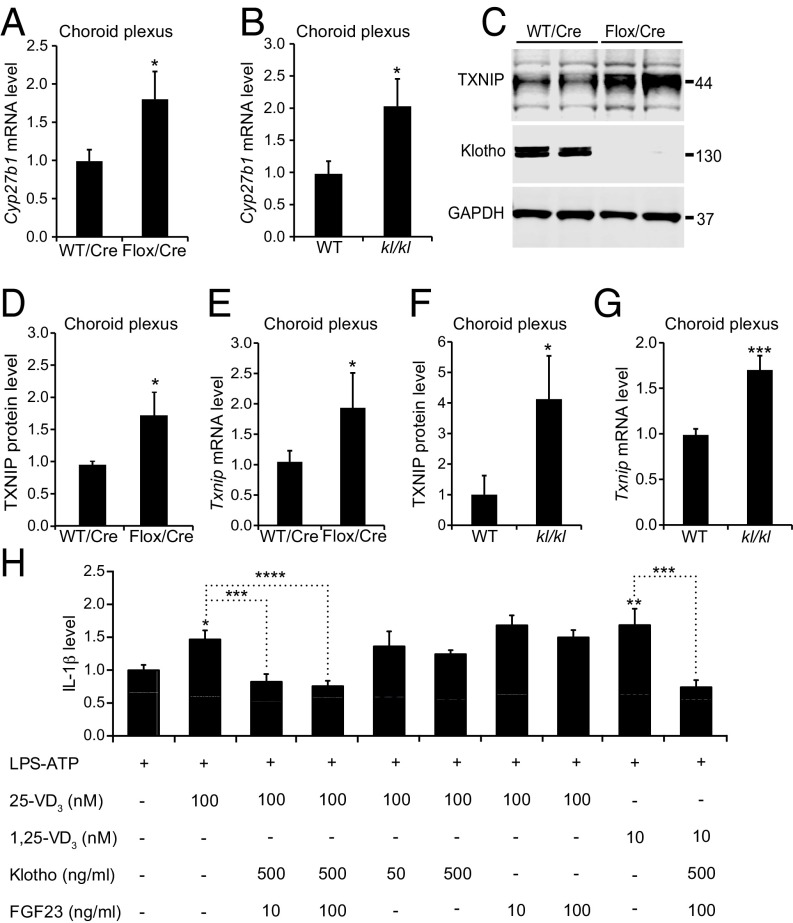
Located within the brain's ventricles, the choroid plexus produces cerebrospinal fluid and forms an important barrier between the central nervous system and the blood. For unknown reasons, the choroid plexus produces high levels of the protein klotho. Here, we show that these levels naturally decline with aging. Depleting klotho selectively from the choroid plexus via targeted viral vector-induced knockout in Klothoflox/flox mice increased the expression of multiple proinflammatory factors and triggered macrophage infiltration of this structure in young mice, simulating changes in unmanipulated old mice. Wild-type mice infected with the same Cre recombinase-expressing virus did not show such alterations. Experimental depletion of klotho from the choroid plexus enhanced microglial activation in the hippocampus after peripheral injection of mice with lipopolysaccharide. In primary cultures, klotho suppressed thioredoxin-interacting protein-dependent activation of the NLRP3 inflammasome in macrophages by enhancing fibroblast growth factor 23 signaling. We conclude that klotho functions as a gatekeeper at the interface between the brain and immune system in the choroid plexus. Klotho depletion in aging or disease may weaken this barrier and promote immune-mediated neuropathogenesis.

Keywords: aging; choroid plexus; inflammation; klotho; macrophage.


Conflict of interest statement

The authors declare no conflict of interest.

Figures

Fig. 1.
Fig. 1.
Klotho depletion in the CP caused by aging or experimental manipulation. (A) CP (arrow) in the lateral ventricle of a 4-mo-old WT mouse visualized by klotho immunostaining of a coronal brain section. (B) Images of confocal optical sections of CPs in the lateral ventricles of 4-mo-old WT and kl/kl mice immunostained for klotho (green) and for the CP marker protein anion exchanger 2 (AE2). [Scale bars: 500 µm (A), 60 µm (B), 20 µm (B, Inset).] (C) Relative klotho levels in 2-mo-old mice (C, E, and H) were measured by Western blotting, normalized to GAPDH levels, and expressed relative to mean levels in WT controls. Relative Klotho mRNA levels (F and I) were calculated by the 2–∆∆CT method (75) using Gapdh mRNA as the internal reference and WT mice as the control. n = 11 to12 (CP) or 3 to 4 (hippocampus) mice per genotype. (D) Levels of Klotho mRNAs encoding the longer (exons 1 to 5) or shorter (exons 1 to 3) isoform in 4-mo-old WT mice determined by RT-qPCR. n = 8 (CP) or 15 (hippocampus) mice per group. Note that a log-10 scale was used because of the large differences in the levels of the Klotho transcripts. (E and F) CP levels of klotho protein (E) and Klotho mRNA (F) in WT mice. n = 13 mice per group. (G and H) Western blot (G) and klotho levels (H) in 7- to 8-mo-old WT and Klothoflox/flox (Flox) mice determined 5 to 6 mo after i.c.v. injection of AAV5-CMV-Cre (Cre). n = 4 mice per group. (I) Klotho mRNA levels in 20- to 24-mo-old WT and Klothoflox/flox (Flox) mice measured 11 mo after Cre injection (n = 4 to 8 mice per group). (J) Sagittal CP sections colabeled for klotho (green) and anion exchanger 2 (AE2) (red) from 20- to 24-mo-old WT and Klothoflox/flox mice obtained 11 mo after Cre injection. (Scale bars: 50 µm.) *P < 0.05, **P < 0.01, ***P < 0.001 vs. leftmost bar by unpaired, two-tailed t test (C, F, H, and I) or one-way ANOVA and Tukey test (D and E). n.s., not significant. Values in bar graphs are means ± SEM.
Fig. 2.
Fig. 2.
Klotho depletion increases MHC class II expression in the CP. (AD) MHC II immunoreactivity in the CP of uninjected young (2 to 3 mo) vs. old (22 to 23 mo) WT mice (AC) and of Cre-injected 19- to 22-mo-old WT vs. Klothoflox/flox (Flox) mice measured 9 mo after i.c.v. injection (D and E). n = 5 to 7 mice per group. Coronal CP sections were double-labeled for MHC II (red) and for cytokeratin (gray) (A and D) or transthyretin (green) (B). [Scale bars: 100 µm (A and D), 30 µm (B).] *P < 0.05, ***P < 0.001 by unpaired, two-tailed t test. Values in bar graphs are means ± SEM.
Fig. 3.
Fig. 3.
Klotho reduction increases the expression of cytokine response factors in the CP. (AC) ICAM1 (A and B) and IRF7 (C) immunoreactivity in the CP of 19- to 22-mo-old WT vs. Klothoflox/flox (Flox) mice measured 9 mo after Cre injection. n = 5 to 7 mice per group. Sections of CP from the lateral ventricle (AC) or fourth ventricle (C, Rightmost images) were colabeled for cytokeratin (gray), klotho (green), and ICAM1 (red) (A) or klotho (green) and IRF7 (red) (C). (Scale bars: 100 µm.) The percent of the cytokeratin-immunoreactive area that was also positive for ICAM1 was quantitated in B. (D and E) High magnification confocal images of the CP labeled for ICAM1 (red) and transthyretin (green) (D) or AQP1 (green) (E). [Scale bars: 25 µm (D), 50 µm (E).] ***P < 0.001 by unpaired, two-tailed t test. Values in bar graphs are means ± SEM.
Fig. 4.
Fig. 4.
Klotho reduction causes macrophage invasion into the CP. (AE) Cells expressing the macrophage markers MAC-2 (A, C, and D), IBA-1 (B), or LY6C (E) and Ly6c mRNA levels (F) in the CP of 19- to 24-mo-old WT vs. Klothoflox/flox (Flox) mice determined 9 mo after Cre injection. n = 4 to 9 mice per group. Sagittal CP sections were double-labeled for MAC-2 (red) and cytokeratin (gray) (A), IBA-1 (red) and Hoechst 33342 nuclear stain (blue) (B), or transthyretin (green) and MAC-2 (red) (C). [Scale bars: 100 µm (A), 50 µm (B), 25 μm (C).] *P < 0.05 by unpaired, two-tailed t test. Values in bar graphs are means ± SEM.
Fig. 5.
Fig. 5.
Klotho reduction in CP primes hippocampal microglia for activation. (A) Hippocampal sections colabeled for IBA-1 (red) and TMEM119 (green) from 19- to 22-mo-old Klothoflox/flox (Flox) mice obtained 9 mo after i.c.v. injection of AAV5-CMV-Cre (Cre) or AAV5-CMV-GFP (GFP) and imaged by fluorescence microscopy. Mice received i.p. injections of saline (Sal) or ultrapure LPS (1 mg/kg) 28 h and 4 h before sacrifice. [Scale bars: 50 µm (Upper), 25 µm (Lower).] (BD) Relative hippocampal levels of IBA-1–positive cells (B), IBA-1 fluorescence intensity (C), and TMEM119 to IBA-1 area ratio (D) in mice exposed to these treatments (n = 4 to 8 mice per group). Mean levels in GFP/Sal-treated mice were defined as 1.0. **P < 0.01, ***P < 0.001, and ****P < 0.0001 by two-way ANOVA and Holm-Sidak’s test. Values are means ± SEM.
Fig. 6.
Fig. 6.
Klotho controls regulators of the NLRP3 inflammasome. (A and B) CP levels of Cyp27b1 mRNA in 20- to 24-mo-old WT vs. Klothoflox/flox (Flox) mice (n = 8 to 9 per group) measured 9 mo after Cre injection (A) and in uninjected 2-mo-old WT vs. kl/kl mice (n = 12 per group) (B). (CG) Levels of TXNIP (C, D, and F) and klotho (C) protein and of Txnip mRNA (E and G) in 7- to 8-mo-old (C and D) or 20- to 24-mo-old (E) WT vs. Klothoflox/flox (Flox) mice (n = 4 per group) measured 5 (C and D) or 11 (E) mo after Cre injection and in uninjected 2-mo-old WT vs. kl/kl mice (n = 12 per group) (F and G). Relative protein and mRNA levels were determined as described in Fig. 1H. (H) Relative IL-1β levels in culture medium of bone marrow-derived primary macrophages from WT mice determined by ELISA on days in vitro 7 to 10 after treatment with LPS (100 EU/mL for 20 h; start time: 0 h) and ATP (1 mM for 1 h; start time: 20 h). Cultures were pretreated by adding vehicle or one or more of the following: 25-VD3 (time: −1 h), 1,25-VD3 (time: −1 h), klotho (time: −2 h), FGF23 (time: −2 h). n = 4 independent experiments, each of which included three to four wells per condition. IL-1β levels measured after pretreatment with vehicle and LPS/ATP stimulation were defined as 1.0. *P < 0.05, **P < 0.01, ***P < 0.001, ****P < 0.0001 vs. leftmost bar or as indicated by brackets (one-way ANOVA and Bonferroni test). Values in bar graphs are means ± SEM.

References

    1. Franceschi C, Garagnani P, Vitale G, Capri M, Salvioli S. Inflammaging and ‘Garb-aging’. Trends Endocrinol Metab. 2017;28:199–212. - PubMed
    1. DeCarlo CA, Tuokko HA, Williams D, Dixon RA, MacDonald SW. BioAge: Toward a multi-determined, mechanistic account of cognitive aging. Ageing Res Rev. 2014;18:95–105. - PMC - PubMed
    1. Deczkowska A, Baruch K, Schwartz M. Type I/II interferon balance in the regulation of brain physiology and pathology. Trends Immunol. 2016;37:181–192. - PubMed
    1. Kaur C, Rathnasamy G, Ling EA. The choroid plexus in healthy and diseased brain. J Neuropathol Exp Neurol. 2016;75:198–213. - PubMed
    1. Emerich DF, Skinner SJ, Borlongan CV, Vasconcellos AV, Thanos CG. The choroid plexus in the rise, fall and repair of the brain. BioEssays. 2005;27:262–274. - PubMed

Publication types