. 2018 Nov 9;9(1):4730.
doi: 10.1038/s41467-018-07224-8.

Transcriptome-wide identification of transient RNA G-quadruplexes in human cells

Affiliations

Transcriptome-wide identification of transient RNA G-quadruplexes in human cells

Sunny Y Yang et al. Nat Commun. .

Abstract

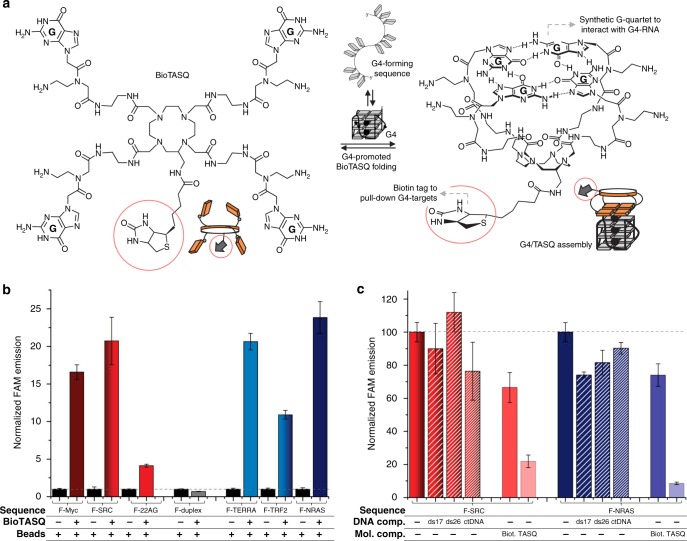
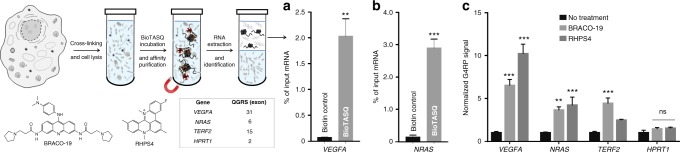
Guanine-rich RNA sequences can fold into four-stranded structures, termed G-quadruplexes (G4-RNAs), whose biological roles are poorly understood, and in vivo existence is debated. To profile biologically relevant G4-RNA in the human transcriptome, we report here on G4RP-seq, which combines G4-RNA-specific precipitation (G4RP) with sequencing. This protocol comprises a chemical crosslinking step, followed by affinity capture with the G4-specific small-molecule ligand/probe BioTASQ, and target identification by sequencing, allowing for capturing global snapshots of transiently folded G4-RNAs. We detect widespread G4-RNA targets within the transcriptome, indicative of transient G4 formation in living human cells. Using G4RP-seq, we also demonstrate that G4-stabilizing ligands (BRACO-19 and RHPS4) can change the G4 transcriptomic landscape, most notably in long non-coding RNAs. G4RP-seq thus provides a method for studying the G4-RNA landscape, as well as ways of considering the mechanisms underlying G4-RNA formation, and the activity of G4-stabilizing ligands.


Conflict of interest statement

The authors declare no competing interests.

Figures

Fig. 1
Fig. 1
Characterization of G4-specific affinity of BioTASQ. a Structure of BioTASQ displaying a biotin affinity tag (red circles), and schematic representation of its open (left) and closed, quadruplex-associated conformation (right), in which the intramolecular G-quartet is formed. Schematic representation of a guanine-rich RNA sequence (guanines as gray squares) in its unfolded, random-coil and folded G4 structure. b Fluorescence analysis of pull-down experiments carried out with (1) FAM-labeled oligonucleotides (1 µM): either G4-DNA (F-MYC, F-SRC, and F-22AG), duplex-DNA (F-duplex) or G4-RNA (F-TERRA, F-TRF2, and F-RAS); (2) BioTASQ (20 µM); and (3) streptavidin-coated magnetic beads. c Competitive pull-down experiments performed with F-SRC and F-NRAS (1 µM), BioTASQ (20 µM) in the absence or presence of duplex-DNA competitors (ds17 or ds26, 20 µM) or DNA extracts (calf thymus DNA, ctDNA, 100 µM), or of molecular competitors (biotin (or Biot.), 80 µM or PNADOTASQ (or TASQ), 10 µM). All experiments were done in triplicates. Error bars represent SD
Fig. 2
Fig. 2
Isolation of G4 targets from human cell extracts using G4RP. (left) Schematic representation of G4RP protocol. G4RP signals of biotin control versus BioTASQ through RT-qPCR quantification of a VEGFA and b NRAS mRNA levels in untreated MCF7 cells. c Changes induced by BRACO-19 and RHPS4 measured by the fold change of G4RP signal in VEGFA, NRAS, TERF2, and HPRT1 mRNA. Values are normalized to their individual untreated controls. Three biological replicates were used for the quantifications. Student's t-test and two-way ANOVA were performed. p-Values: *p < 0.05, ** p < 0.01, and ***p < 0.001. Error bars represent SEM
Fig. 3
Fig. 3
Characterization of the baseline level of G4-RNA landscape using G4RP-seq. a Top 10 highly abundant transcripts (filtered by at least 500 base-read counts) with the lowest BioTASQ enrichment (blue bars, normalized to the input in the untreated sample) or with the highest BioTASQ enrichment (red bars) ranked by Enrichment Scores. b Regression plot of BioTASQ-Enrichment Score for each transcript versus its corresponding G/C content (R2 = 0.187, p < 0.001, significant non-zero relationship). c Regression plot of BioTASQ-Enrichment Score for each transcript versus its corresponding gene length (R2 = 0.00005, p = 0.89, non-significant relationship). d Number of pG4 motifs (calculated by Quadbase2 using mid stringency G3L1–7) to gene length ratio plotted against the subset of highly abundant transcripts ranked by their BioTASQ enrichment. The bar graph (inset) shows the average pG4 motif/gene length ratio between the top 100 ranked transcripts versus the bottom 100 ranked transcripts (p < 0.001, significant difference, Student's t-test)
Fig. 4
Fig. 4
Characterization of the ligand-induced changes in the G4-RNA landscape. a Top 10 highly abundant transcripts with highest fold increase in BioTASQ enrichment (ranked by Enrichment Score Change) for BRACO-19 (red) and RHPS4 (green). Common targets that were ranked highly for both ligands are indicated in brown dashed lines. b (Top) Regression plot of BioTASQ-Enrichment Score Change for each transcript versus its corresponding G/C content (BRACO-19: R2 = 0.16, p < 0.0001; RHPS4: R2 = 0.16, p < 0.0001, significant non-zero relationship). (Bottom) Number of G4 motifs (calculated by Quadbase2 using mid stringency G3L1–7) to gene length ratio plotted against the subset of highly abundant transcripts ranked by their BioTASQ-Enrichment Score Change. Left panel is BRACO-19-induced changes and right panel is RHPS4-induced changes. c Absolute number of pG4 motifs of highly abundant gene transcripts ranked by BioTASQ-Enrichment Score for the three conditions: non-treated (black), BRACO-19 (red), and RHPS4 (green). (Bottom) Quantification of average number of pG4 motifs for top 100 and bottom 100 ranked genes for the three sets of conditions. d Venn diagram comparing top filtered BioTASQ-enriched gene lists for BRACO-19 and RHPS4. e G4RP-qPCR controls of the top lncRNA hits MALAT1, RPPH1, and XIST, in G4 ligand-treated (BRACO-19 or RHPS4) samples normalized to corresponding untreated controls. Three biological replicates were used for quantification. Two-way ANOVA was performed. p-Values: *p< 0.05, **p < 0.01, and ***p < 0.001. Error bars represent SEM
Fig. 5
Fig. 5
Proposed model of G4 structural equilibrium of lncRNAs in the presence of G4-stabilizing and G4-destabilizing factors. Guanine-rich RNAs in lncRNAs exist in equilibrium between single-strand and folded G4 state (center panel). At steady state (normal cell biology or untreated state), the nascent lncRNAs avoid G4-formation by the actions of G4-destabilizing factors such as helicases and RNA metabolizing factors (i.e., RNA-binding proteins) (right panel). G4-destabilizing factors may contribute to proper folding (including duplex structures) into the active form of lncRNA to mediate biological functions such as epigenetic regulation, mRNA procession, and gene expression regulation. The lack of G4 formation at steady state is shown by a lower relative level of G4RP-seq signal. However, in the presence of G4-stabilizing ligand (such as BRACO-19 and RHPS4), the nascent G-rich IncRNAs can be trapped in a folded G4 state due to G4-stabilizing ligands outcompetes the G4-destabilizing factors (left panel). This increase in folded G4 state is shown by an increase in the relative level of G4RP-seq signal

References

    1. Ding Y, et al. In vivo genome-wide profiling of RNA secondary structure reveals novel regulatory features. Nature. 2014;505:696. doi: 10.1038/nature12756. - DOI - PubMed
    1. Morris KV, Mattick JS. The rise of regulatory RNA. Nat. Rev. Genet. 2014;15:423–437. doi: 10.1038/nrg3722. - DOI - PMC - PubMed
    1. Leppek K, Das R, Barna M. Functional 5′-UTR mRNA structures in eukaryotic translation regulation and how to find them. Nat. Rev. Mol. Cell Biol. 2018;19:158–174. doi: 10.1038/nrm.2017.103. - DOI - PMC - PubMed
    1. Wan Y, Kertesz M, Spitale RC, Segal E, Chang H. Understanding the transcriptome through RNA structure. Nat. Rev. Genet. 2011;12:641–655. doi: 10.1038/nrg3049. - DOI - PMC - PubMed
    1. Bochman ML, Paeschke K, Zakian VA. DNA secondary structures: stability and function of G-quadruplex structures. Nat. Rev. Genet. 2012;13:770–780. doi: 10.1038/nrg3296. - DOI - PMC - PubMed

Publication types