. 2018 Nov 9;8(1):16644.
doi: 10.1038/s41598-018-34523-3.

Lysosomal and network alterations in human mucopolysaccharidosis type VII iPSC-derived neurons

Affiliations

Lysosomal and network alterations in human mucopolysaccharidosis type VII iPSC-derived neurons

Neus Bayó-Puxan et al. Sci Rep. .

Abstract

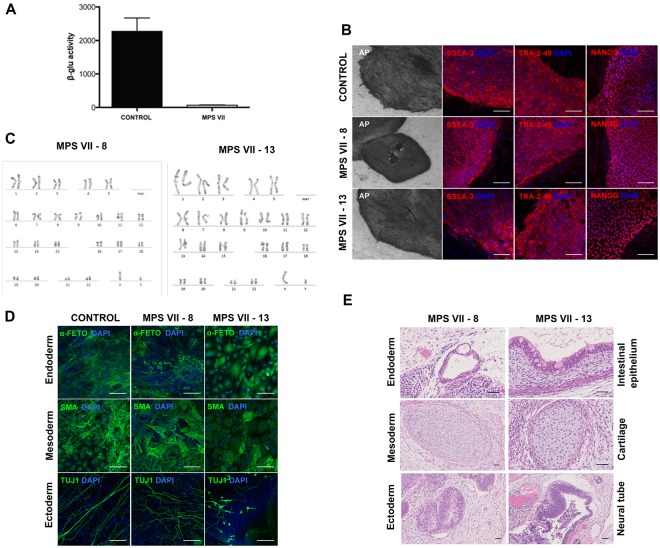
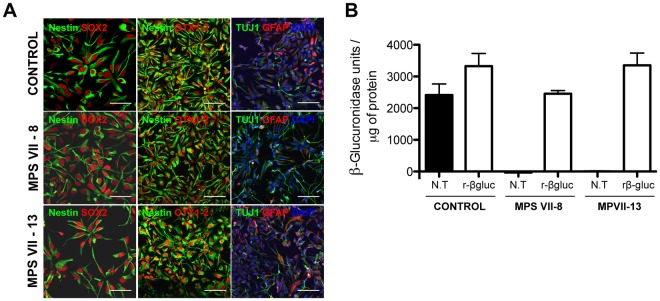
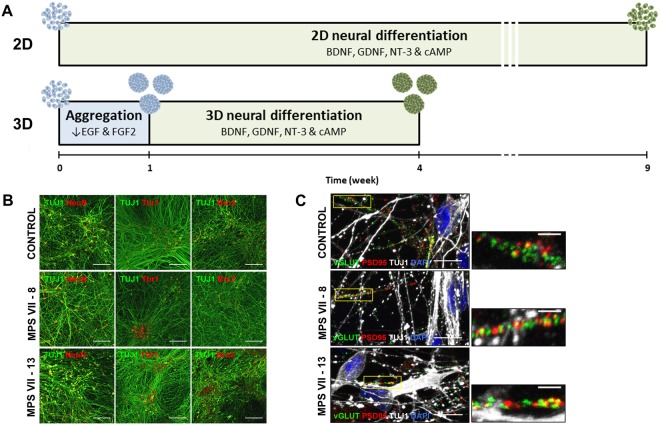
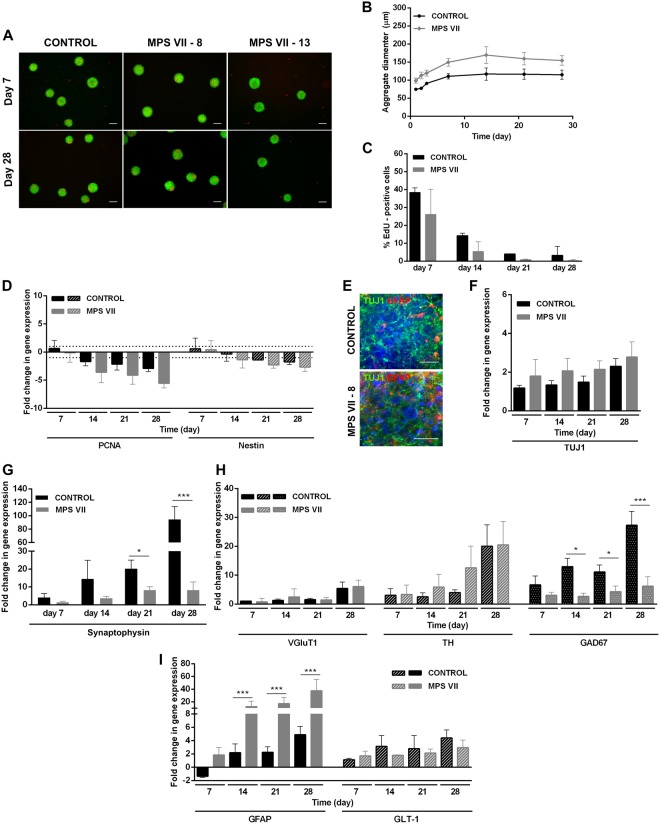
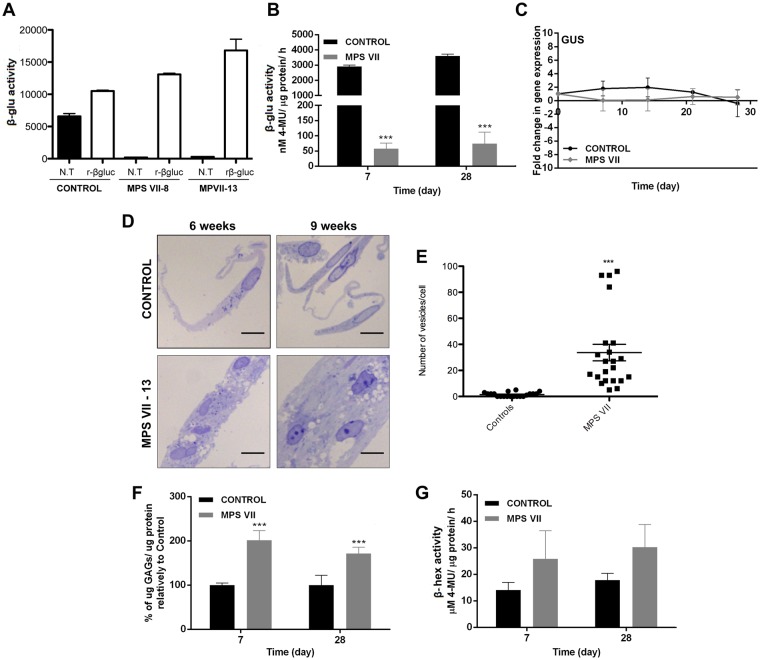
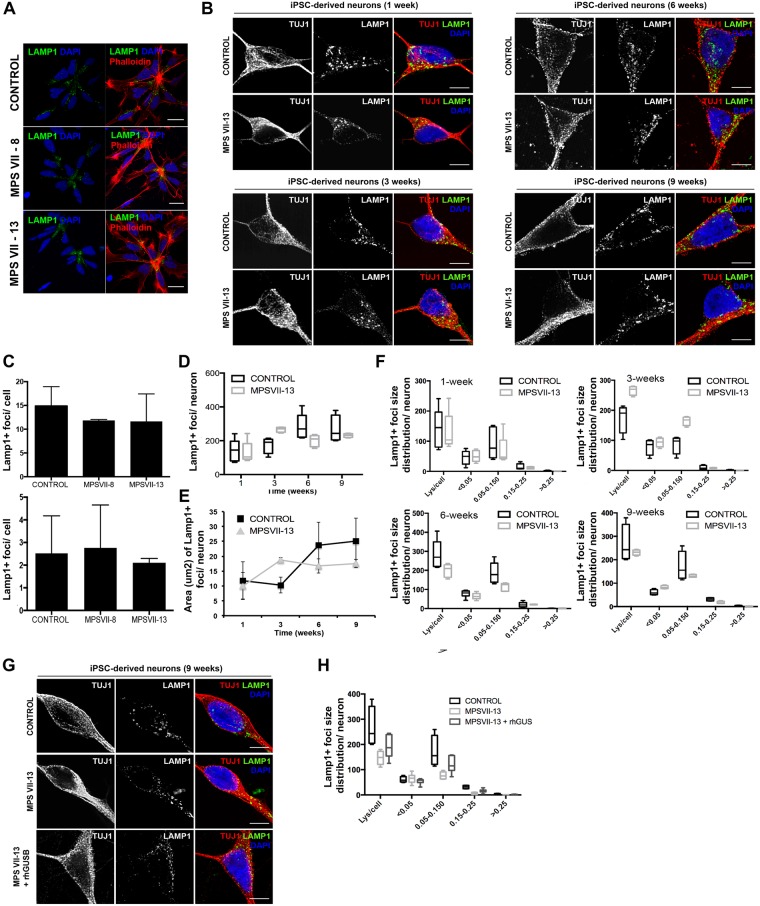
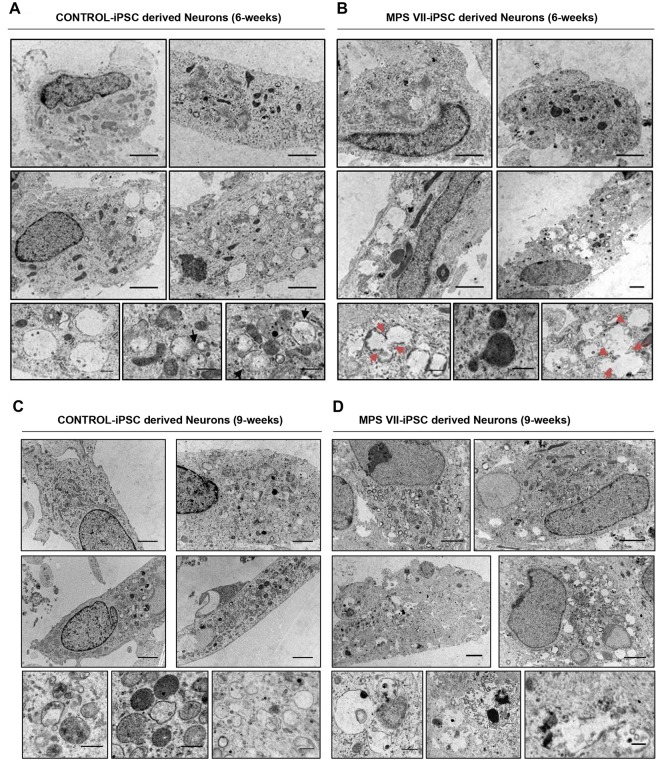
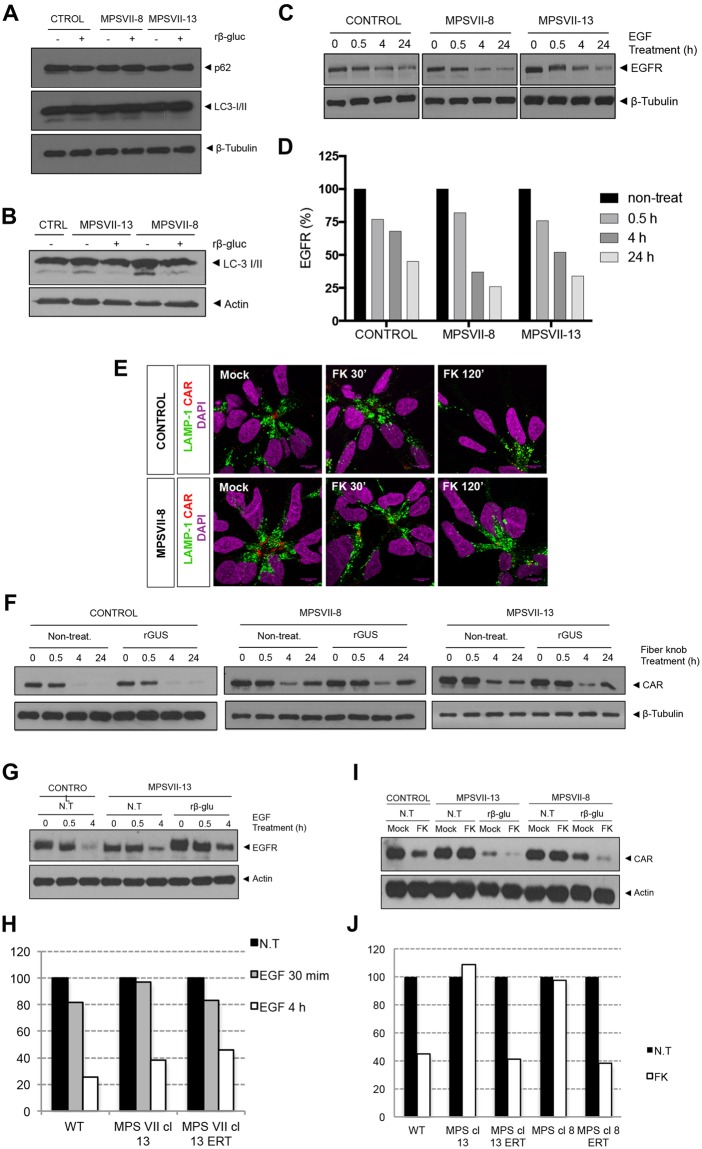
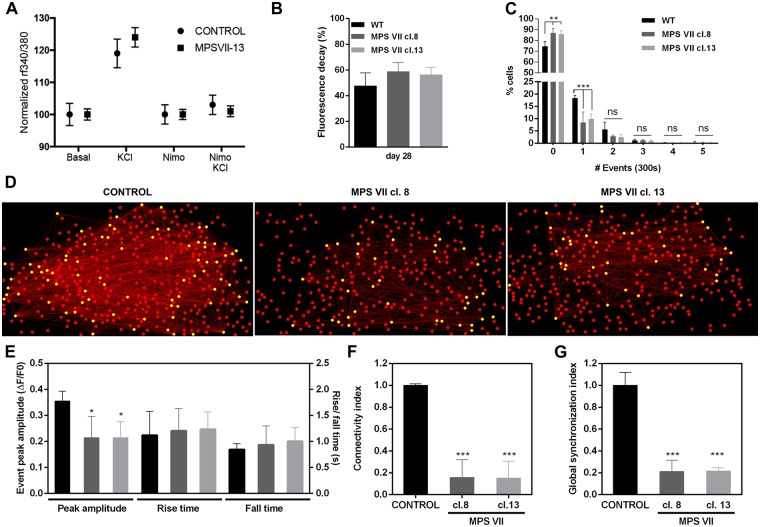
Mucopolysaccharidosis type VII (MPS VII) is a lysosomal storage disease caused by deficient β-glucuronidase (β-gluc) activity. Significantly reduced β-gluc activity leads to accumulation of glycosaminoglycans (GAGs) in many tissues, including the brain. Numerous combinations of mutations in GUSB (the gene that codes for β-gluc) cause a range of neurological features that make disease prognosis and treatment challenging. Currently, there is little understanding of the molecular basis for MPS VII brain anomalies. To identify a neuronal phenotype that could be used to complement genetic analyses, we generated two iPSC clones derived from skin fibroblasts of an MPS VII patient. We found that MPS VII neurons exhibited reduced β-gluc activity and showed previously established disease-associated phenotypes, including GAGs accumulation, expanded endocytic compartments, accumulation of lipofuscin granules, more autophagosomes, and altered lysosome function. Addition of recombinant β-gluc to MPS VII neurons, which mimics enzyme replacement therapy, restored disease-associated phenotypes to levels similar to the healthy control. MPS VII neural cells cultured as 3D neurospheroids showed upregulated GFAP gene expression, which was associated with astrocyte reactivity, and downregulation of GABAergic neuron markers. Spontaneous calcium imaging analysis of MPS VII neurospheroids showed reduced neuronal activity and altered network connectivity in patient-derived neurospheroids compared to a healthy control. These results demonstrate the interplay between reduced β-gluc activity, GAG accumulation and alterations in neuronal activity, and provide a human experimental model for elucidating the bases of MPS VII-associated cognitive defects.


Conflict of interest statement

The authors declare no competing interests.

Figures

Figure 1
Figure 1
Generation and characterization of human MPS VII iPSC. (A) β-gluc enzymatic activity (expressed in nmol 4-MU/μg of protein/h) in control and MPS VII patient’s fibroblasts. (B) Representative colonies of control and MPS VII iPSC stained for alkaline phosphatase (AP) and the pluripotency-associated markers SSEA-3, Tra-2-49 and NANOG (all in red) and DAPI (blue); scale bars 200 µm (AP) and 100 µm (SSEA-3, Tra-2-49 and NANOG). (C) Karyotype of MPS VII iPSC. (D) Immunofluorescence microscopy of control and MPS VII iPSC differentiated in vitro and stained for the endoderm, mesoderm and ectoderm markers α-fetoprotein (green), smooth muscle actin (SMA, green) and βIII-tubulin (Tuj1, green), respectively; scale bars 100 µm. (E) Control and MPS VII iPSC differentiated in vivo by teratoma formation, stained with hematoxylin and eosin, showing potential to differentiate into endoderm (intestinal epithelium), mesoderm (cartilage) and ectoderm (neural tube); scale bars 100 µm.
Figure 2
Figure 2
Characterization of human MPS VII iPSC-NPCs in 2D cultures. (A) Immunofluorescence microscopy of control and MPS VII iPSC-NPCs stained for NPC markers nestin (green) and SOX2 (red; first panel), scale bars 50 µm; nestin (green) and forebrain and midbrain progenitor marker OTX1/2 (red; second panel; and neuronal and astrocytic βIII-tubulin (Tuj1, green) and GFAP (red), respectively, DAPI (blue; third panel), scale bars 100 µm. (B) β-gluc enzymatic activity (expressed in nmol 4-MU/μg of protein/h) in control and MPS VII iPSC-NPC, non-treated (N.T.) and treated with recombinant β-gluc (rβ-gluc).
Figure 3
Figure 3
Schematic experimental workflow for differentiation of neural cells from control and MPS VII iPSC-NPCs in 2D (top) and 3D (bottom) culture systems and characterization of human MPS VII neurons in 2D cultures. (A) For 2D differentiation, iPSC-NPCs were plated and neural differentiation was induced by exposure to BDNF, GDNF, NT-3 and cAMP for 9 weeks. For 3D differentiation iPSC-NPCs were inoculated in a stirred suspension culture system, with reduced concentrations of growth factors EGF and FGF, and aggregated for 1 week, followed by induction of neural differentiation with BDNF, GDNF, NT-3 and cAMP for 3 weeks. (B) Representative images of control and MPS VII neurons stained for βIII-tubulin (Tuj1, green) and NeuN or cortical markers Tbr1 or Brn2 (red), respectively in first, second and third panels, scale bars 100 µm; (C) pre-synaptic protein vGLUT1 (green), post-synaptic protein PSD95 (red), βIII-tubulin (Tuj1, grey) and DAPI (blue), scale bars 100 µm; inserts (right) show synapsis formation at higher magnification, scale bars 5 μm.
Figure 4
Figure 4
Characterization of MPS VII neurospheroids. (A) Representative images of control and MPS VII neurospheroids cell viability at day 7 and 28 by live/dead assay using fluorescein diacetate (FDA) for staining of live cells (green) and propidium iodide (PI) for dead cells (red). (B) Control (black) and MPS VII (grey) neurospheroid diameter profile along culture time. (C) Percentage of EdU+ cells in control (black) and MPS VII (grey) neurospheroids along culture time. (D) Gene expression analyses of control (black) and MPS VII (grey) neurospheroids; fold-changes (normalized to undifferentiated cells) of proliferation (PCNA) and NPC (nestin) mRNAs. Data are mean ± SD of 3 (control) and 4 (MPS VII; 2 with MPS VII-cl.8 and 2 with MPS VII-cl.13) independent cultures. (E) Immunofluorescence confocal microscopy of control and MPS VII neurospheroids stained for astrocytic GFAP (red), neuronal βIII-Tubulin (green) and DAPI (blue); scale bars 20 µm. Gene expression analyses of control (black) and MPS VII (grey) neurospheroids; fold-change (normalized to undifferentiated cells) of: (F) βIII-tubulin, (G) the synaptic vesicle marker synaptophysin, (H) glutamatergic (VGluT1), dopaminergic (TH) and GABAergic (GAD67) neuronal subtypes markers, (I) astrocytic markers GFAP and GLT1. Data are mean ± SD of 3 (control) and 4 (MPS VII; 2 with MPS VII-cl.8 and 2 with MPS VII-cl.13) independent cultures. Asterisks indicate significant difference: *p < 0.05, ***p < 0.001.
Figure 5
Figure 5
MPS VII neural cells recapitulate known disease features. (A) β-gluc enzymatic activity (expressed in nmol 4-MU/μg of protein/h) in control and MPS VII neurons, non-treated (N.T.) and treated with rβ-gluc. (B) β-gluc enzymatic activity in control (black) and MPS VII (grey) neurospheroids at day 7 and 28. (C) Gene expression analysis of control (black) and MPS VII (grey) neurospheroids; fold-change (normalized to undifferentiated cells) of GUSB. (D) GAGs storage in control and MPS VII neurons by toluidine blue staining at 6 and 9 weeks; scale bars 5 μm. (E) Number of toluidine blue nonstaining vesicles per cell at week 9; micrographs were analyzed using ImageJ software and the number of nonstaining vesicles/cell, with a minimum of 0.5 and a maximum of 4.2 μm, were counted manually by a masked observer; each data point (n) corresponds to a single, well isolated, cell (control n = 20, MPS VII n = 23). (F) GAGs quantification in control (black) and MPS VII (grey) neurospheroids by Blyscan Sulphated Glycosaminoglycan assay. (G) β-hex enzymatic activity (expressed in nmol 4-MU/μg of protein/h) in control (black) and MPS VII (grey) neurospheroids at day 7 and 28. Data are mean ± SD of 3 (control) and 4 (MPS VII; 2 with MPS VII-cl.8 and 2 with MPS VII-cl.13) independent cultures. ***p < 0.001.
Figure 6
Figure 6
Lysosome structural alteration in MPS VII NPCs and neurons. (A) Immunofluorescence microscopy of control and MPS VII NPC, stained for LAMP1 (green) and DAPI (blue; left panel) or phalloidin (red) and DAPI (blue; right panel); scale bars 20 µm. (B) Immunofluorescence confocal microscopy of control and MPS VII neurons at 1, 3, 6 and 9 weeks of culture, stained for LAMP1 (green), βIII-tubulin (TUJ1, red) and DAPI (blue); scale bars 5 µm. (C) Quantification of acidic vesicles labeled with LysotrackerTM of control and MPS VII NPC, with areas between 0.1–1.2 μm2 per cell (top) and higher than 1.2 μm2 per cell (bottom). Mean LAMP1+ vesicles content (D), area (µm2) (E) and size distribution (F) per neuron for control and MPS VII neurons along culture time. (G) Immunofluorescence confocal microscopy of control, MPS VII neurons and β-gluc-treated MPS VII neurons at 9 weeks of culture, stained for LAMP1 (green), βIII-tubulin (TUJ1, red) and DAPI (blue); scale bars 5 µm. (H) Mean LAMP1+ vesicles size distribution for control, MPS VII neurons and β-gluc-treated MPS VII neurons at 9 weeks of culture.
Figure 7
Figure 7
Transmission electron microscopy (TEM) of MPS VII neurons. Ultrastructure of control (A,C) and MPS VII (B,D) neurons at 6 (A,B) and 9 (C,D) weeks of culture. Black arrows in (A) show well-defined endocytic compartment with amphisomes and multivesicular bodies in control neurons, while MPS VII neurons harbor expanded and heterogeneous endocytic compartments that formed clusters. Red arrows in (B) indicate fusion between homotypic vesicles in MPS VII neurons. Scale bars 2 μm (top panels) and 0.5 μm (bottom panels).
Figure 8
Figure 8
Lysosome function alteration in MPS VII NPCs and neurons. Autophagy basal levels in control and MPS VII NPCs (A) and in control and MPS VII neurons (B). P62 and LC3-I/ II were analyzed by western blot of control and MPS VII NPC protein extracts, non-treated (−) and treated (+) with rβ-gluc. Data from one representative experiment of 4 independent experiments; Images from different parts of the same gel. (C) Control and MPS VII NPC lysosome ability to degrade membrane proteins internalized by endosomes assayed by an EGFR degradation assay. EGFR content analyzed by western blot. Data from one representative experiment of 2 independent experiments; Image from different parts of the same gel. (D) Quantification of EGFR degradation efficiency in control and MPS VII NPC normalized to β-tubulin levels. (E) Immunofluorescence confocal microscopy of control and MPS VII NPC, after induction of CAR degradation, stained for LAMP1 (green), CAR (extra- and intracellular domains, red) and DAPI (blue). CAR localized at the membrane, internalized into lysosomes (LAMP1 and CAR co-localization, 30′) and degraded (120′). (F) Lysosome ability to degrade CAR assayed in control and MPS VII NPC, non-treated (non-treat.) and treated with rβ-gluc. CAR content analyzed by Western blot. Data from one representative experiment of 2 independent experiments; Control, MPS VII-8 and MPS VII-13 gels are independent and CAR and β-tubulin images are from different parts of the same gel. (G) Lysosome ability to degrade membrane proteins internalized by endosomes assayed by an EGFR degradation assay in control and MPS VII neurons, non-treated (N.T.) and treated with rβ-gluc. EGFR content analyzed by Western blot. Data from one representative experiment of 5 independent experiments; Image from different parts of the same gel. (H) Quantification of EGFR degradation efficiency in control and MPS VII neurons normalized to actin levels. (I) Control and MPS VII neurons lysosome ability to degrade CAR, non-treated (N.T.) and treated with rβ-gluc. CAR content was analyzed by Western blot. Data from one representative experiment of 5 independent experiments; Image from different parts of the same gel. (J) Quantification of CAR degradation efficiency in control and MPS VII neurons normalized to actin levels.
Figure 9
Figure 9
MPS VII neuronal activity and MPS VII neurospheroids calcium (Ca++) imaging analysis. (A) Ca++ release in control and MPS VII neurons, upon KCl induction and reduction of Ca++ signaling upon inhibition with nimodipine. (B) FM-1–43 fluorescence decay in control (black) and MPS VII (grey) neurospheroids at day 28. Data are mean ± SD of 3 independent cultures. (C) Percentage of cells per number of spontaneous Ca++ events in 300 seconds for control (black) and MPS VII (cl. 8 grey; cl. 13 light grey) neurospheroids. (D) Visual representations of neural networks from control and MPS VII neurospheroids reconstructed using FluoroSNNAP; circles show the position of cells in culture, yellow circles represent functionally connected nodes and red lines represent the functional connectivity of pair-wise neurons. (E) Ca++ events peak amplitude, rise time and fall time in control (black) and MPS VII (cl. 8 grey; cl. 13 light grey) neurospheroids. Network properties: Connectivity index (F) and Global synchronization index (G) in control (black) and MPS VII (cl. 8 grey; cl. 13 light grey) neurospheroids. Data are mean ± SD of 3 (control) and 4 (MPS VII; 2 with MPS VII-cl.8 and 2 with MPS VII-cl.13) independent cultures. Asterisks indicate significant difference: *p < 0.05, ***p < 0.01, ***p < 0.001.

References

    1. Batzios S, Zafeiriou D, Papakonstantinou E. Extracellular matrix components: An intricate network of possible biomarkers for lysosomal storage disorders? FEBS Lett. 2013;587:1258–1267. doi: 10.1016/j.febslet.2013.02.035. - DOI - PubMed
    1. Montaño Adriana M, Lock-Hock Ngu, Steiner Robert D, Graham Brett H, Szlago Marina, Greenstein Robert, Pineda Mercedes, Gonzalez-Meneses Antonio, Çoker Mahmut, Bartholomew Dennis, Sands Mark S, Wang Raymond, Giugliani Roberto, Macaya Alfons, Pastores Gregory, Ketko Anastasia K, Ezgü Fatih, Tanaka Akemi, Arash Laila, Beck Michael, Falk Rena E, Bhattacharya Kaustuv, Franco José, White Klane K, Mitchell Grant A, Cimbalistiene Loreta, Holtz Max, Sly William S. Clinical course of sly syndrome (mucopolysaccharidosis type VII) Journal of Medical Genetics. 2016;53(6):403–418. doi: 10.1136/jmedgenet-2015-103322. - DOI - PMC - PubMed
    1. Tomatsu S, et al. Molecular basis of mucopolysaccharidosis type VII: replacement of Ala619 in??-glucuronidase with Val. Gene. 1990;89:283–287. doi: 10.1016/0378-1119(90)90019-N. - DOI - PubMed
    1. Tomatsu S, Montaño AM, Dung VC, Grubb JH, Sly WS. Mutations and Polymorphisms in GUSB Gene in Mucopolysaccharidosis VII (Sly Syndrome) Hum Mutat. 2009;30:511–519. doi: 10.1002/humu.20828. - DOI - PMC - PubMed
    1. Wang P, et al. Mucopolysaccharidosis VII in a Cat Caused by 2 Adjacent Missense Mutations in the GUSB Gene. J Vet Intern Med. 2015;29:1022–1028. doi: 10.1111/jvim.13569. - DOI - PMC - PubMed

Publication types

Substances