. 2018 Nov 10;11(1):66.
doi: 10.1186/s13072-018-0236-7.

Integrative analysis of single-cell expression data reveals distinct regulatory states in bidirectional promoters

Affiliations

Integrative analysis of single-cell expression data reveals distinct regulatory states in bidirectional promoters

Fatemeh Behjati Ardakani et al. Epigenetics Chromatin. .

Abstract

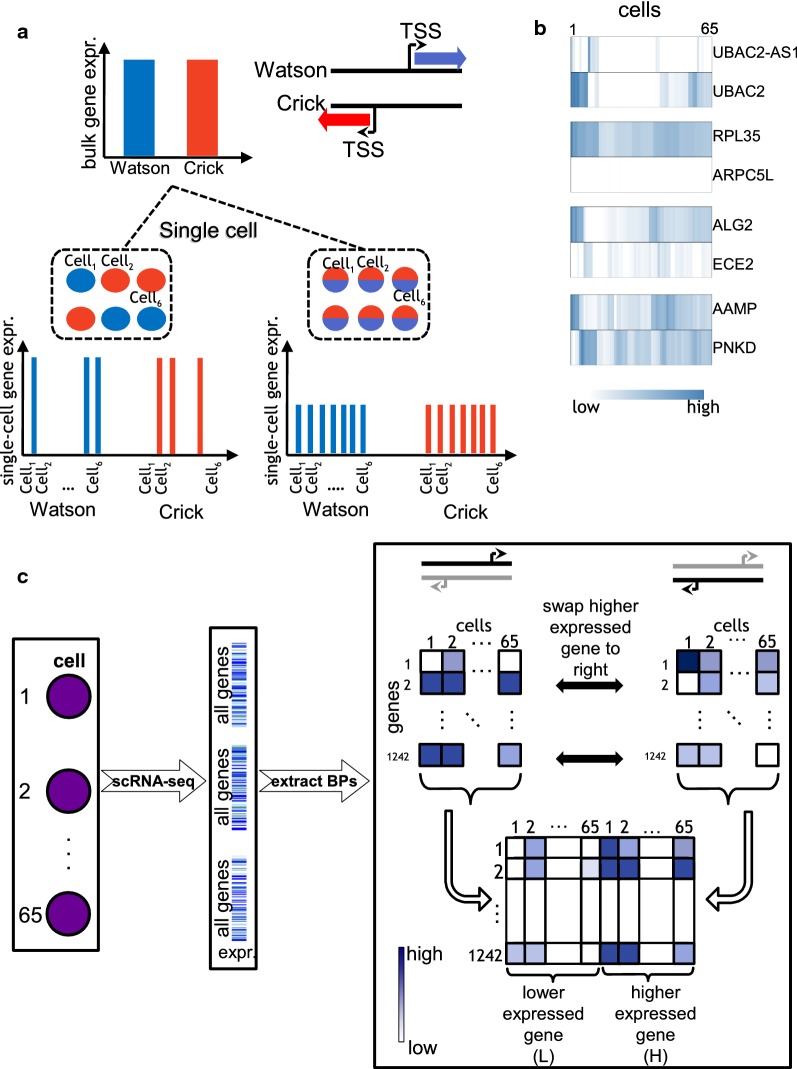
Background: Bidirectional promoters (BPs) are prevalent in eukaryotic genomes. However, it is poorly understood how the cell integrates different epigenomic information, such as transcription factor (TF) binding and chromatin marks, to drive gene expression at BPs. Single-cell sequencing technologies are revolutionizing the field of genome biology. Therefore, this study focuses on the integration of single-cell RNA-seq data with bulk ChIP-seq and other epigenetics data, for which single-cell technologies are not yet established, in the context of BPs.

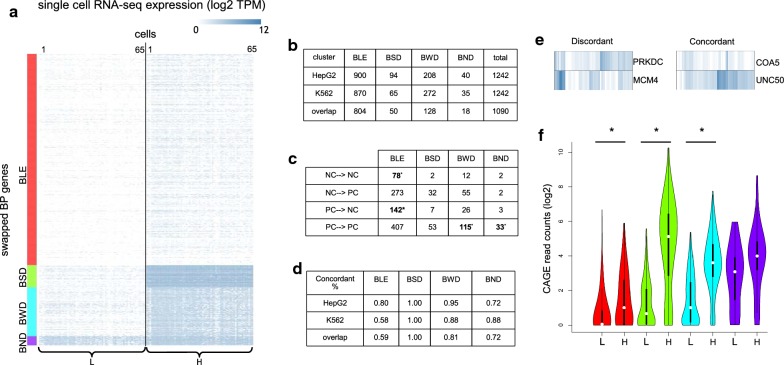
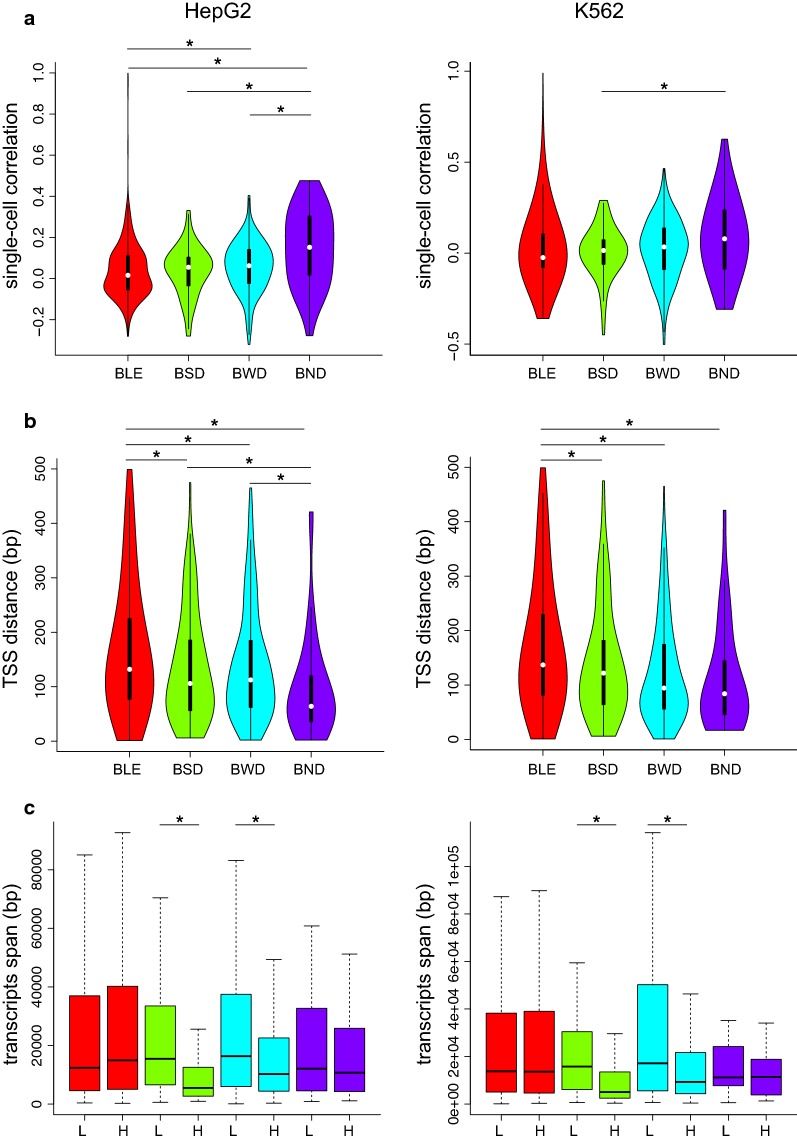
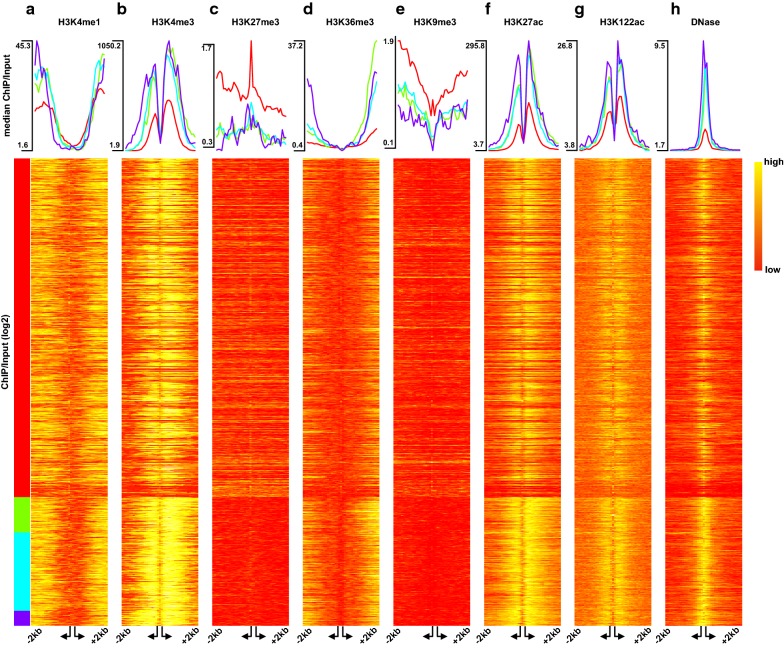
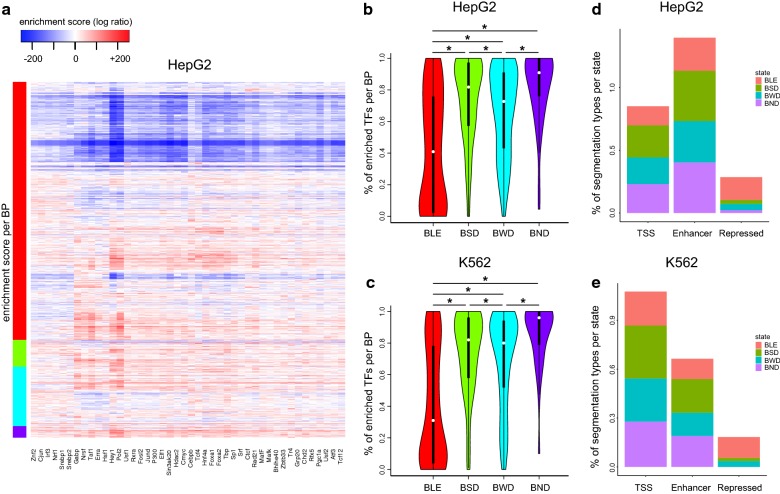
Results: We performed integrative analyses of novel human single-cell RNA-seq (scRNA-seq) data with bulk ChIP-seq and other epigenetics data. scRNA-seq data revealed distinct transcription states of BPs that were previously not recognized. We find associations between these transcription states to distinct patterns in structural gene features, DNA accessibility, histone modification, DNA methylation and TF binding profiles.

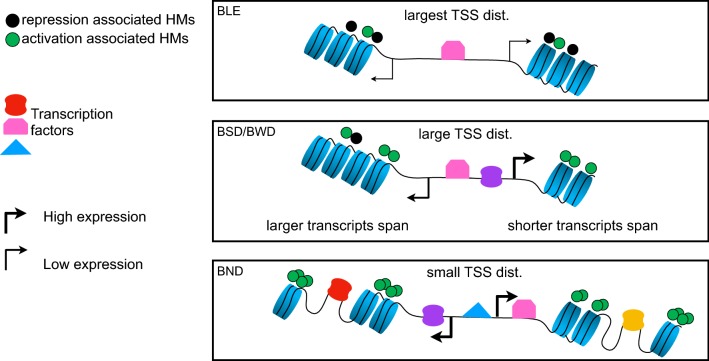
Conclusions: Our results suggest that a complex interplay of all of these elements is required to achieve BP-specific transcriptional output in this specialized promoter configuration. Further, our study implies that novel statistical methods can be developed to deconvolute masked subpopulations of cells measured with different bulk epigenomic assays using scRNA-seq data.

Keywords: Bidirectional genes; Epigenetics; Single-cell RNA-seq.


Figures

Fig. 1
Fig. 1
Advantages of studying BPs at single-cell level. a An illustration of a BP, defined based on two genes located on opposing strands of DNA (Watson and Crick). Bulk RNA measurements at the BP may hide complexity of BP gene regulation. This is shown in the left single-cell expression scenario, where one of the genes is expressed and the other is silent in the same cell compared to the other scenario where single-cell expression agrees with bulk measurements. b Heatmaps of 65 single-cell RNA-seq expression measured in four bidirectional promoters (TPM, HepG2 cells). c After single-cell sequencing and estimating the gene expression of all genes in a cell, a set of 1242 BPs was extracted. Single-cell expression of either genes of a BP was arranged in two separate matrices for which the rows represent the BPs and columns the cells. Next, we swap the higher expressed gene to the matrix on the right and lower expressed one to the left. The resulting matrices are combined into one joint BP single-cell expression matrix
Fig. 2
Fig. 2
Single-cell RNA-seq expression in bidirectional promoters. a Hierarchical clustering of the HepG2 single-cell transcript expression matrix visualized as a heatmap (log2, TPM). The four distinct clusters (BLE, BSD, BWD, BND) are referred to as transcription state in this manuscript. b Number of BPs falling into each transcription state in HepG2 and K562 cells and their overlap. c Number of BPs falling into the gene product categories (NC → NC, NC → PC, etc.) in HepG2. Statistically enriched values are shown in bold (hypergeometric test p <= 0.05). d Ratio of concordant BPs shown separately in each state for both cell lines as well as their overlap. e Examples of concordant and discordant BPs in HepG2. f CAGE read counts, measured for each bidirectional gene (L and H), shown for each transcription state. Color code as in a. Significant differences are marked with * (paired and two-sided Mann–Whitney test, p <= 0.05)
Fig. 3
Fig. 3
Structural features of BPs for HepG2 (left column) and K562 cells (right column). a Distributions of Pearson correlation coefficients (y-axis) calculated from all single-cell measurements for each BP in one of the states (x-axis). b Distributions of TSS distance of BPs in each state. c Length distributions of transcripts span for L and H genes of BPs shown in each state. Significant differences are marked with an * (paired and two-sided Mann–Whitney test, p <= 0.05). For all subfigures the color-coding is consistent with Fig. 1d
Fig. 4
Fig. 4
Epigenetic characteristics in transcription states in HepG2 cells. ag Histone modification (ChIP/Input) shown as median profiles (top panel) and log-transformed values as heatmap (bottom panel). h DNase1-seq median profiles (top panel) and log-transformed raw counts (bottom panel). Arrangement of genes as in Fig. 1d. The reads are measured in 40 bins of size 100 bp forming a window of size 4000 bp centered around the TSSs, with an additional variable bin between the TSSs
Fig. 5
Fig. 5
Transcriptional regulatory features in the transcription states. a Heatmap of TF enrichment scores (log ratio against background) for each BP (row) in HepG2 cells. BPs are sorted as in Fig. 1d. b, c Distributions of percentages of TFs per BP (enrichment score in a > 0) in each state for HepG2 (top panel) and K562 (bottom panel). d, e ChromHMM annotations, summarized into the types: TSS, Enhancer, and Repressed, are shown as percentages in a bar plot per state (see “Methods”)
Fig. 6
Fig. 6
Hypothetical model of three different genomic architectures underlying epigenetic regulations of BPs. BPs that drive single-cell expression patterns observed in the BLE state show large TSS distance and higher abundance of repression associated marks and depletion of most TFs. BSD and BWD, on the other hand, exhibit smaller TSS distance and more TF binding compared to BLE. In addition, the transcripts span of the H gene is observed to be significantly smaller compared to the L gene. BPs categorized in BND show the smallest TSS distance with the most TF binding events that require more accessible DNA to regulate both the L and H genes

References

    1. Core LJ, Waterfall JJ, Lis JT. Nascent RNA sequencing reveals widespread pausing and divergent initiation at human promoters. Science. 2008;322(5909):1845–1848. doi: 10.1126/science.1162228. - DOI - PMC - PubMed
    1. Preker P, Nielsen J, Kammler S, Lykke-Andersen S, Christensen MS, Mapendano CK, Schierup MH, Jensen TH. RNA Exosome depletion reveals transcription upstream of active human promoters. Science. 2008;322(5909):1851–1854. doi: 10.1126/science.1164096. - DOI - PubMed
    1. Seila AC, Calabrese JM, Levine SS, Yeo GW, Rahl PB, Flynn RA, Young RA, Sharp PA. Divergent transcription from active promoters. Science. 2008;322(5909):1849–1851. doi: 10.1126/science.1162253. - DOI - PMC - PubMed
    1. Core LJ, Martins AL, Danko CG, Waters CT, Siepel A, Lis JT. Analysis of nascent RNA identifies a unified architecture of initiation regions at mammalian promoters and enhancers. Nat Genet. 2014;46(12):1311–1320. doi: 10.1038/ng.3142. - DOI - PMC - PubMed
    1. Duttke SHC, Lacadie SA, Ibrahim MM, Glass CK, Corcoran DL, Benner C, Heinz S, Kadonaga JT, Ohler U. Human promoters are intrinsically directional. Mol Cell. 2015;57(4):674–684. doi: 10.1016/j.molcel.2014.12.029. - DOI - PMC - PubMed

Publication types

Substances

LinkOut - more resources