. 2018 Nov 28;7(5):482-495.e10.
doi: 10.1016/j.cels.2018.09.003. Epub 2018 Nov 7.

Gain of CTCF-Anchored Chromatin Loops Marks the Exit from Naive Pluripotency

Affiliations

Gain of CTCF-Anchored Chromatin Loops Marks the Exit from Naive Pluripotency

Aleksandra Pękowska et al. Cell Syst. .

Abstract

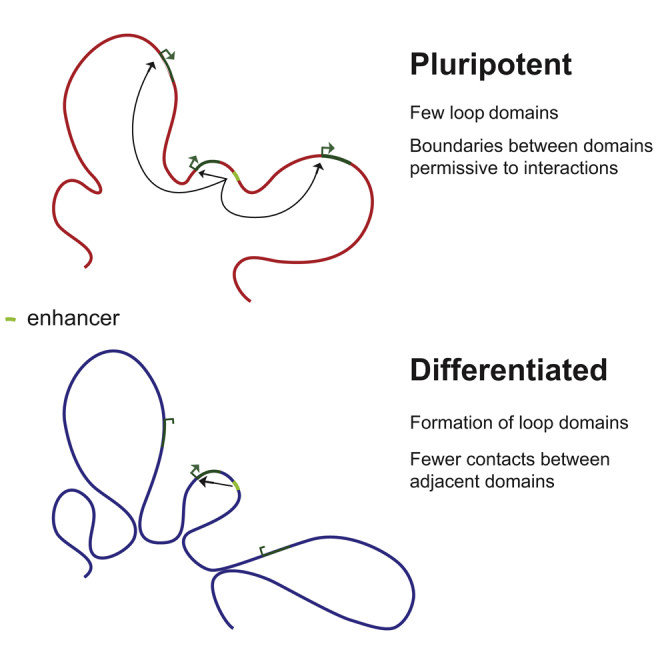
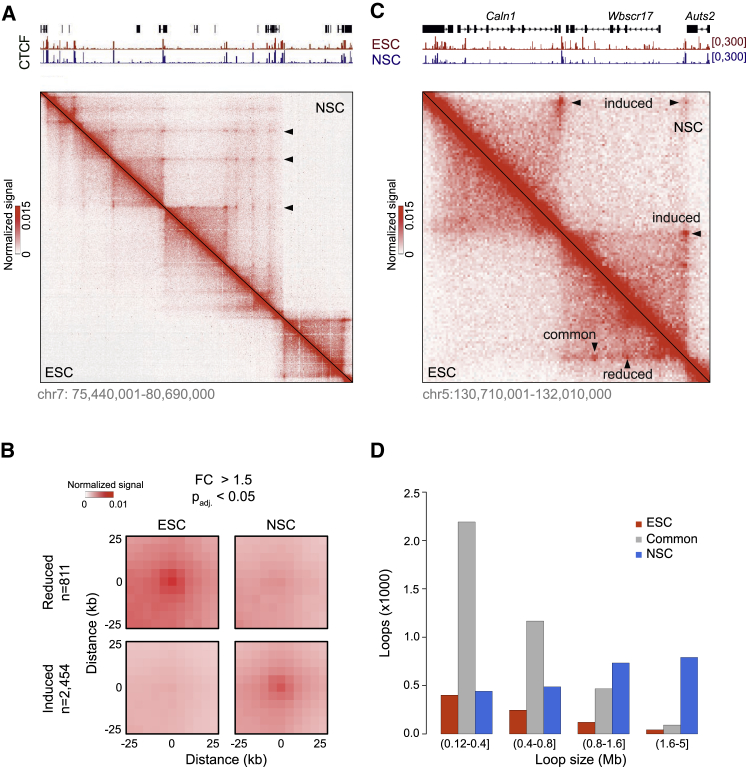
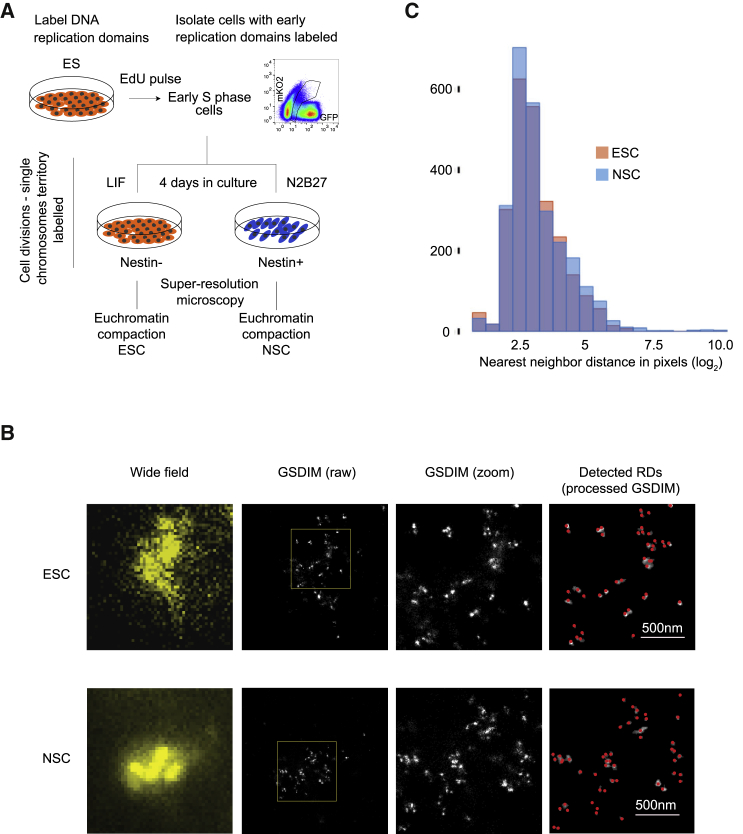
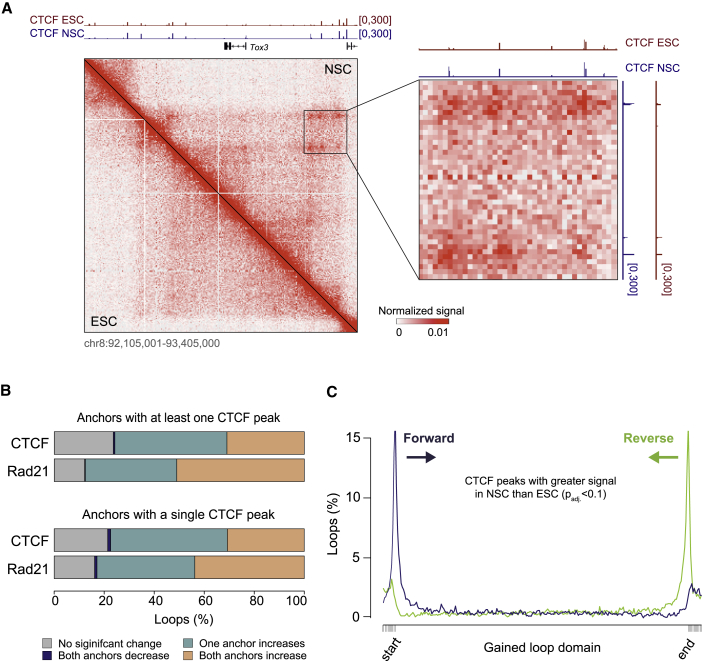
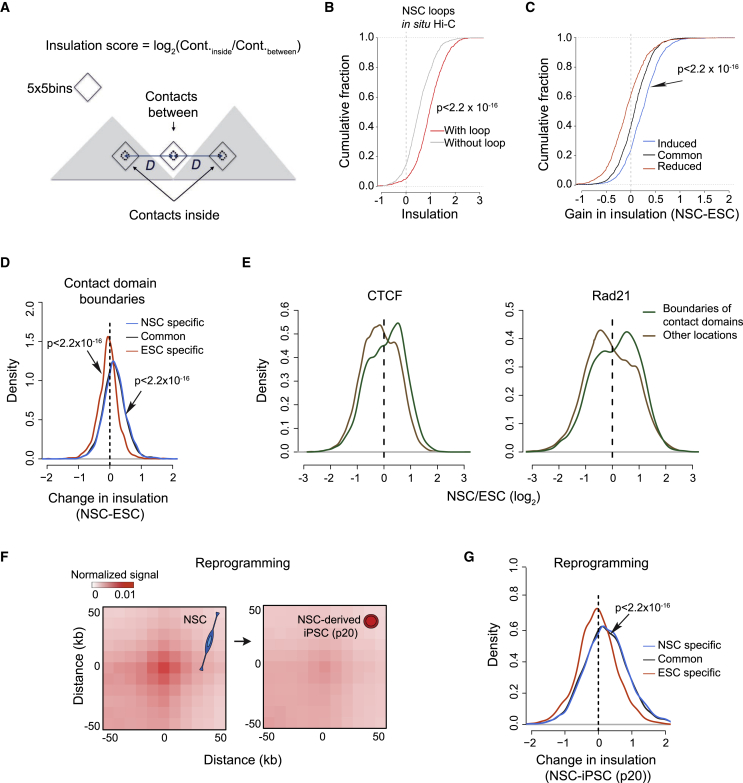
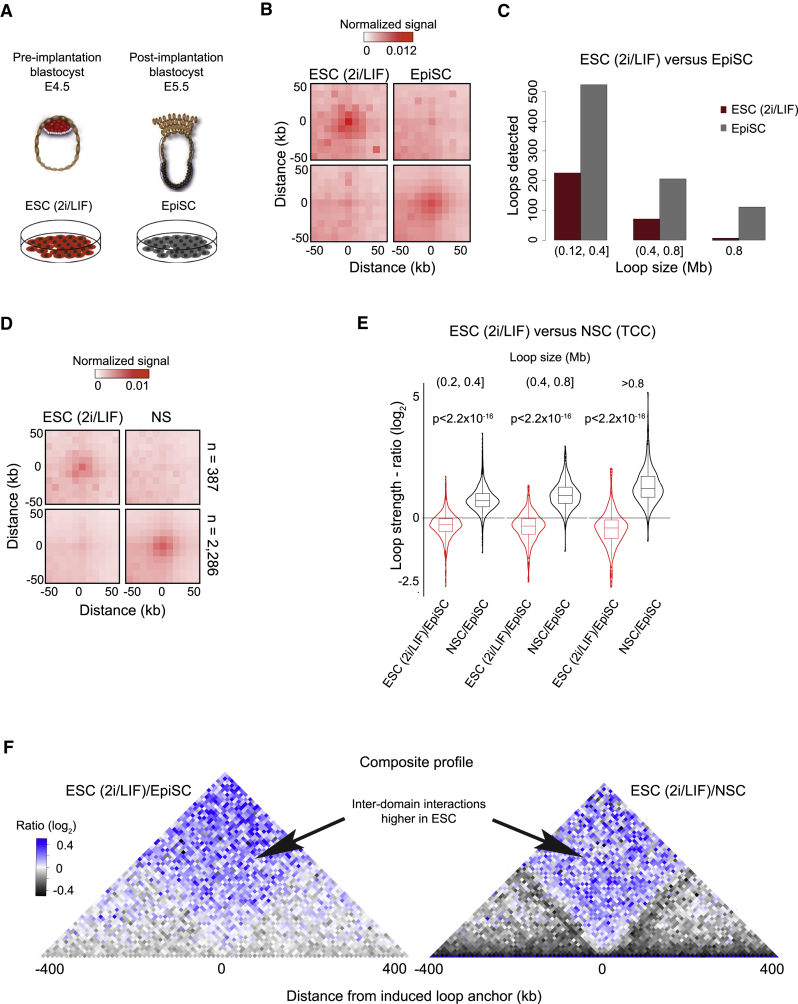
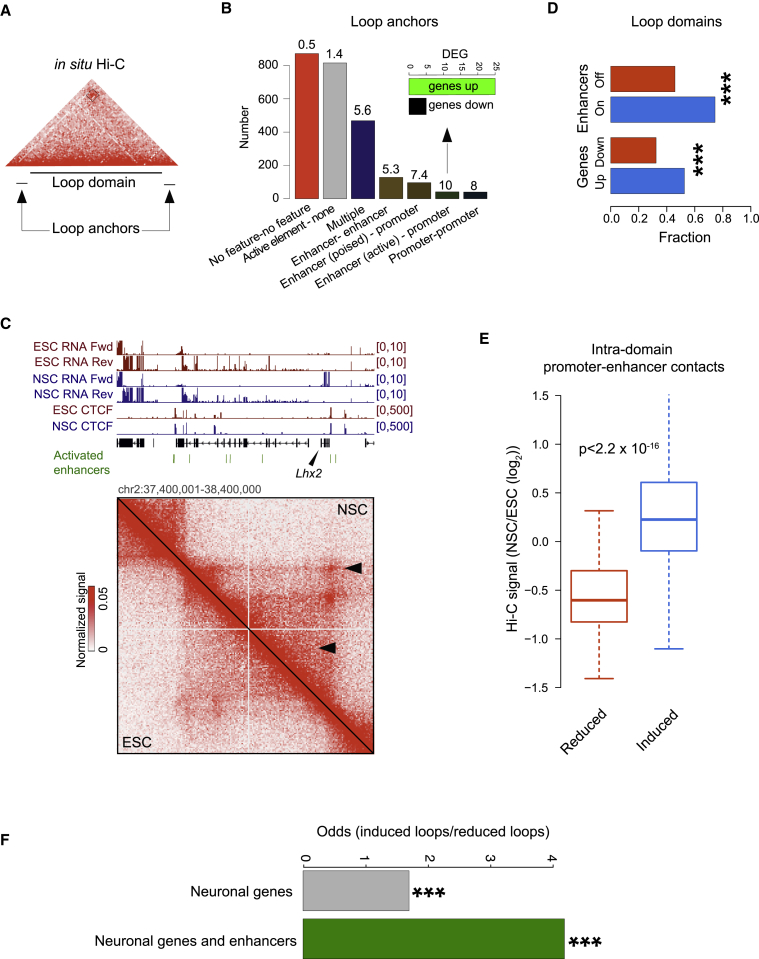
The genome of pluripotent stem cells adopts a unique three-dimensional architecture featuring weakly condensed heterochromatin and large nucleosome-free regions. Yet, it is unknown whether structural loops and contact domains display characteristics that distinguish embryonic stem cells (ESCs) from differentiated cell types. We used genome-wide chromosome conformation capture and super-resolution imaging to determine nuclear organization in mouse ESC and neural stem cell (NSC) derivatives. We found that loss of pluripotency is accompanied by widespread gain of structural loops. This general architectural change correlates with enhanced binding of CTCF and cohesins and more pronounced insulation of contacts across chromatin boundaries in lineage-committed cells. Reprogramming NSCs to pluripotency restores the unique features of ESC domain topology. Domains defined by the anchors of loops established upon differentiation are enriched for developmental genes. Chromatin loop formation is a pervasive structural alteration to the genome that accompanies exit from pluripotency and delineates the spatial segregation of developmentally regulated genes.

Keywords: CTCF; CTCF loops; chromatin architecture; chromatin loops; chromatin structure; differentiation; pluripotency; topologically associating domains.


Figures

None
Graphical abstract
Figure 1
Figure 1
Differentiation Elicits Formation of Long-Range Chromatin Loops (A) Examples of chromatin loops (arrows) in ESCs and NSCs (lower and upper triangles, respectively). Heatmaps show normalized counts of in situ Hi-C reads between pairs of genomic loci (STAR Methods). (B) Composite profile of in situ Hi-C signal (similar to implementation of APA [Rao et al., 2014]) from reduced (top) and induced (bottom) loops in ESCs (left) and NSCs (right). Statistical significance of loop signal was assessed by a Wald test (FDR = 0.05 and FC > 1.5; STAR Methods). (C) Examples of dynamic and stable loops. (D) Length distributions of NSC-specific, common, and ESC-specific loops.
Figure 2
Figure 2
Compactness of Euchromatin Remains Unchanged upon Differentiation (A) Experimental approach. (B) SRI identification of RD in ESCs and Nestin+ NSCs. Cells were labeled with anti-Nestin antibody prior to SRI, and Nestin and Nestin+ fractions were analyzed in ESC and post-neural induction cultures, respectively (Nestin signal not shown). RDs imaged by conventional microscopy (first panel column), GSDIM (pixel size 10 nm; second and third panel columns), and RD detection (fourth panel column) by automated image analysis. (C) Nearest neighbor distance (NND) distributions in ESCs (red) and NSCs (blue) (sample sizes: nES = 24, nNS = 19; RDs: nESC = 2,410, nNSC = 2,576; pixel size = 10 nm).
Figure 3
Figure 3
Loop Formation Is Associated with Gains in CTCF and Cohesin Binding (A) Example of concomitant loop gain (in situ Hi-C) and increased CTCF ChIP-seq signal. (B) Anchors of induced loops primarily overlap CTCF peaks that gain CTCF and Rad21 signal upon neural induction of ESCs. The union of CTCF peaks identified in ESCs and NSCs (PCTCF) was considered. ChIP-seq reads were counted inside each PCTCF interval, and differences were assessed with the DESeq2 method. PCTCF with padj. < 0.1, for which NSC/ESC > 1 were also considered gained. Top: loops for which both anchors overlapped at least one CTCF peak. Bottom: loops with a single CTCF peak at each anchor (n = 479, 20% of loops, consistent with Rao et al. [2014]). (C) Loop induction correlates with a gain of CTCF peaks located primarily at loop anchors and facing the interior of the loop. Increased sites were those where the normalized ChIP-seq ratio of NSC/ESC was > 1 and padj. < 0.1 (DESeq2 method). CTCF peaks were further stratified based on the orientation of the CTCF motif (forward and reverse groups). Each domain, defined by the anchors of an induced loop, was divided into 250 intervals (x axis; ten intervals were appended to the starts and ends of the loop domains), and the overlap with CTCF peaks was assessed therein. The percentage of domains intersecting a CTCF peak group is shown along the y axis.
Figure 4
Figure 4
Pluripotent Stem Cell Chromatin Features Weak Chromatin Domain Boundaries (A) Schema of the definition of the insulation score at a boundary between two domains (gray) as the log2 of the ratio of “inside” to “between” interactions. The score is positive for strong insulators and negative for weak insulators. (B) Insulatory strength of CTCF sites at contact domain boundaries is correlated with loop formation. Bins overlapping a CTCF peak and at domain boundaries were stratified based on whether they overlapped with a loop anchor (with/without loop; p values: two-sided t test, NSCs, in situ Hi-C data). (C) Difference of insulation scores (NSC minus ESC) at anchors of reduced, common, and induced loops (p < 2.2 × 10−16, two-sided t test; induced versus reduced loops, in situ Hi-C data). (D) Boundaries of contact domains display overall lower insulation score in ESCs relative to differentiated cells. (E) CTCF and Rad21 binding more frequently increases at boundaries of contact domains than at other genomic locations (p < 2.2 × 10⁻¹⁶, two-sided t test), which preferentially lose CTCF and Rad21 signals, consistent with the detection of greater numbers of peaks in ESCs. (F) Reprogramming-induced depletion of loops; average of the Hi-C profiles (data from Krijger et al., 2016) at induced loops (in situ Hi-C data, n = 2,454) in NSCs and reprogrammed derivatives. (G) Insulation scores at contact domain boundaries are diminished upon reversion of NSCs to iPSCs (two-sided t test).
Figure 5
Figure 5
Chromatin Topology Is Established Progressively during Differentiation (A) Experimental design: in vitro conditions to obtain uniform cultures of ground-state pluripotent cells (ESCs maintained in 2i/LIF) and primed pluripotent stem cells (post-implantation epiblast stem cells [EpiSCs]). (B) Composite profile of TCC signal at loops identified as stronger in ESCs (top) or EpiSCs (bottom). (C) Length distribution of loops specific to ESCs and EpiSCs. (D) Composite profile of loops displaying a significant alteration of TCC signal between ESCs (2i/LIF) and NSCs. Loops identified in either or both conditions were considered (TCC data). (E) Loops are gained in a stepwise manner following loss of naive pluripotency. Loops identified as induced in NSCs relative to ESCs (2i/LIF) were considered (TCC data). Induced loops were grouped into three classes according to genomic span. For each class, ratios of the loop signal between ESCs or NSCs to the signal in EpiSCs are displayed. Loop strength in EpiSCs is between that of ESCs and NSCs (two-sided t test). (F) Interactions across anchors of NSC-specific loops are gradually lost. The two panels display the ratios between composite profiles of the TCC signal around anchors of induced loops (ESCs [2i/LIF] versus NSCs; TCC data) at 10-kb resolution. Left: ratio of ESC (2i/LIF) to NSC TCC signal; right plot: ratio of ESCs to EpiSCs.
Figure 6
Figure 6
Loop Dynamics and the Regulation of Gene Expression (A) Loop domains are genomic intervals defined by the end of the left anchor (+10 kb) and the start of the right anchor (−10 kb). (B) Induced loops (in situ Hi-C; n = 2,454) preferentially connect active regulatory elements. Enrichment relative to random pairs of loci separated by a similar genomic distance is indicated above each bar. Inset: the number of up- and downregulated genes (DESeq method; FC > 1.5; adjusted p < 0.1) among loci with promoters forming a loop with enhancers in NSCs only. (C) Example of an upregulated locus (Lhx2) inside an induced loop domain. (D) Induced loop domains are formed around activated enhancers and upregulated genes. The x axis plots the fraction of induced loop domains overlapping induced and repressed enhancers (top) and transcriptionally up- and downregulated genes (bottom). (E) Loop changes correlate with the dynamics of intra-loop-domain promoter-enhancer contacts measured by in situ Hi-C (two-sided t test). (F) Genes and enhancers active in adult neuronal tissues are found more frequently inside induced than reduced loop domains (Fisher’s exact test).

Similar articles

Cited by

References

    1. Anders S., Huber W. Differential expression analysis for sequence count data. Genome Biol. 2010;11:R106. - PMC - PubMed
    1. Anders S., Pyl P.T., Huber W. HTSeq–a python framework to work with high-throughput sequencing data. Bioinformatics. 2015;31:166–169. - PMC - PubMed
    1. Apostolou E., Ferrari F., Walsh R.M., Bar-Nur O., Stadtfeld M., Cheloufi S., Stuart H.T., Polo J.M., Ohsumi T.K., Borowsky M.L. Genome-wide chromatin interactions of the Nanog locus in pluripotency, differentiation, and reprogramming. Cell Stem Cell. 2013;12:699–712. - PMC - PubMed
    1. Banterle N., Bui K.H., Lemke E.A., Beck M. Fourier ring correlation as a resolution criterion for super-resolution microscopy. J. Struct. Biol. 2013;183:363–367. - PubMed
    1. Beagan J.A., Gilgenast T.G., Kim J., Plona Z., Norton H.K., Hu G., Hsu S.C., Shields E.J., Lyu X., Apostolou E. Local genome topology can exhibit an incompletely rewired 3D-folding state during somatic cell reprogramming. Cell Stem Cell. 2016;18:611–624. - PMC - PubMed

Publication types

MeSH terms

LinkOut - more resources