. 2019 Apr;68(4):693-707.
doi: 10.1136/gutjnl-2018-317570. Epub 2018 Nov 10.

Stromal protein βig-h3 reprogrammes tumour microenvironment in pancreatic cancer

Affiliations

Stromal protein βig-h3 reprogrammes tumour microenvironment in pancreatic cancer

Delphine Goehrig et al. Gut. 2019 Apr.

Abstract

Objective: Pancreatic cancer is associated with an abundant stromal reaction leading to immune escape and tumour growth. This massive stroma drives the immune escape in the tumour. We aimed to study the impact of βig-h3 stromal protein in the modulation of the antitumoural immune response in pancreatic cancer.

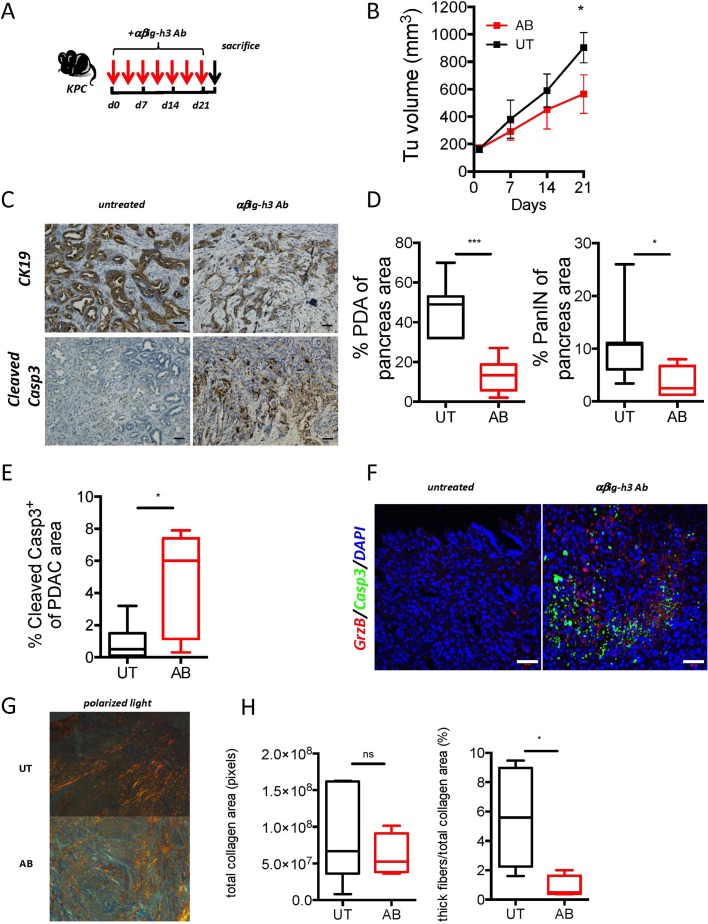
Design: We performed studies with p48-Cre;KrasG12D, pdx1-Cre;KrasG12D;Ink4a/Arffl/fl, pdx1-Cre;KrasG12D; p53R172H mice and tumour tissues from patients with pancreatic ductal adenocarcinoma (PDA). Some transgenic mice were given injections of anti-βig-h3, anti-CD8, anti-PD1 depleting antibodies. Tumour growth as well as modifications in the activation of local immune cells were analysed by flow cytometry, immunohistochemistry and immunofluorescence. Tissue stiffness was measured by atomic force microscopy.

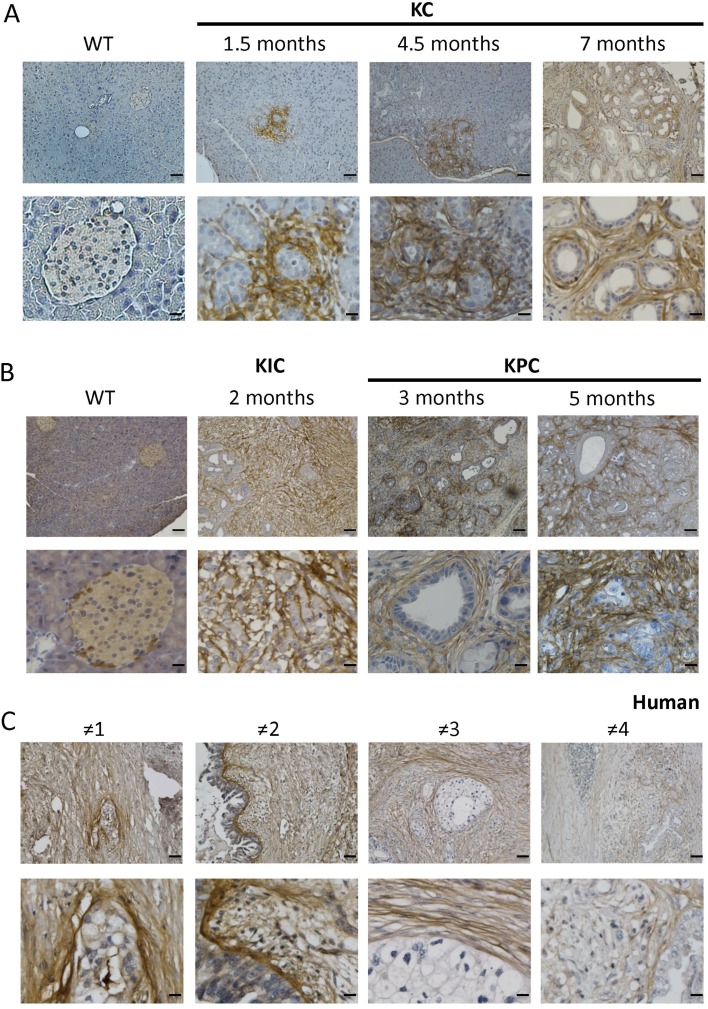
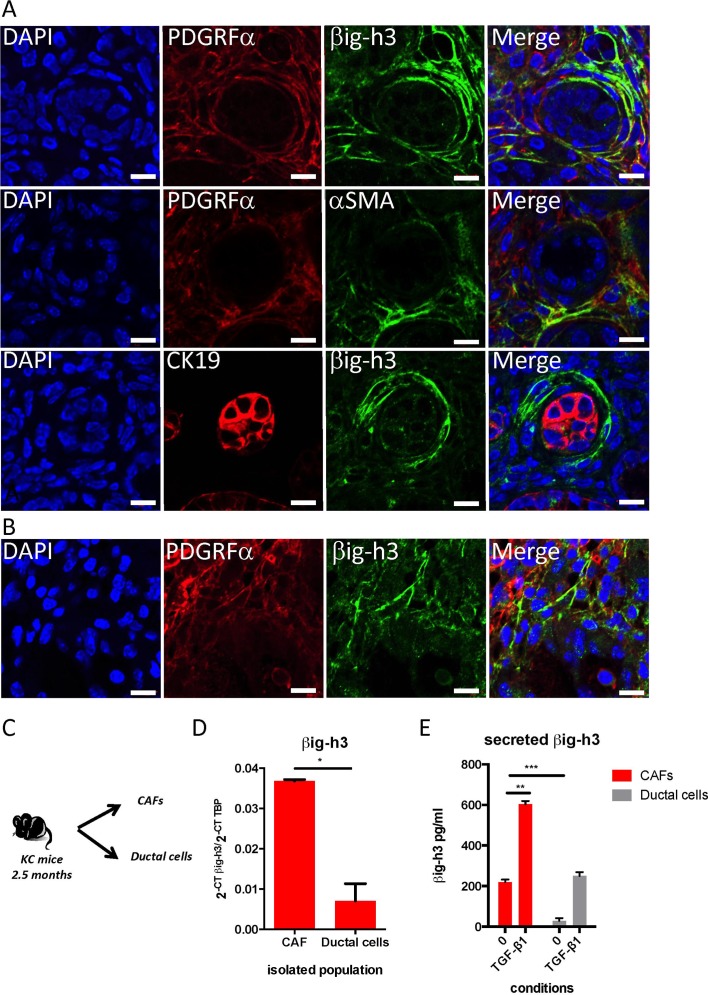
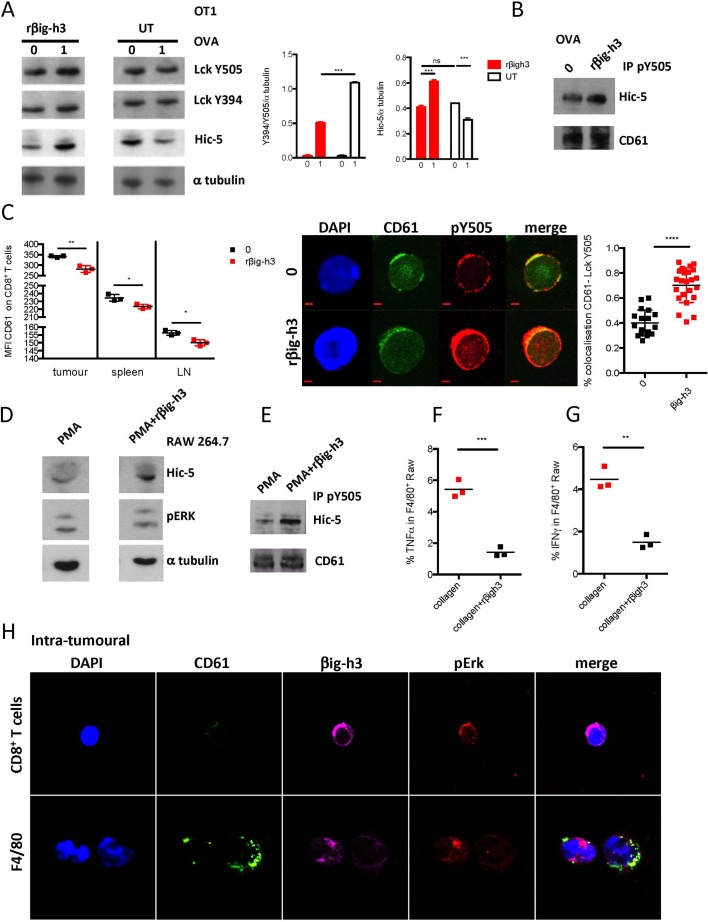
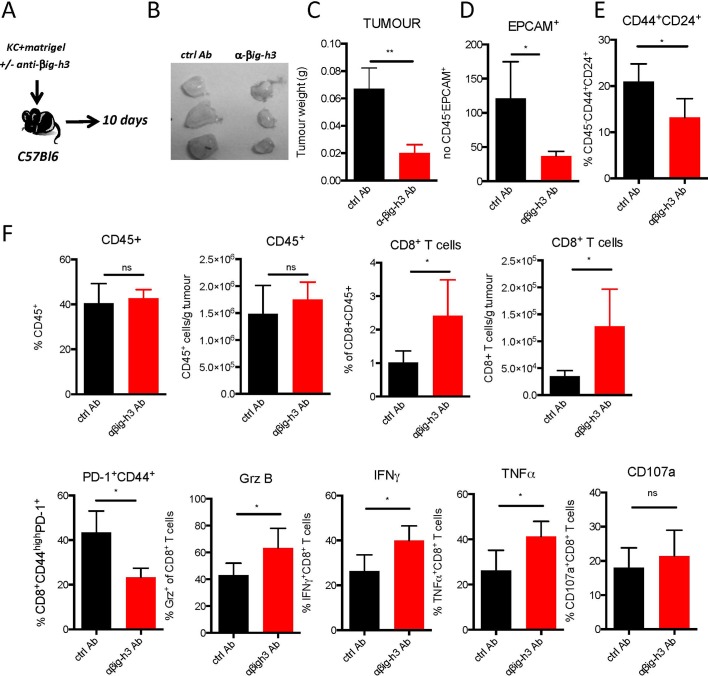
Results: We identified βig-h3 stromal-derived protein as a key actor of the immune paracrine interaction mechanism that drives pancreatic cancer. We found that βig-h3 is highly produced by cancer-associated fibroblasts in the stroma of human and mouse. This protein acts directly on tumour-specific CD8+ T cells and F4/80 macrophages. Depleting βig-h3 in vivo reduced tumour growth by enhancing the number of activated CD8+ T cell within the tumour and subsequent apoptotic tumour cells. Furthermore, we found that targeting βig-h3 in established lesions released the tissue tension and functionally reprogrammed F4/80 macrophages in the tumour microenvironment.

Conclusions: Our data indicate that targeting stromal extracellular matrix protein βig-h3 improves the antitumoural response and consequently reduces tumour weight. Our findings present βig-h3 as a novel immunological target in pancreatic cancer.

Keywords: immune response; pancreatic cancer; t lymphocytes.


Conflict of interest statement

Competing interests: None declared.

Figures

Figure 1
Figure 1
βig-h3 is expressed during early tumourigenesis in pancreatic cancer. Representative immunohistochemical staining for βig-h3 in the pancreas in KC (A) Wild type (WT) mice at 1.5 months, 4.5 months and 7 months old; (B) WT KIC mice at 2 months old and KPC mice at 3 and 5 months old. (C) Representative PDA patients (1–4) are shown. Scale bar, 100 μm (upper) and 25 μm (lower). KC, p48-Cre; KrasG12D; KIC, pdx1-Cre; KrasG12D; Ink4a/Arffl/fl; KPC, pdx1-Cre; KrasG12D; p53R172H; PDA, pancreatic ductal adenocarcinoma.
Figure 2
Figure 2
βig-h3 is expressed mainly in the stromal compartment. Immunofluorescence staining in a pancreas obtained from a 2.5-month-old KC mouse (A) and 2 months old KIC mouse (B) for β ig-h3 or αSMA (green), PDGRFα or CK19 (red) and DAPI (blue). Scale bar, 10 μm. (C) Schematic representation of the isolated cell populations. (D) qPCR analysis of β ig-h3 levels in freshly isolated CAF and ductal cells. TATA-binding protein (TBP) was used as a control housekeeping gene. Relative expression levels were calculated using the equation 2-CT Target/2-CT TBP. The results shown are representative of two independent experiments that included three mice per group. (E) CAF or ductal cells were plated in complete medium or stimulated with 20 ng/mL of TGF-β1 for 48 hours. The levels of secreted βig-h3 were quantified using ELISA in the culture supernatants. The results shown are representative of two independent experiments that included three different CAF preparations and two different ductal preparations. *P<0.05; **p<0.01 and ***p<0.001. CAF, cancer-associated fibroblast; KC, p48- Cre; KrasG12D; KIC, pdx1-Cre; KrasG12DInk4a/Arf fl/fl.
Figure 3
Figure 3
Secreted βig-h3 was quantified using ELISA in the culture supernatants. The results shown are representative of two independent experiments that included three different CAF preparations and two different ductal preparat. Secreted βig-h3 modulates specific CD8+ T cell responses. (A) Pancreatic draining lymph nodes were obtained from KC mice and cultured with mitomycin-treated KC cell line in the presence anti-βig-h3 Ab or ctrl Ab for 5 days. Representative dot plots show the CFSE dilutions of CD8+ T cells expressing CD44. The graph indicates the % of CFSElowCD8+CD44high T cells. Student’s t-test *p<0.05 (B) Representative dot plots show the expression of CD44 and PD-1 in CD8+ T cell population. The graph indicates the % of CD44+PD-1+ among CD8+ T cells. ANOVA (F=13.49, ***p<0.001) and Tukey’s post hoc test. Anti-βig-h3-treated group compared with ctrl Ab group (**p<0.01) and to the non-stimulated group (***p<0.01) (C) Representative dot plots show the expression of Tim-3 and CD8 among CD8+CD44+PD-1+ cells. The graph indicates the % of Tim-3+ among CD8+CD44+PD-1+ T cells. ANOVA (F= 44.08, ***p<0.001) and Tukey’s post hoc test. Anti-βig-h3 treated group compared with ctrl Ab group (***p<0.01) and the non-stimulated group compared with ctrl Ab group (***p<0.01). The results shown are representative of three independent experiments. Ab, antibody; ANOVA, analysis of variance; CFSE, 5,6-carboxyfluorescein diacetate succinimidyl ester; KC, p48-Cre; KrasG12D; Tim-3, T cell immunoglobulin and mucin-domain containing-3.
Figure 4
Figure 4
βig-h3 impacts both CD8+ T cells and macrophages signalling. (A) OT1 T cells were treated with rβig-h3 for 25 min or left untreated (UT), washed and then activated with OVA peptides for 2 min (1 μM). Western blot analysis for LckY505, Lck Y397, Hic-5 and α-tubulin. Quantification of relative band intensity for Lck (Y505/Y394/a tubulin) and Hic-5 (Hic-5/αtubulin) (two independent experiments). (B) OT1 cells were treated with rβig-h3 for 25 min and then activated or not with 1 μM of ovalbumine (OVA) peptide for 2 min. The cells were subjected to IP using anti-Lck Y505 Ab and blotted for Hic-5 protein and CD61. (C) Mean fluorescence intensity of CD61 expression in CD8+ T cells in tumour, spleen and pancreatic lymph node (LN) at time 0 and at 24 hours after treatment with rβig-h3. Confocal immunofluorescence of sorted resting (0) or rβig-h3-treated CD8+ T cells that were obtained from KC pancreata. After 24 hours, the cells were stained with DAPI or for CD61 and Lck Y505. Scale bar, 2 mm. Confocal microscopy was used to show colocalisation between CD61 and pLck Y505. The results were calculated using Zen software according to the Manders method. At least 20 images were analysed for each molecule. (D) Raw 264.8 macrophage cell line was treated for 24 hours with PMA or PMA plus rβig-h3. Western blot analysis of Hic-5 protein et pERK1,2 and αtubulin. (E) Raw 264.8 cells were treated for 24 hours with PMA or PMA plus rβig-h3. The cells were subjected to IP using anti-Lck Y505 Ab and blotted for Hic-5 protein and CD61. Flow cytometry analysis showing percentages of intracellular IFN γ(F) and TNFα(G) in Raw 264.8 macrophages after 48 hours culture on collagen or collagen+rβig-h3 layer. (H) Confocal microscopy of cytospinned intratumoural CD8+ T cells and F4/80+ macrophages from KC pancreata. The results shown are representative of three independent experiments. *P<0.05, **p<0.01, ***p<0.001, ****p<0.0001. Ab, antibody; KC, p48-Cre; KrasG12D.
Figure 5
Figure 5
βig-h3 depletion increases the CD8+ T cell response. (A) Experimental setting. (B) Images of anti-βig-h3-treated and ctrl Ab-implanted tumours. (C) Tumour weights. FACS analysis of the percentages of EPCAM+ CD45 cells (D), CD44+CD24+CD45 cells (E), CD45+CD8+ T cells and PD-1+CD44+ and granzyme B+, IFNγ+, TNFα+, CD107a+CD8+ T cells in implanted tumours (F). The results shown are representative of three independent experiments that included five mice per group. *P<0.05 and **p<0.01.
Figure 6
Figure 6
βig-h3 depletion affects tumour growth in both early and advanced lesions. (A) Experimental setting. (B) Percentage of CD45+, CD8+ T cells among CD45+ cells and numbers/g and the percentage of EPCAM+ cells among CD45 cells (C). (D) Experimental setting. Tumour weights. E) Experimental setting. (F) FACS analysis of the number of CD8+ IFNγ+ T cells and F4/80/g of tumour. (G) Representative immunohistochemistry photos for F4/80 and cleaved caspase-3 in anti-βig-h3-treated and ctrl treated KIC implanted cells in CD8+ T cell depleted C57Bl/6 recipients. Scale bar 100 μm. The results shown are representative of three independent experiments that included five mice per group. *P<0.05, **p< 0.01. KC, p48- Cre; KrasG12D.
Figure 7
Figure 7
βig-h3 depletion in established PDA leads to reduced tumour volume. (A) Experimental protocol used for antibody depletion. (B) Tumoural volume was quantified using ultrasound (Vevo2100) in Ab-treated animals. (C) Representative immunohistochemistry for CK19 and cleaved caspase-3 in anti-βig-h3-treated (AB) and untreated (UT) KPC mice. Scale bar, 50 μm. (D) Quantification of PDA and PanIN areas based on CK19 staining and (E) quantification of the results of staining for cleaved caspase-3. (F) Representative immunofluorescence staining for granzyme B, cleaved caspase-3 and DAPI in antiβig-h3-treated and UT KPC mice. Scale bar, 50 μm. The experiment was performed using five to six mice per group. *P<0.05 and ***p<0.001. (H) Quantification of total collagen (transmitted light) and thick fibres (polarised light) content and representative photos in polarised light in treated (AB) and (UT mice. Scale bar 50 μm. *P<0.05, ****p<0.0001. Ab, antibody; KC, p48-Cre; KrasG12D; PDA, pancreatic ductal adenocarcinoma.

Comment in

References

    1. Kern SE, Shi C, Hruban RH. The complexity of pancreatic ductal cancers and multidimensional strategies for therapeutic targeting. J Pathol 2011;223:296–307. 10.1002/path.2813 - DOI - PMC - PubMed
    1. Hezel AF, Kimmelman AC, Stanger BZ, et al. . Genetics and biology of pancreatic ductal adenocarcinoma. Genes Dev 2006;20:1218–49. 10.1101/gad.1415606 - DOI - PubMed
    1. Apte MV, Haber PS, Applegate TL, et al. . Periacinar stellate shaped cells in rat pancreas: identification, isolation, and culture. Gut 1998;43:128–33. 10.1136/gut.43.1.128 - DOI - PMC - PubMed
    1. Ene-Obong A, Clear AJ, Watt J, et al. . Activated pancreatic stellate cells sequester CD8+ T cells to reduce their infiltration of the juxtatumoral compartment of pancreatic ductal adenocarcinoma. Gastroenterology 2013;145:1121–32. 10.1053/j.gastro.2013.07.025 - DOI - PMC - PubMed
    1. Heinemann V, Reni M, Ychou M, et al. . Tumour-stroma interactions in pancreatic ductal adenocarcinoma: rationale and current evidence for new therapeutic strategies. Cancer Treat Rev 2014;40:118–28. 10.1016/j.ctrv.2013.04.004 - DOI - PubMed

Publication types

MeSH terms

Substances