. 2018 Oct;32(10):937-963.
doi: 10.1007/s10822-018-0170-6. Epub 2018 Nov 10.

Overview of the SAMPL6 host-guest binding affinity prediction challenge

Affiliations

Overview of the SAMPL6 host-guest binding affinity prediction challenge

Andrea Rizzi et al. J Comput Aided Mol Des. 2018 Oct.

Abstract

Accurately predicting the binding affinities of small organic molecules to biological macromolecules can greatly accelerate drug discovery by reducing the number of compounds that must be synthesized to realize desired potency and selectivity goals. Unfortunately, the process of assessing the accuracy of current computational approaches to affinity prediction against binding data to biological macromolecules is frustrated by several challenges, such as slow conformational dynamics, multiple titratable groups, and the lack of high-quality blinded datasets. Over the last several SAMPL blind challenge exercises, host-guest systems have emerged as a practical and effective way to circumvent these challenges in assessing the predictive performance of current-generation quantitative modeling tools, while still providing systems capable of possessing tight binding affinities. Here, we present an overview of the SAMPL6 host-guest binding affinity prediction challenge, which featured three supramolecular hosts: octa-acid (OA), the closely related tetra-endo-methyl-octa-acid (TEMOA), and cucurbit[8]uril (CB8), along with 21 small organic guest molecules. A total of 119 entries were received from ten participating groups employing a variety of methods that spanned from electronic structure and movable type calculations in implicit solvent to alchemical and potential of mean force strategies using empirical force fields with explicit solvent models. While empirical models tended to obtain better performance than first-principle methods, it was not possible to identify a single approach that consistently provided superior results across all host-guest systems and statistical metrics. Moreover, the accuracy of the methodologies generally displayed a substantial dependence on the system considered, emphasizing the need for host diversity in blind evaluations. Several entries exploited previous experimental measurements of similar host-guest systems in an effort to improve their physical-based predictions via some manner of rudimentary machine learning; while this strategy succeeded in reducing systematic errors, it did not correspond to an improvement in statistical correlation. Comparison to previous rounds of the host-guest binding free energy challenge highlights an overall improvement in the correlation obtained by the affinity predictions for OA and TEMOA systems, but a surprising lack of improvement regarding root mean square error over the past several challenge rounds. The data suggests that further refinement of force field parameters, as well as improved treatment of chemical effects (e.g., buffer salt conditions, protonation states), may be required to further enhance predictive accuracy.

Keywords: Binding affinity; Blind challenge; Cucurbit[8]uril; Free energy; Host–guest; Octa-acid; SAMPL6.


Figures
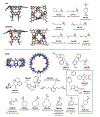
Figure 1.
Figure 1.. Hosts and guests featured in the SAMPL6 host-guest blind challenge dataset.
Three-dimensional structures of the three hosts featured in the SAMPL6 challenge dataset (OA, TEMOA, and CB8) are shown in stick view from top and side perspective views. Carbon atoms are represented in gray, hydrogens in white, nitrogens in blue, and oxygens in red. Guest ligands for each complex are shown as two-dimensional chemical structures annotated by hyphenated host and guest names. Protonation states of the guest structures correspond to the predicted dominant microstate at the experimental pH at which binding affinities were collected, and matches those provided in the mol2 and sdf input files shared with the participants when the challenge was announced. The same set of guests OA-G0 through OA-G7 was used for both OA and TEMOA hosts. The gray frame (lower right) contains the three CB8 guests that constitute the bonus challenge.
Figure 2.
Figure 2.. Overview of experimental binding affinities for all host-guest complexes in the SAMPL6 challenge set.
Binding free energies (ΔG) measured via isothermal titration calorimetry (ITC) are shown (1lled circles), along with experimental uncertainties denoting standard error of the mean (black error bars), for OA (yellow), TEMOA (green), and CB8 (blue) complexes.
Figure 3.
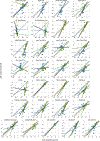
Figure 3.. Free energy correlation plots obtained by the methods on the three host-guest sets.
Scatter plots showing the experimental measurements of the host-guest binding free energies (horizontal axis) against the methods’ predictions on the OA (yellow), TEMOA (green), and CB8 (blue) guest sets with the respective regression lines of the same color. The solid black line is the regression line obtained by using all the data points. The gray shaded area represent the points within 1.5 kcal/mol from the diagonal (dashed black line). Only a representative subset of the movable type calculations results are shown. See Supplementary Figure 7 for the free energy correlation plots of all the movable type predictions.
Figure 4.
Figure 4.. Bootstrap distribution of the methods performance statistics.
Bootstrap distributions of root mean square error (RMSE), mean signed error (ME), coefficient of determination (R2) and Kendall rank correlation coefficient (τ). For each methodology and statistic, two distributions are shown for the merged OA/TEMOA set (yellow, pointing upwards) and the CB8 set excluding the bonus challenge compounds (blue, downwards). The black horizontal box between the two distributions of each method shows the median (white circle) and interquartile range (box extremes) of the overall distribution of statistics (i.e., pooling together the OA/TEMOA and CB8 statistic distributions). The short vertical segment in each distribution is the statistic computed using all the data. The distributions of the methods that incorporate previous experimental data into the computational prediction are highlighted in gray. Methodologies are ordered using the statistics computed on the OA/TEMOA set, unless only data for the CB8 set was submitted (e.g., DDM-FM), in which case the CB8 set statistic was used to determine the order. Only a representative subset of the movable type calculations results are shown. See Supplementary Figure 8 for the bootstrap distributions including all the movable type submissions.
Figure 5.
Figure 5.. Free energy error statistics by molecule and tightest binders ranking.
(A) Root mean square error (RMSE) and mean signed error (ME) computed using the ten methodologies with the lowest RMSE on the merged OA/TEMOA and CB8 datasets (excluding bonus challenge compounds) for all guests binding to OA (yellow), TEMOA (green), and CB8 (blue). Error bars represent 95-percentile bootstrap confidence intervals. (B) Ranking of the tightest binder of each host-guest dataset for all methods. Methods that correctly predicted OA-G2, TEMOA-G4, and CB8-G8 to be the tightest binders of the OA (yellow), TEMOA (green), and CB8 (blue) guest sets respectively are marked by a colored cell. A gray cell is shown when the method incorrectly predicted the tightest binder, and a white space is left if no submissions were received for that method and guest set. The methods are ordered by the number of correctly ranked tightest binders in the three guest sets.
Figure 6.
Figure 6.. CB analogues and distribution of RMSE and R2 achieved by methods in SAMPL3 and SAMPL5.
(A) Probability distribution fitting of root mean square error (RMSE, left column) and coefficient of determination (R2, right column) achieved by all the methods entering the SAMPL6 (yellow), SAMPL5 (green), and SAMPL3 (purple) challenge. Statistics for SAMPL4 are not shown in the panel because the subject of the challenge was confined to relative binding affinity predictions. The markers on the x-axis indicate the medians of the distributions. Distributions are shown for all the methods entering the challenge (solid line, square marker), excluding the SAMPL6 entries that used previous experimental data (dotted line, triangle marker), or isolating alchemical and potential of mean force methodologies that did not use an experiment-based correction (dashed line, circle marker). The RMSE axis is truncated to 14 kcal/mol, and a few outlier submissions are not shown. The data shows an essentially identical median RMSE and an increased median correlation on the combined OA/TEMOA guest sets (top row) with respect to the previous round of the challenge. The comparison of the results to different sets of guests binding few cucurbit[n]uril and cucurbit[n]uril-like hosts appearing in SAMPL3 and SAMPL5 (bottom row) shows instead a deteriorated performance in the most recent round of the challenge, which is likely explained by the major complexity of the SAMPL6 C8 guest set. (B) Three-dimensional structures in stick view of the CBClip (top) and H1 (bottom) hosts featuring in SAMPL5 and SAMPL3 respectively. Carbon atoms are represented in gray, nitrogens in blue, oxygens in red, and sulfur atoms in yellow. Hydrogen atoms are not shown. (C) Box plot comparing the range of the binding affinity experimental measurements used as references for the host-guest systems entering the SAMPL3 (purple), SAMPL4 (light blue), SAMPL5 (green), or SAMPL6 (yellow) challenges. The gray data points represent the measurements for the single host-guest entries. The the inter-quartile range and the median represented by the rectangular box were obtained by linear interpolation. The whiskers span the entire dynamic range of reported experiemntal measurements.

References

    1. Abel R and Bhat S (2017). Free Energy Calculation Guided Virtual Screening of Synthetically Feasible Ligand R-Group and Scaffold Modifications: An Emerging Paradigm for Lead Optimization. In Annual Reports in Medicinal Chemistry, volume 50, pages 237–262. Elsevier.
    1. Abel R, Mondal S, Masse C, Greenwood J, Harriman G, Ashwell MA, Bhat S, Wester R, Frye L, Kapeller R, and Friesner RA (2017a). Accelerating drug discovery through tight integration of expert molecular design and predictive scoring. Curr. Opin. Struct. Biol, 43:38–44. - PubMed
    1. Abel R, Wang L, Harder ED, Berne BJ, and Friesner RA (2017b). Advancing Drug Discovery through Enhanced Free Energy Calculations. Acc. Chem. Res, 50(7):1625–1632. - PubMed
    1. Abel R, Wang L, Mobley DL, and Friesner RA (2017c). A Critical Review of Validation, Blind Testing, and Real-World Use of Alchemical Protein-Ligand Binding Free Energy Calculations. Curr. Top. Med. Chem, 17(23). - PubMed
    1. Aguilar B, Anandakrishnan R, Ruscio JZ, and Onufriev AV (2010). Statistics and Physical Origins of pK and Ionization State Changes upon Protein-Ligand Binding. Biophys. J, 98(5):872–880. - PMC - PubMed

Publication types